

On April 15 the BTC price decreased considerably, at one point reaching a low of $6,461. In addition, the closing prices were the lowest reached so far in April. However, the trend reversed the next day, and BTC has increased by almost 10% on the day.
Well-known trader @C2M_KillMex has outlined a fractal which explains the current BTC price increase. He suggests that this will be the final high along the current resistance line before a sharp drop ensues. To better illustrate this movement, he has used a very similar pattern that transpired at the end of February.
$BTC
— C2M (@C2M_Killmex) April 14, 2020
'History doesn't repeat itself but it often rhymes'
This would result in a final move towards H4 supply before breaking down. pic.twitter.com/kvDcefS9Hs
February Bitcoin Fractal
The ”February fractal’ being discussed actually began on Jan 26. The price created an ascending support line that was validated thrice and completed a five-wave Eliott formation, reaching a high of $10,491 on Feb 13, 18 days after the ascending support line began. The price broke down below the line after. Since the high, BTC created four successive lower-highs along a descending resistance line. If the fractal continues to be followed, the current BTC price movement is at the fourth touch of this resistance line. After the downward move accelerated, BTC returned all the way to the 0.88 Fibonacci level of the entire upward move before reaching its bottom.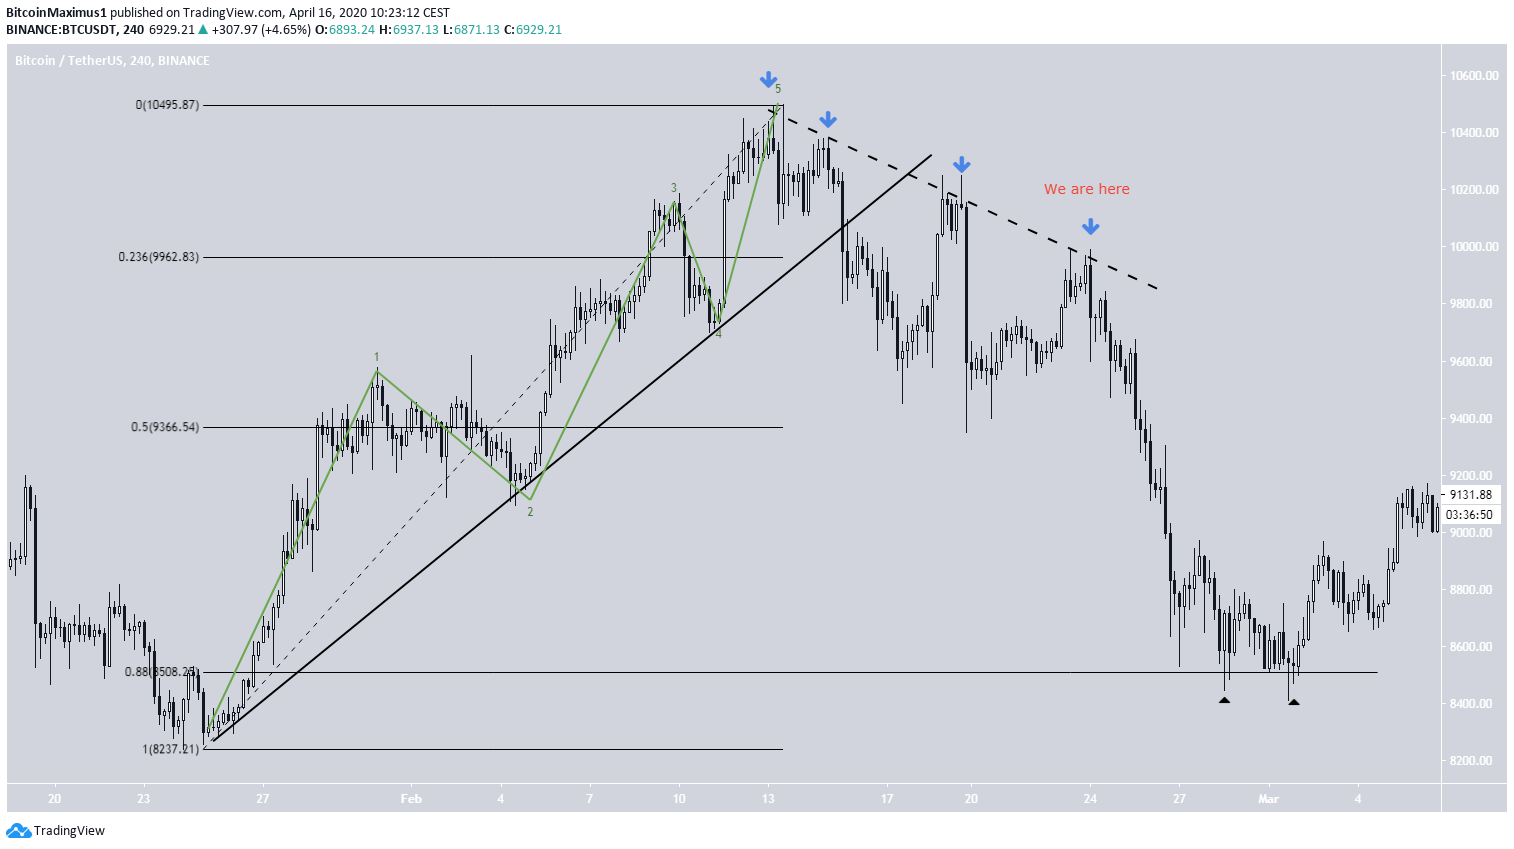
A Bearish Horizon
The most recent rally began on March 20. Interestingly, the move lasted for 18 days, the same amount of time as in February, with the price reaching a local high on April 6. In an almost identical manner, the price created an ascending support line and completed a five-wave Elliott formation. Since the price broke down, it has created a descending resistance line. At the time of writing, it was trading directly on this line, validating it for the fourth time. If the price continues following the fractal, it is likely to reach a low of $6,000, coinciding with the 0.88 Fib level and expected to be reached by the end of the month. We used a similar fractal in a recent analysis article, giving a target of $5,700 reached by the end of the month.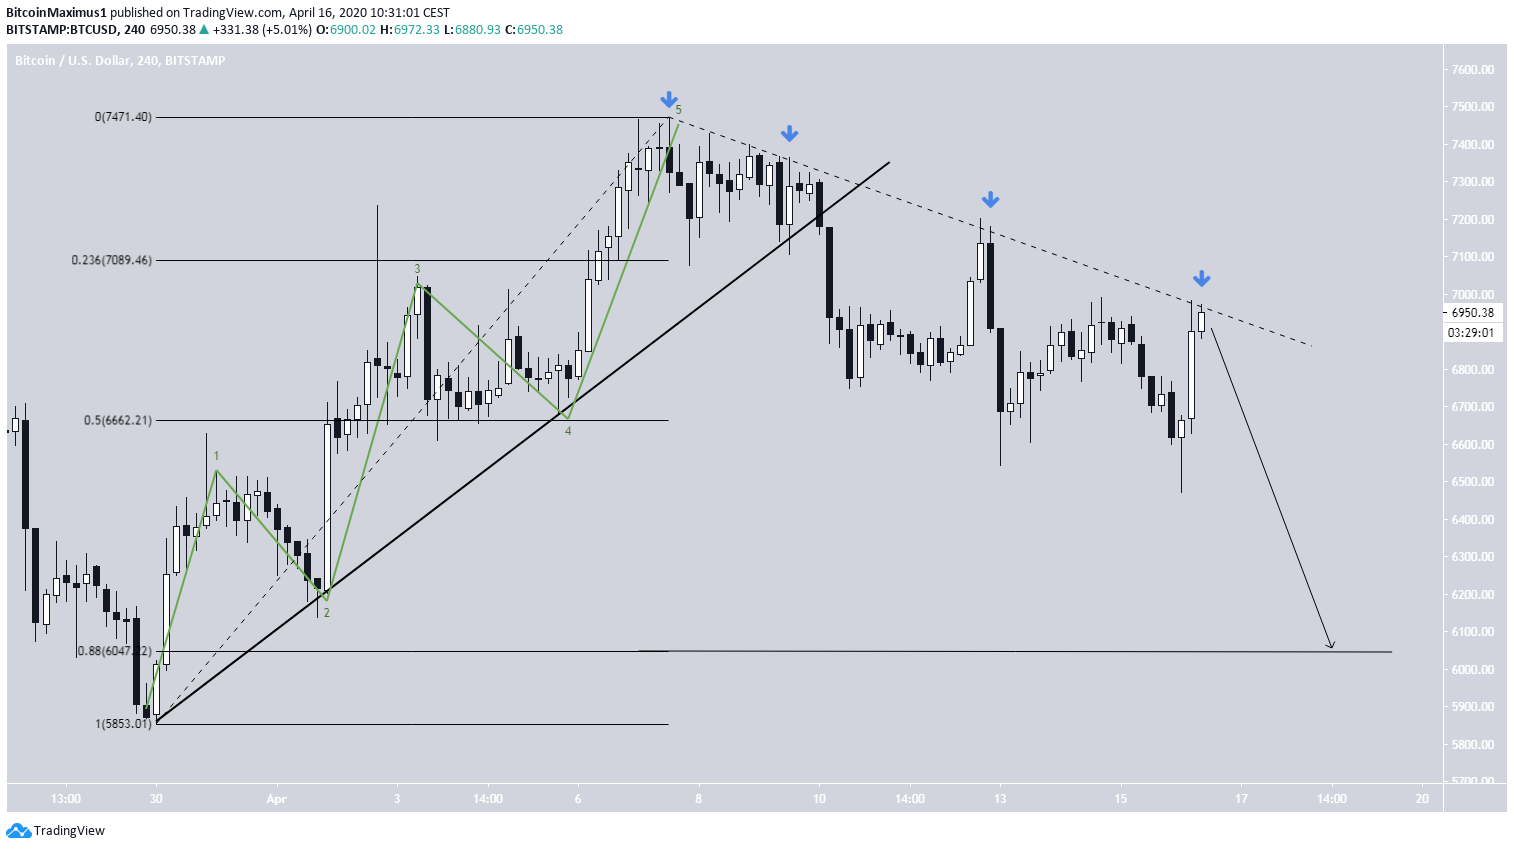 To conclude, the BTC price has possibly been following a fractal from February 2020. If it continues doing so, the price is expected to reach a low between $5,700-$6,000 by the end of the month.
Disclaimer
In line with the Trust Project guidelines, this price analysis article is for informational purposes only and should not be considered financial or investment advice. BeInCrypto is committed to accurate, unbiased reporting, but market conditions are subject to change without notice. Always conduct your own research and consult with a professional before making any financial decisions. Please note that our Terms and Conditions, Privacy Policy, and Disclaimers have been updated.

Valdrin Tahiri
Valdrin discovered cryptocurrencies while he was getting his MSc in Financial Markets from the Barcelona School of Economics. Shortly after graduating, he began writing for several different cryptocurrency related websites as a freelancer before eventually taking on the role of BeInCrypto's Senior Analyst.
(I do not have a discord and will not contact you first there. Beware of scammers)
READ FULL BIO
Sponsored
Sponsored