


Since June 24, the Bitcoin price has been engulfed in a downward trend. The direction of the trend ostensibly changed with the extremely rapid increase on October 25 — which briefly took the price above $10,000.
This has caused numerous individuals to believe that the previous downward trend has ended and the Bitcoin price will continue going up. After all, this was one of the biggest daily increases to date and caused the price to break out from its previous trading range. Combine this with the flurry of positive news for the cryptocurrency industry and we can see why almost everyone has turned into a bull.
However, once we zoom out, the long-term outlook looks significantly gloomier. In fact, the Bitcoin price has not yet confirmed its upward trend — even if that seems likely.
Crypto trader @postyXBT stated that, despite the extremely rapid increase of October 25, the weekly time-frame still gives us a bearish outlook.
$BTC 1W
I'm not a permabear but you have to consider this a possibility..
Price closed the week on resistance. It would be a perfect rounded retest before heading lower.
I'll be using the 1D to analyse specific price action at this level.
I'd prefer 9.6k becoming support! pic.twitter.com/LlU09dCBcx
— Posty (@PostyXBT) October 28, 2019
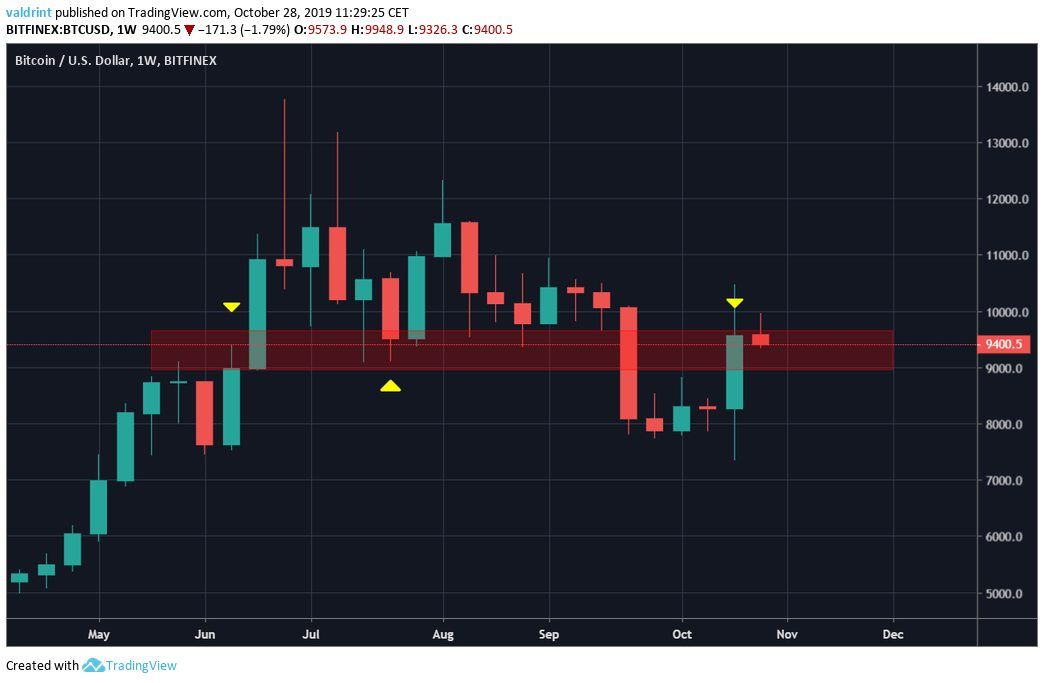
The reason for this comes from the inability to sustain the increase and close the week above the previous resistance area.
Let’s look at this movement closely to see if it gives us any new information on the direction of the next move.
Bitcoin Price: Weekly Close
The main resistance area is found at $9000-$9500. Initially, it ended the first wave of the upward move in May/June. After the Bitcoin price broke out, the same area acted as support until September 23. Currently, the price is trading at $9400 — inside this resistance area.
Throughout July, the price never closed below $9500. The weekly close during last week was a very similar $9570. Therefore, if we discount values reached by a wick — which is relatively customary in the cryptocurrency industry because of its high volatility — we have not yet broken through the previous resistance level.
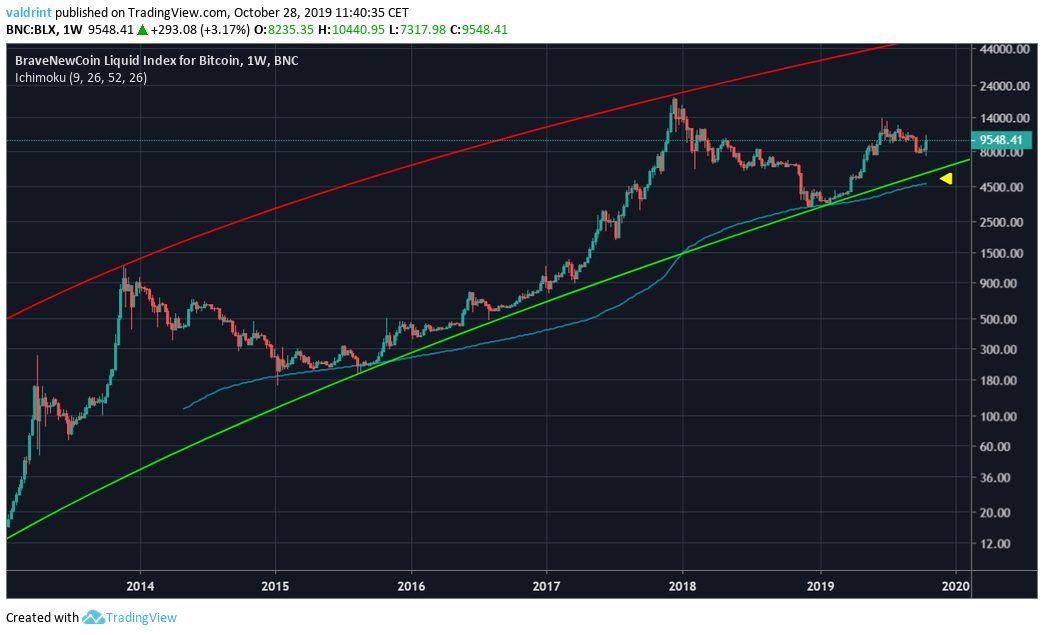
Continuing with a long-term view, we can use curved trend-lines in the logarithmic chart to connect every low since 2011.
The support line currently stands slightly above $6000, along with the 200-week moving average — which acted as support throughout 2015.
Based on the previous price movement, it would not be unusual if the Bitcoin price experienced a decrease and consolidated near the support line before resuming its upward movement.
Disclaimer: This article is not trading advice and should not be construed as such. Always consult a trained financial professional before investing in cryptocurrencies, as the market is particularly volatile.
Did you know you can trade sign-up to trade Bitcoin and many leading altcoins with a multiplier of up to 100x on a safe and secure exchange with the lowest fees — with only an email address? Well, now you do! Click here to get started on StormGain!



