
The Bitcoin (BTC) price created a shooting star candlestick for the month of June. This is a bearish pattern that normally indicates that the previous upward trend has lost its strength and a reversal is near.
However, the short-term trend has no clear direction, and the price has been consolidating over the past two days.
Bitcoin Resistance
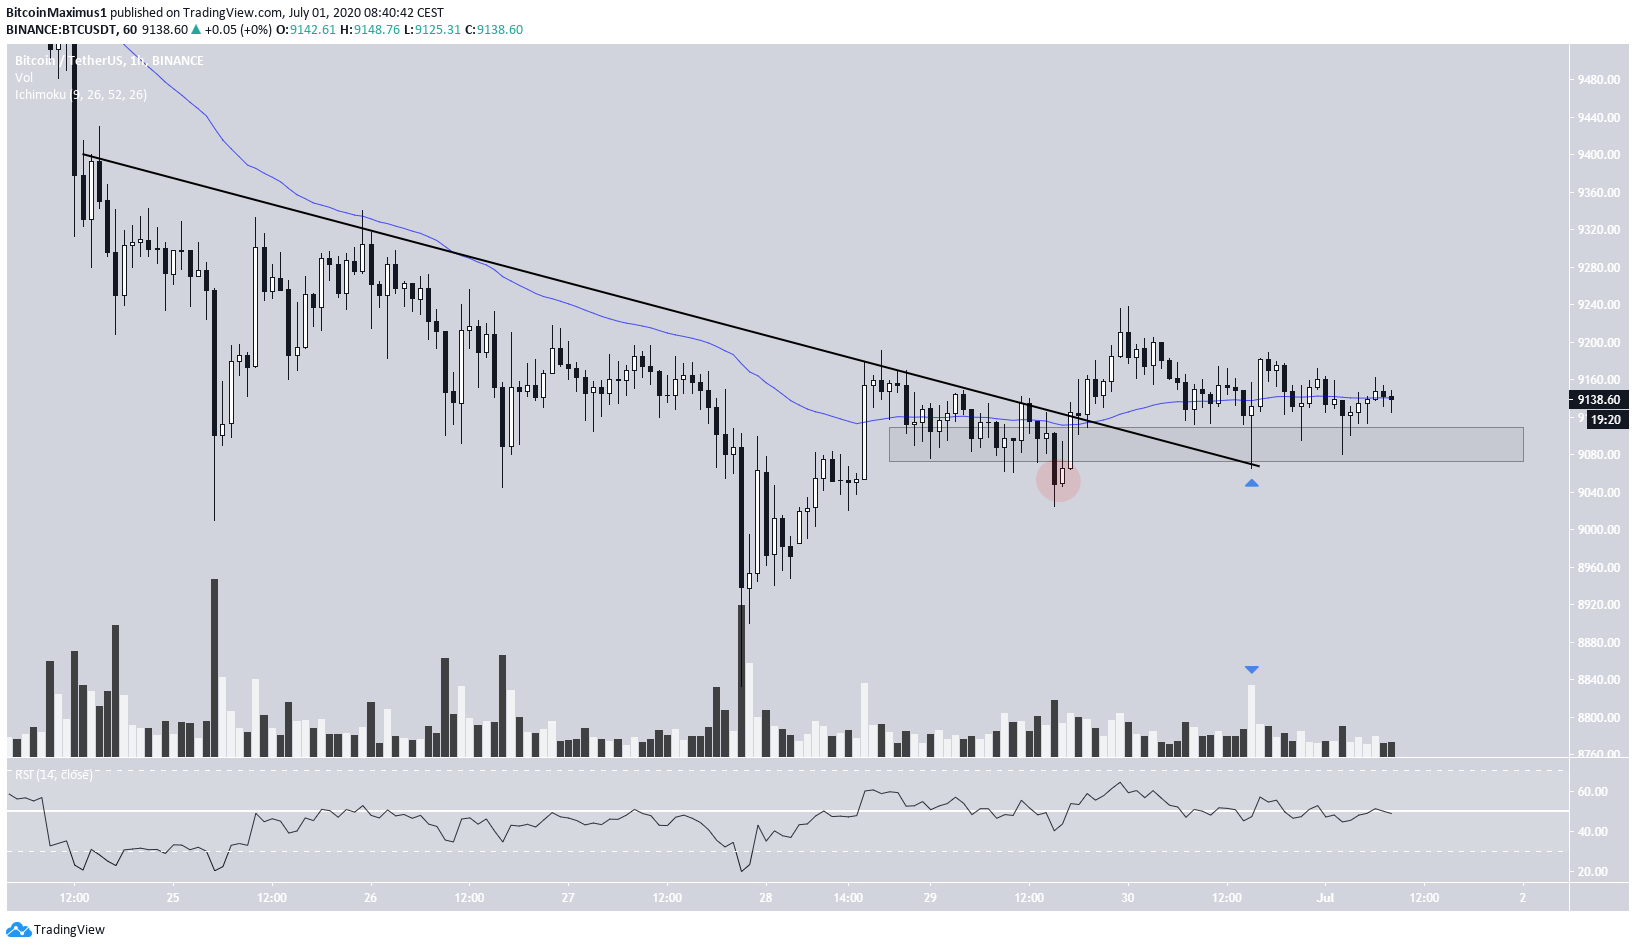
On June 29, the Bitcoin price broke out from a short-term descending resistance line that had been in place since June 24. After breaking out, the price returned to validate this line the next day, creating a bullish hammer with high volume. This movement also solidified the $9,100 minor support area, indicating that the small decrease below this area on June 29 was a failed breakdown since the price reclaimed the area shortly afterward.
However, the short-term trend has no clear direction. This is evident by the 50-hour moving average (MA) since the price is moving freely above and below it, and the hourly RSI, which is moving above and below 50.
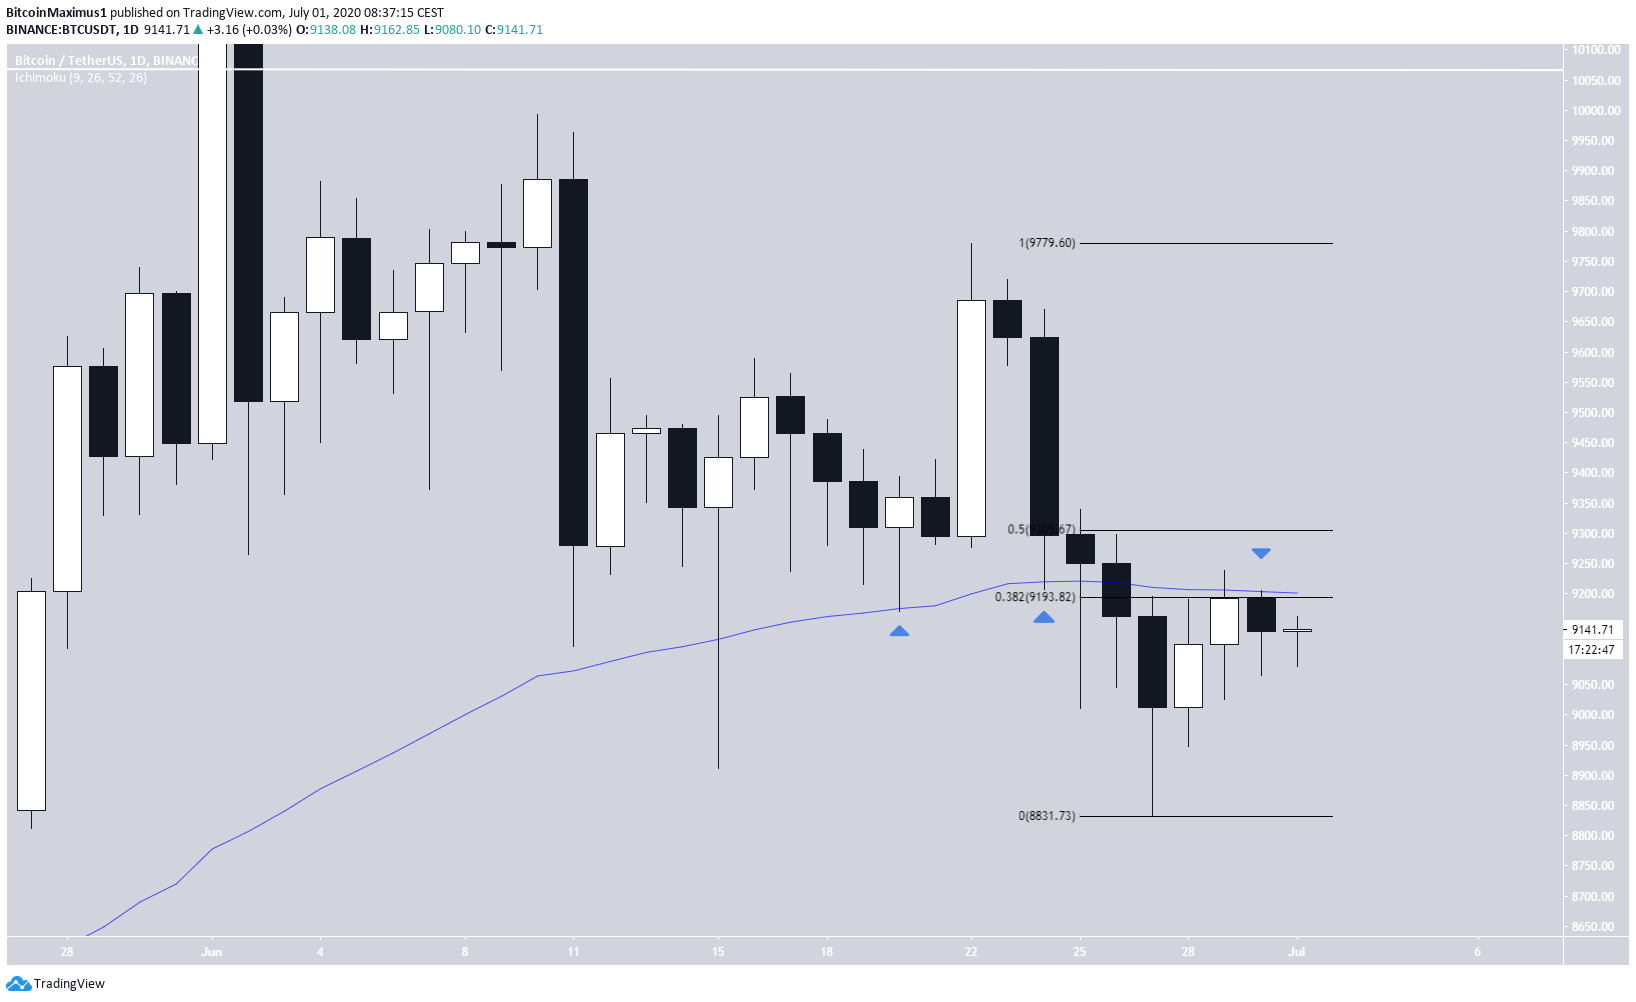
The daily chart reveals that the price is facing strong resistance from the 50-day MA, which previously acted as support. Furthermore, the MA coincides with the 0.382 Fib level of the entire downward move. If successful in breaking out, the price would likely face resistance from the 0.5 Fib level, which is also the middle of the trading range.
Therefore, it is clear that the price is still retracing from its decrease that began on June 22.
Monthly Close
The monthly chart provides a bearish picture. The price completed a shooting star candlestick with a long upper-wick that measured 8.4% and validated the long-term descending resistance line since the all-time high of December 2017.
The shooting star is normally a bearish sign and could mean that the upward move that began after the March 12 bottom has ended, and BTC is now either correcting as a result of that move or has begun a bearish trend.
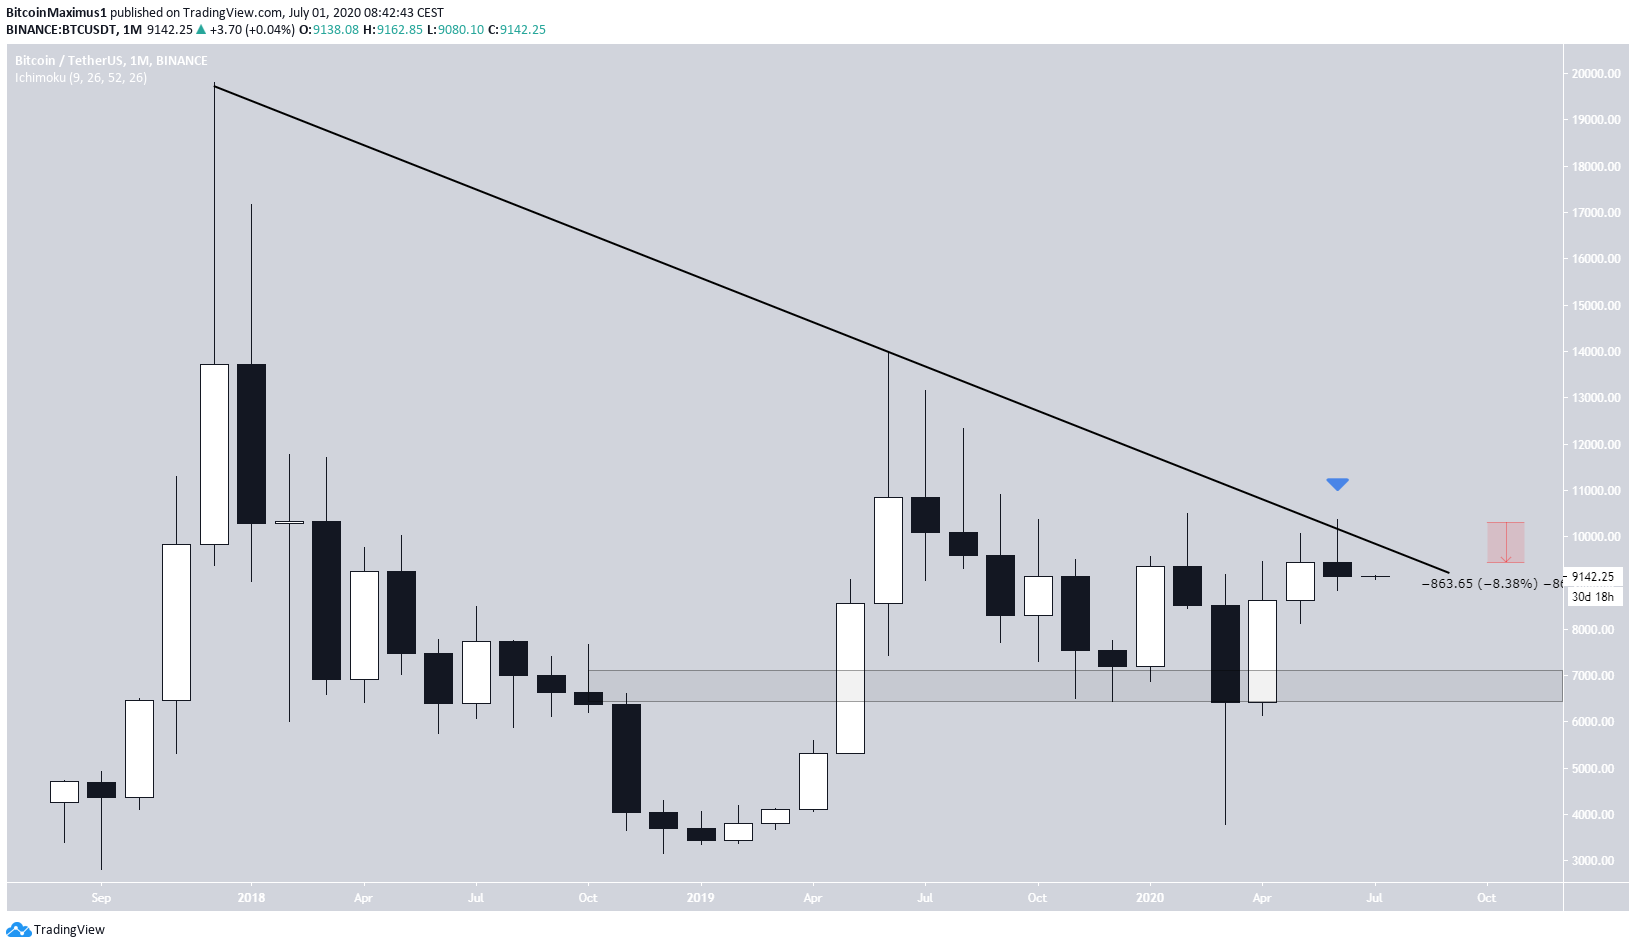
To conclude, BTC created a bearish monthly candlestick which suggests that the current upward move might have reached its end.
For our previous analysis, click here.
