![Bitcoin’s 2015 Fractal Predicts a Pre-Halvening Pump [Premium Analysis]](/_mfes/post/_next/image/?url=https%3A%2F%2Fassets.beincrypto.com%2Fimg%2FXr6a1_xq1vImXsMTSwAYYo9SDGs%3D%2Fsmart%2F72a144b0fadb4892908f18ab27fa0d2e&w=1920&q=75)
On December 18, the Bitcoin price made a double bottom near $6400 and began an upward move that is still ongoing. This increased the possibility that this is the first stage of a new upward trend.
A very similar movement occurred in 2015, after a correction that lasted for roughly two years. Interestingly, this movement transpired only a few months before the second halvening. The third halvening is projected to occur in May 2020, five months from now.
Cryptocurrency analyst & trader @nebraskangooner stated that the Bitcoin price might be following a fractal from 2015. The fractal suggests that the price will initiate another drop towards the low $7000s, before beginning the gradual upward move that takes it above $9000 prior to halving.
Fractal update.
This actually seems like a likely path for the next couple of months
Continuation from here, a dip to low 7ks where everyone starts calling for new lows, then a pre-halvening "pump" above 9k
Failure to break above and hold 10k likely means new lows pic.twitter.com/t0SVoDb5CM
— Nebraskangooner (@Nebraskangooner) December 23, 2019
If this fractal is validated, it would mean that the Bitcoin price has already reached a bottom. Let’s take a closer look at the price movement and see if this really is the case.
Fractal
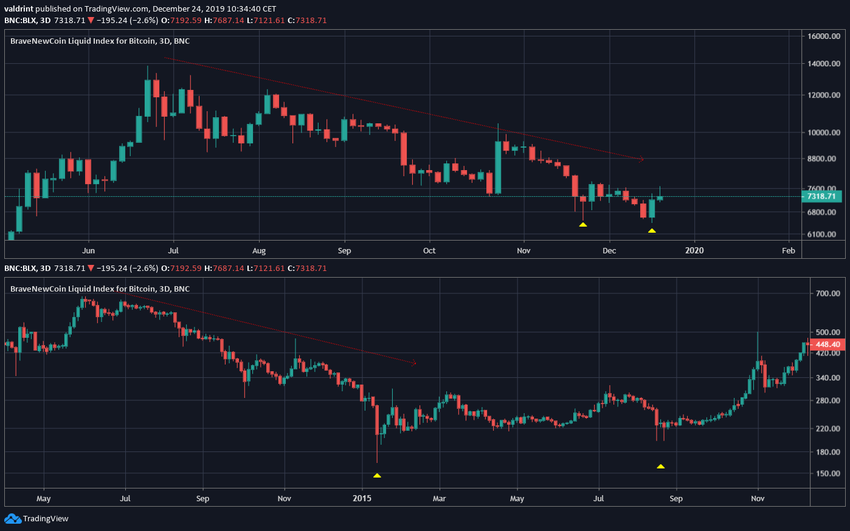
The fractal outlined in the tweet comes from 2014/2015.
The current double bottom coincides with that reached in January and August 2015 (bottom graph). While the movement in 2015 transpired over a longer period of time, both of them share several similarities — mostly stemming from the long downtrend preceding this bullish pattern.
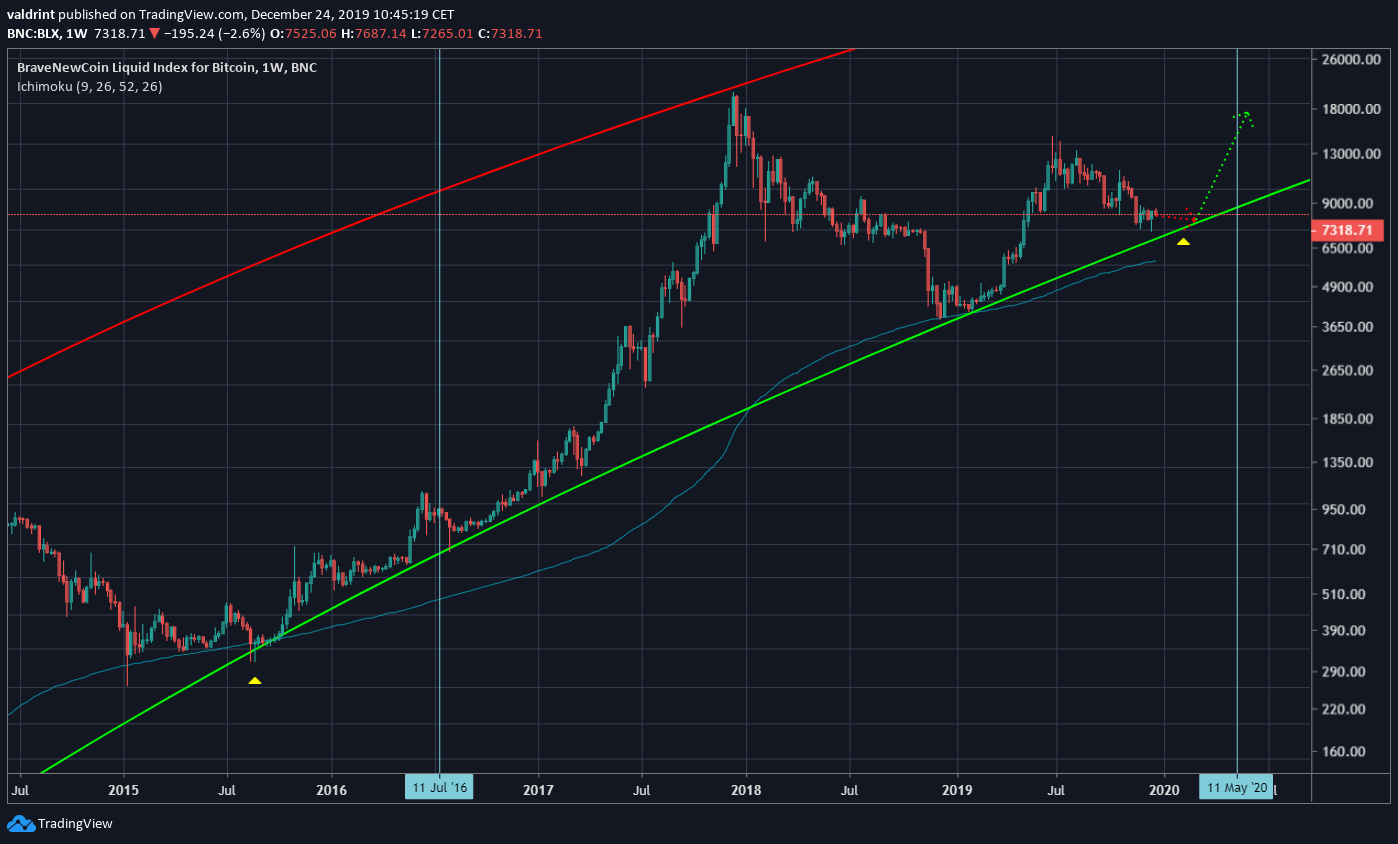
Bitcoin Halvening Angle
We can use curved trendlines to create support and resistance lines for Bitcoin’s entire price history. The current price movement seems very similar to that in August 2015. Both times the price was very close to the support line.
So, a period of sideways movement (the low $7000s mentioned in the tweet) would cause the price to bounce on this support line and also the 200-week moving average.
The vertical lines represent halvening dates. Therefore, this could mean that the price will begin an upward movement in anticipation of halvening.
To conclude, the Bitcoin price is possibly following a fractal from 2014/2015, which suggests that the price is very close to reaching a bottom and a new upward trend will soon follow. The movement prior to the last halvening supports the creation of this fractal.
