

The Bitcoin (BTC) price is possibly following a fractal that begins in October 2015. If it continues doing so, it will reach a high of $10,000 by May 7, at the latest.
The fractal was identified by cryptocurrency trader @Yodaskkk, who tweeted two pictures while comparing the recent Bitcoin movement to that in August 2015, right before a long-term upward move began that lasted until December 2017.
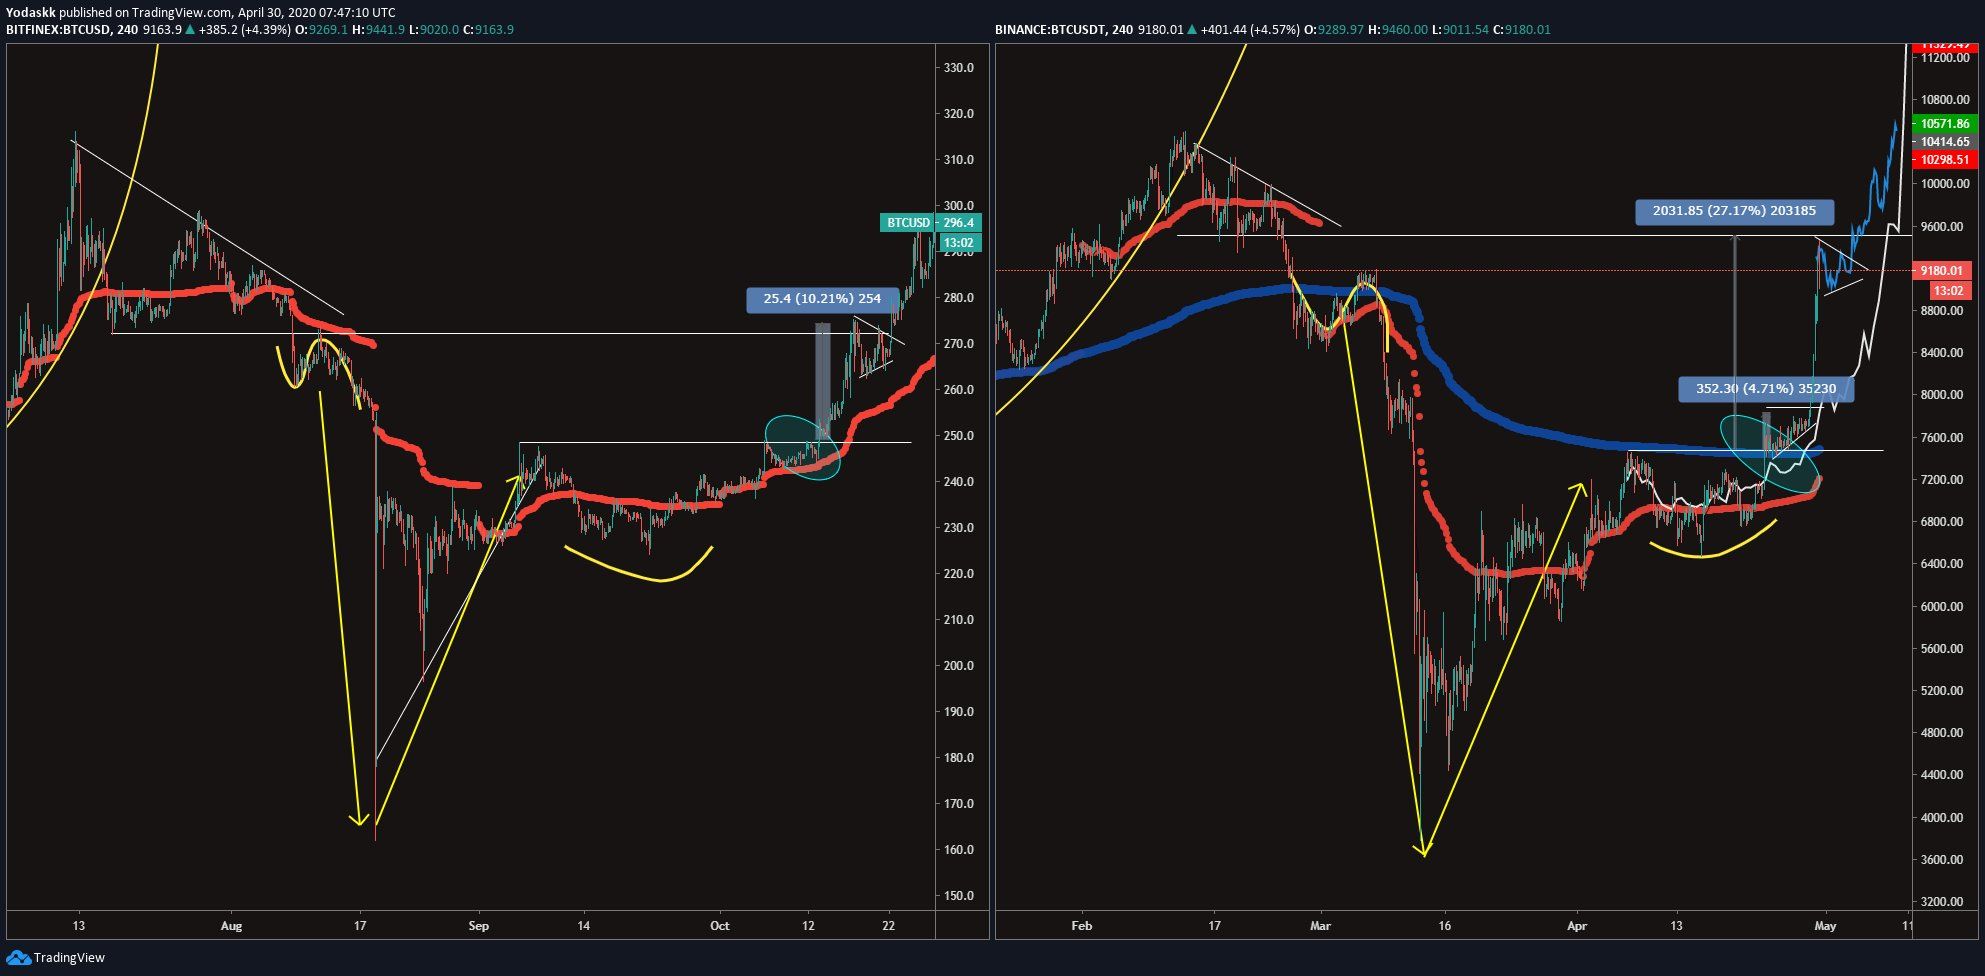
Zoom in version: in 2015, 1st consolidation in a bull pennant at the retest of the descending triangle horizontal. Are we here now ? So a consolidation between 9300-9000 before continuation ? Zoom out version, fractal continue to be hella relevant 😮In this article, we will take a closer look at both movements and determine where the Bitcoin price is likely to head to next.
Comparison
The fractal makes the hypothesis that the March 13, 2020 bottom coincides with August 25, 2015. Both charts are given in the image below, with 2020 being in the upper portion of the image while 2015 is in the bottom portion. The movements look very similar, especially when focusing on the price movement succeeding at the bottom. In 2020, it took the price 48 days to move above the resistance level at $7500, which was the initiator of the drop. In 2015, this movement took 53 days. According to the fractal, yesterday’s $9420 high coincides with the first high reached after the upward move in 2015, outlined in both charts with the shaded circle. Both highs were reached above the upper limit of the Bollinger band and were combined with an overbought value in the RSI — which, however, had not generated any bearish divergence yet. What is interesting is that in the 2015 movement, the price did not validate the resistance it broke out from before continuing upward, even though it came close to doing so. If the same thing occurs this time around, BTC would not return to retest $7300 at all. Rather, it would continue its ascent towards new highs after a shallow retracement.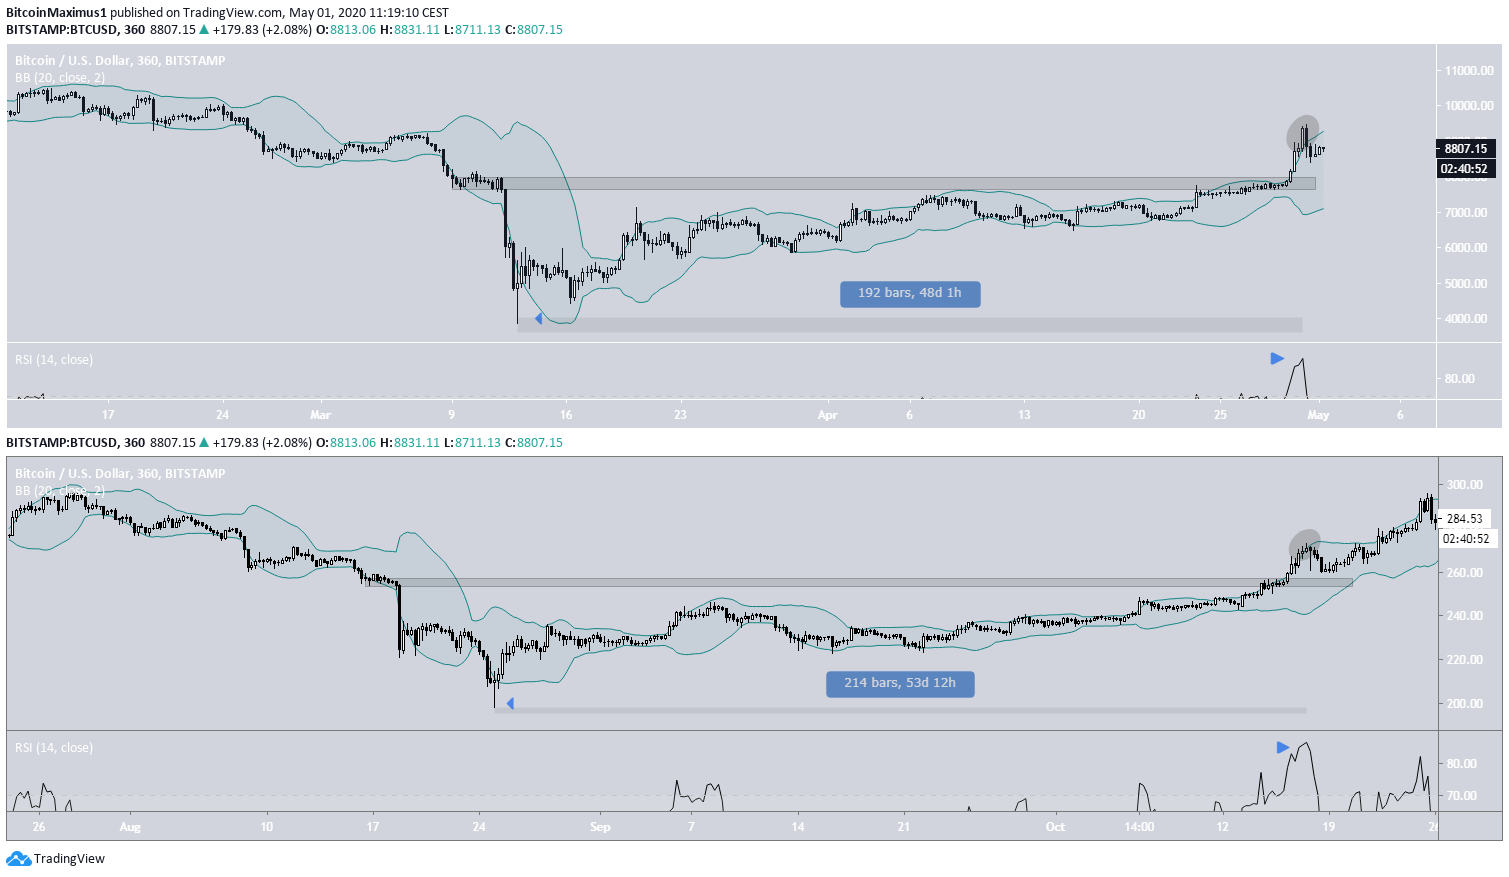
Bitcoin’s Future Movement
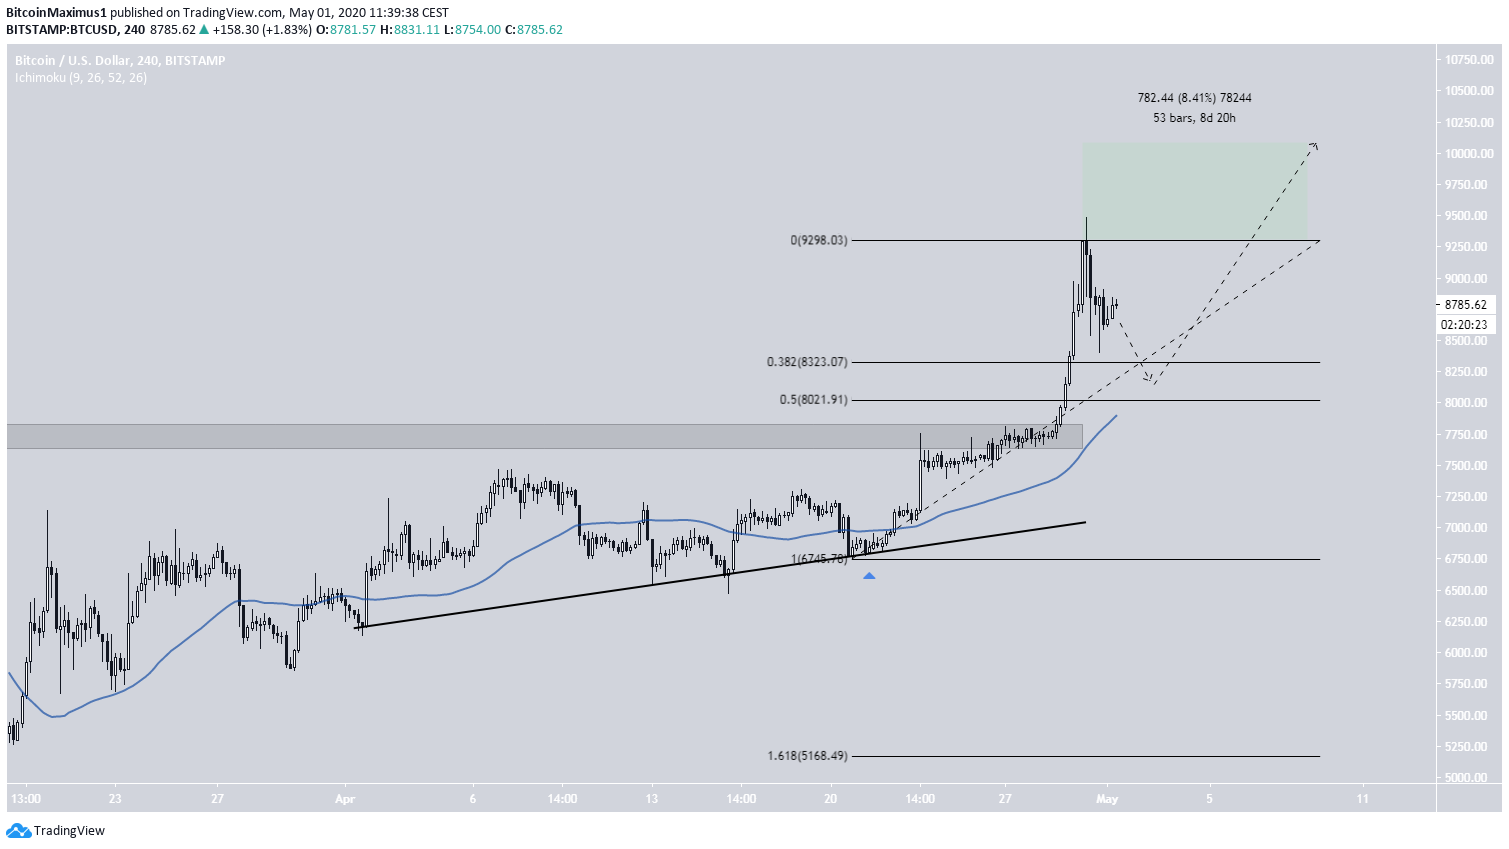
In the 2015 movement, the Bitcoin price had been following an ascending support line for roughly one month, validating it four times before bouncing upwards. The final touch of the support line also coincided with a touch of the 50-hour moving average (MA). After the ensuing increase, the price decreased slightly above the 0.5 Fib level of the entire upward move before continuing its ascent. The next high was 8.33 percent above the first one, reached after eight days.
Long-Term Resistance
Dissimilarities arise between the two movements when you incorporate the long-term preceding resistance line. In the 2020 movement (top), the price was following a descending resistance line for almost three years. The high we are discussing was the fourth touch of this resistance line. In the 2015 movement (bottom), the price had broken out from two major resistance lines well before reaching the aforementioned high.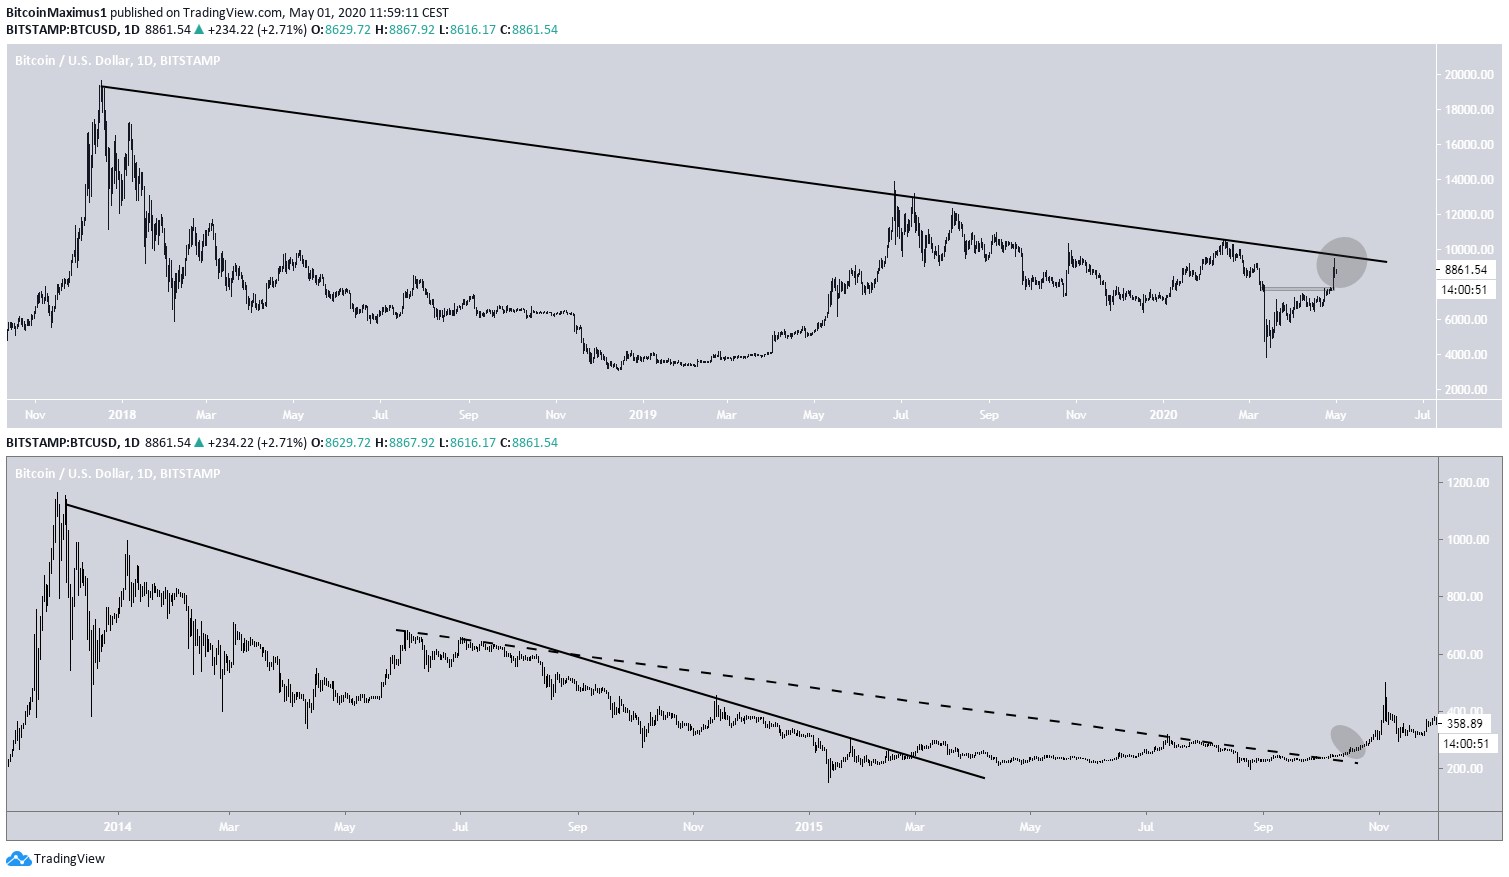
Top crypto platforms in the US
Disclaimer
In line with the Trust Project guidelines, this price analysis article is for informational purposes only and should not be considered financial or investment advice. BeInCrypto is committed to accurate, unbiased reporting, but market conditions are subject to change without notice. Always conduct your own research and consult with a professional before making any financial decisions. Please note that our Terms and Conditions, Privacy Policy, and Disclaimers have been updated.

Valdrin Tahiri
Valdrin discovered cryptocurrencies while he was getting his MSc in Financial Markets from the Barcelona School of Economics. Shortly after graduating, he began writing for several different cryptocurrency related websites as a freelancer before eventually taking on the role of BeInCrypto's Senior Analyst.
(I do not have a discord and will not contact you first there. Beware of scammers)
READ FULL BIO
Sponsored
Sponsored