The Bitcoin price has shown strength with a bounce at the support line of the descending channel. However, the bounce was unsuccessful in moving above the recent breakdown from a significant support area — causing the price movement to remain bearish.
Recently, we saw a $12 million USDT transfer to Binance. Transfers of this magnitude often precede a significant price increase.
Top-ranked Bitcoin analyst on TradingView Jacob Canfield stated that he believes the Bitcoin price will reach a bottom at $5500, which is the 0.786 Fib level measuring from the December 2018 bottom.
https://twitter.com/JacobCanfield/status/1206796842144616449?s=19
Let’s take a closer look at the Bitcoin price and decide where the likely bottom will be.
Fibonacci Bitcoin Retracement
While the tweet uses the exact high of $13,764 for the Fib retracement tool, we believe that the daily closing prices, which are only slightly lower than the aforementioned high, offer more precise levels. Using $13,000 as the high, we get an upward bounce at both the 0.382 and 0.618 Fib levels, and a slightly inaccurate bounce at the 0.5 level. With the adjusted Fib, the 0.786 level falls at $5300 instead.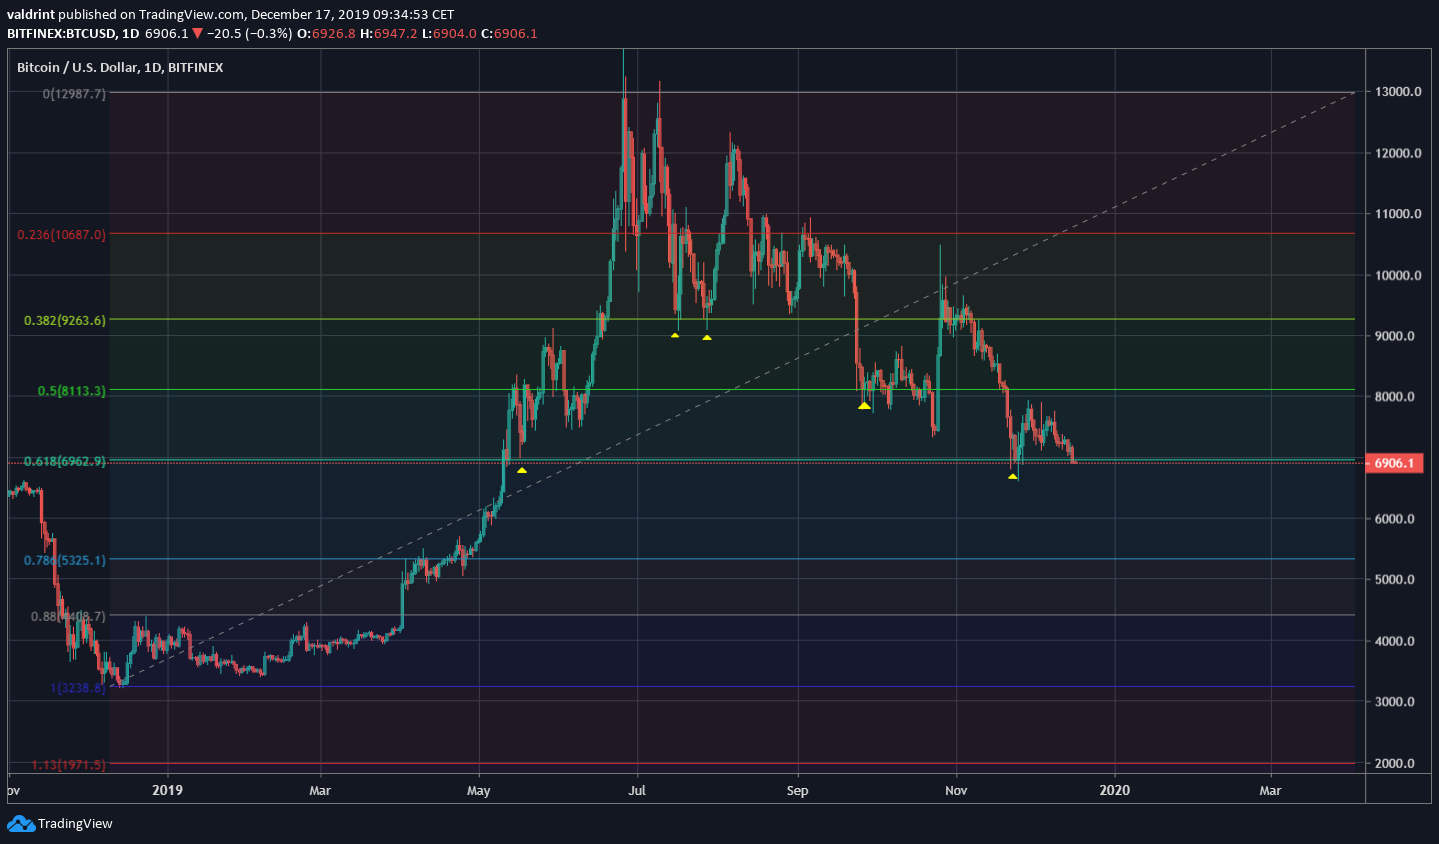
Descending Channel
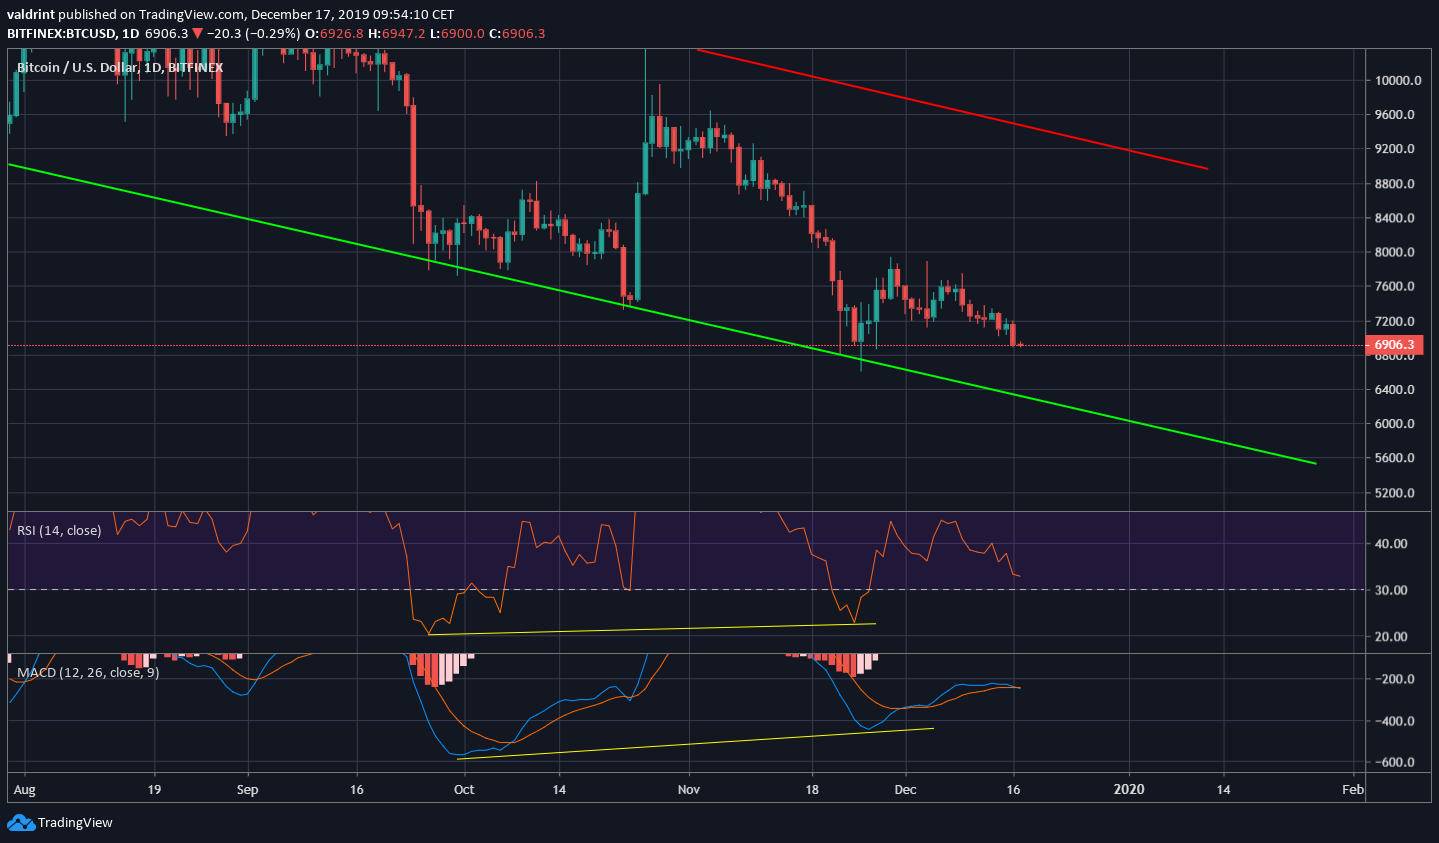
Since the June high, the Bitcoin price has been trading inside a descending channel. On November 22 and 25, it bounced on the support line of this channel and the 0.618 Fib level. The volume profile indicator shows extremely strong support near $6500, making it a very likely place to initiate a reversal.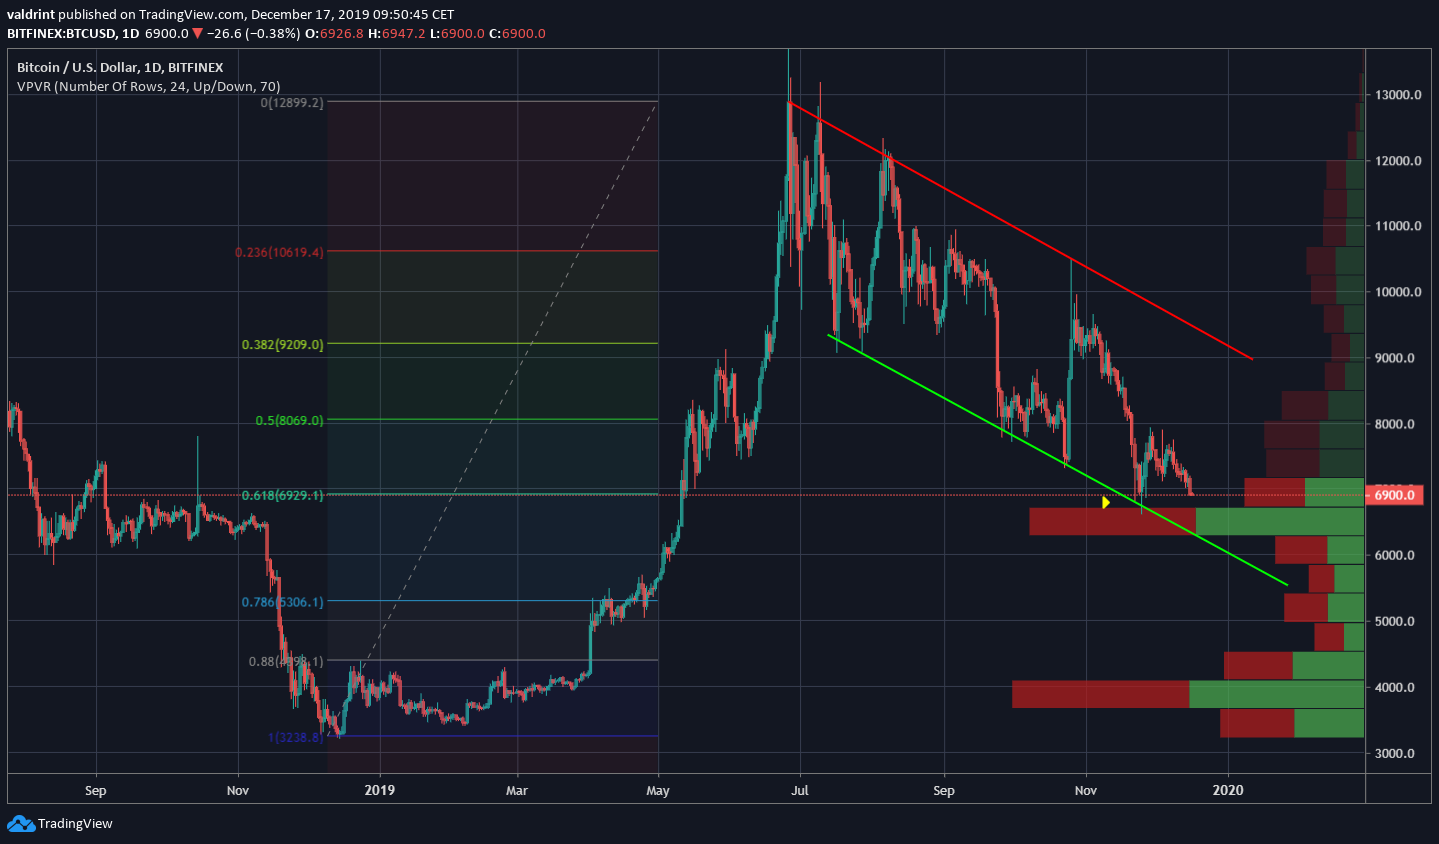 On top of this, there is a very strong bullish divergence visible in the daily time-frame.
The divergence has been ongoing since the beginning of October and is present in both the RSI & MACD. Such a strong divergence often indicates that a reversal will soon begin. This makes it possible that the Bitcoin price has actually reached a bottom at the 0.618 Fib level and will not decrease to the 0.786 level.
Important Level
However, the weekly chart reveals a bearish outlook. The $7500 support area, which had acted as support since June, was broken down at the end of November. Afterward, the Bitcoin price validated it thrice as resistance, creating long upper wicks each time. While a bullish cross between the 50- and 100-week moving averages (MA) has transpired, the Bitcoin price has fallen below both MAs, facing close resistance from the latter. As long as the Bitcoin price stays below this area, we can considered its movement bearish. Reclaim of the support area would likely indicate that the bottom is already in.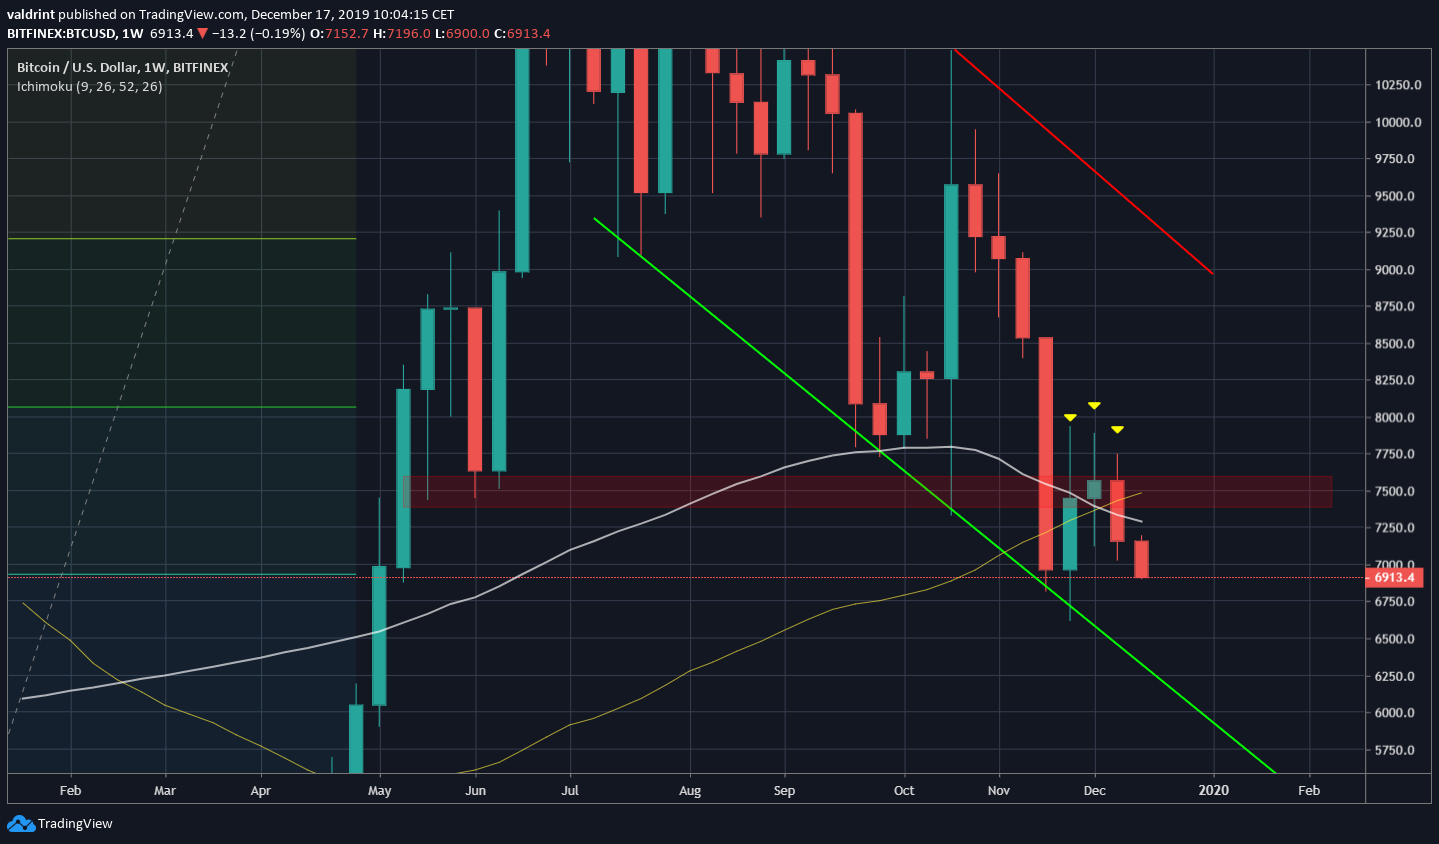 While the Bitcoin price has shown signs of a reversal inside a strong support area, we should consider its movement bearish as long as it stays below the $7500 resistance area.
Disclaimer
In line with the Trust Project guidelines, this price analysis article is for informational purposes only and should not be considered financial or investment advice. BeInCrypto is committed to accurate, unbiased reporting, but market conditions are subject to change without notice. Always conduct your own research and consult with a professional before making any financial decisions. Please note that our Terms and Conditions, Privacy Policy, and Disclaimers have been updated.

Valdrin Tahiri
Valdrin discovered cryptocurrencies while he was getting his MSc in Financial Markets from the Barcelona School of Economics. Shortly after graduating, he began writing for several different cryptocurrency related websites as a freelancer before eventually taking on the role of BeInCrypto's Senior Analyst.
(I do not have a discord and will not contact you first there. Beware of scammers)
READ FULL BIO
Sponsored
Sponsored
