


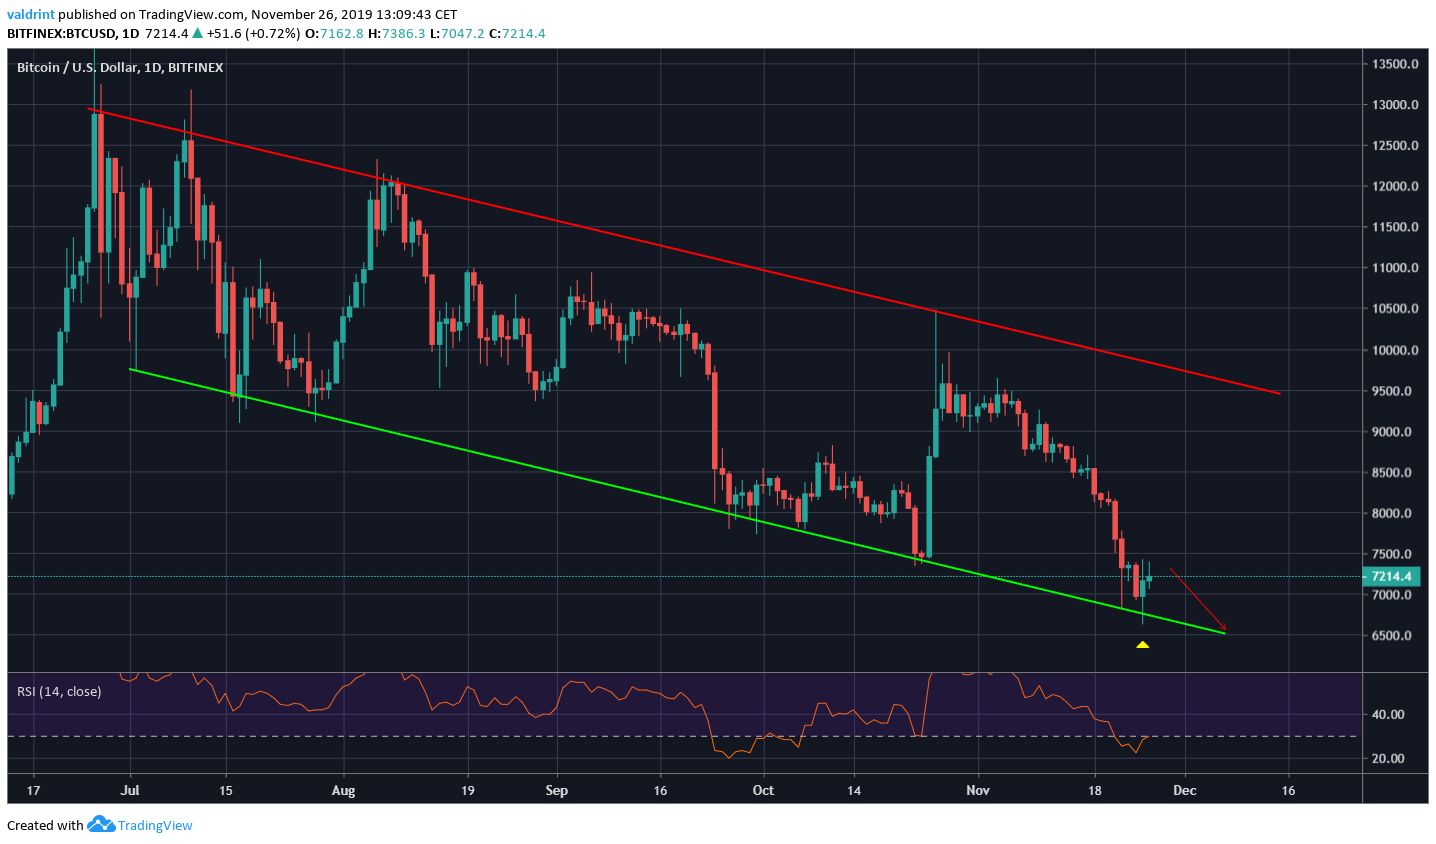
The Bitcoin price has decreased considerably over the previous week. However, it bounced strongly on November 25, leading some people to believe that it has already reached a bottom.
The current trading pattern which is supported by several long-term moving averages suggests that Bitcoin is very close to reaching a bottom if it has not already done so. Therefore, last week’s decrease could have been the final capitulation before a bull market begins.
There have been many theories about this rapid and unexpected decrease. One commentator suggested that it was initiated by whales that are selling in order to claim losses on their 2019 tax return. However, this seems unsubstantiated since Bitcoin is still in profit if you bought in the first half of 2019, so this could be an attempt at falsely rationalizing the price decrease.
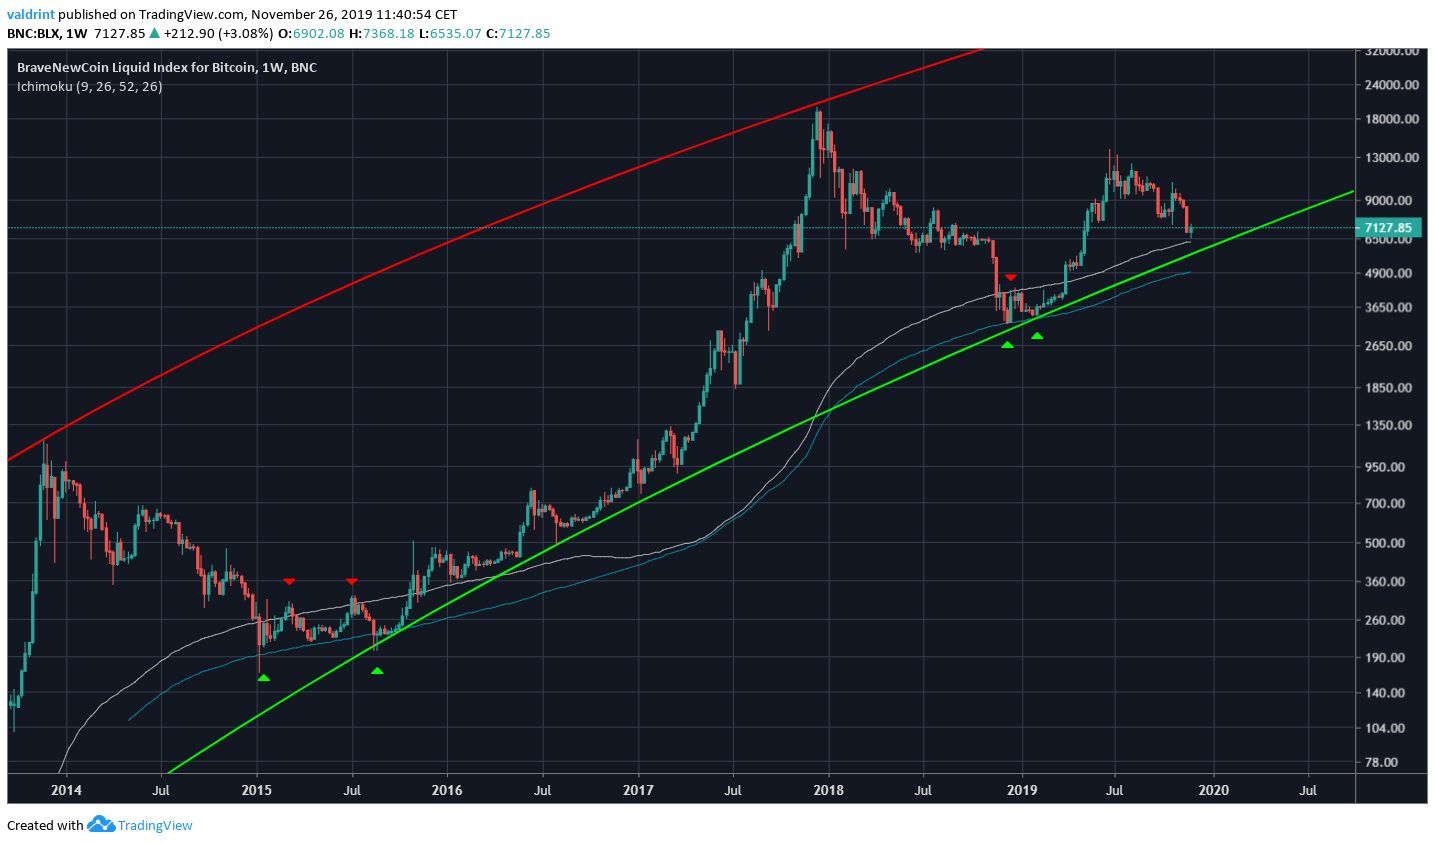
Bitcoin investor and analyst @davthewave stated that in the most bearish scenario Bitcoin will drop all the way to the 200-week moving average (MA). However, he believes a smaller decrease to the 150-week MA is more likely.
Can price go as low as the 200 MWA [approx 4 year MA and 5K range]. I doubt it given the longer passage of time, and the higher prices clocked. More likely is a revisit to the 150 WMA [approx. 3 year MA] as per last time. pic.twitter.com/BYVOx1xJLb
— dave the wave🌊🌓 (@davthewave) November 25, 2019
The 200-week MA is currently at $5000, while the 150-week one is at $6500.
Where will Bitcoin make a bottom? Continue reading below in order to find out.
Bitcoin Long-Term Support
Historically, the Bitcoin price has never traded below its 200-week MA. It has offered support in February and August 2015 and December 2018.
On the other hand, the 150-MA has not always reacted to the price. When it has, it has mostly acted as resistance during the same dates that the 200-week MA has acted as support.
If the trend continues, we would have a drop to the low $5000s and the $6500 area will act as resistance afterward.
Descending Channel
However, the medium-term pattern gives a different outcome. The price has been trading inside a descending channel since June 24. It recently bounced on the support line of this channel.
While it is possible that the price makes a lower low inside this pattern, causing the price to reach $6500, a breakdown seems unlikely.
Additionally, the RSI is at its lowest levels since the December 2018 bottom and has created bullish divergence.
To conclude, we also believe that the price is more likely to bounce at the 150-week MA. There is a scenario in which it drops to the low $5000s, but that currently seems unlikely.
Disclaimer: This article is not trading advice and should not be construed as such. Always consult a trained financial professional before investing in cryptocurrencies, as the market is particularly volatile.
Did you know you can trade sign-up to trade Bitcoin and many leading altcoins with a multiplier of up to 100x on a safe and secure exchange with the lowest fees — with only an email address? Well, now you do! Click here to get started on StormGain!


