
The Bitcoin (BTC) price has likely completed a long-term upward move with its all-time high of $42,000, reached on Jan. 8, 2021.
While Bitcoin is likely not yet done correcting, a significant bounce is expected before another drop.
For the previous long-term count article, click here.
Bitcoin Long-Term Count
Bitcoin has been increasing without a significant retracement since reaching a low of $3,850 in March 2020. On Jan. 8, 2021, BTC reached an all-time high price of $42,000, an increase of slightly more than 1,000% measuring from the low.
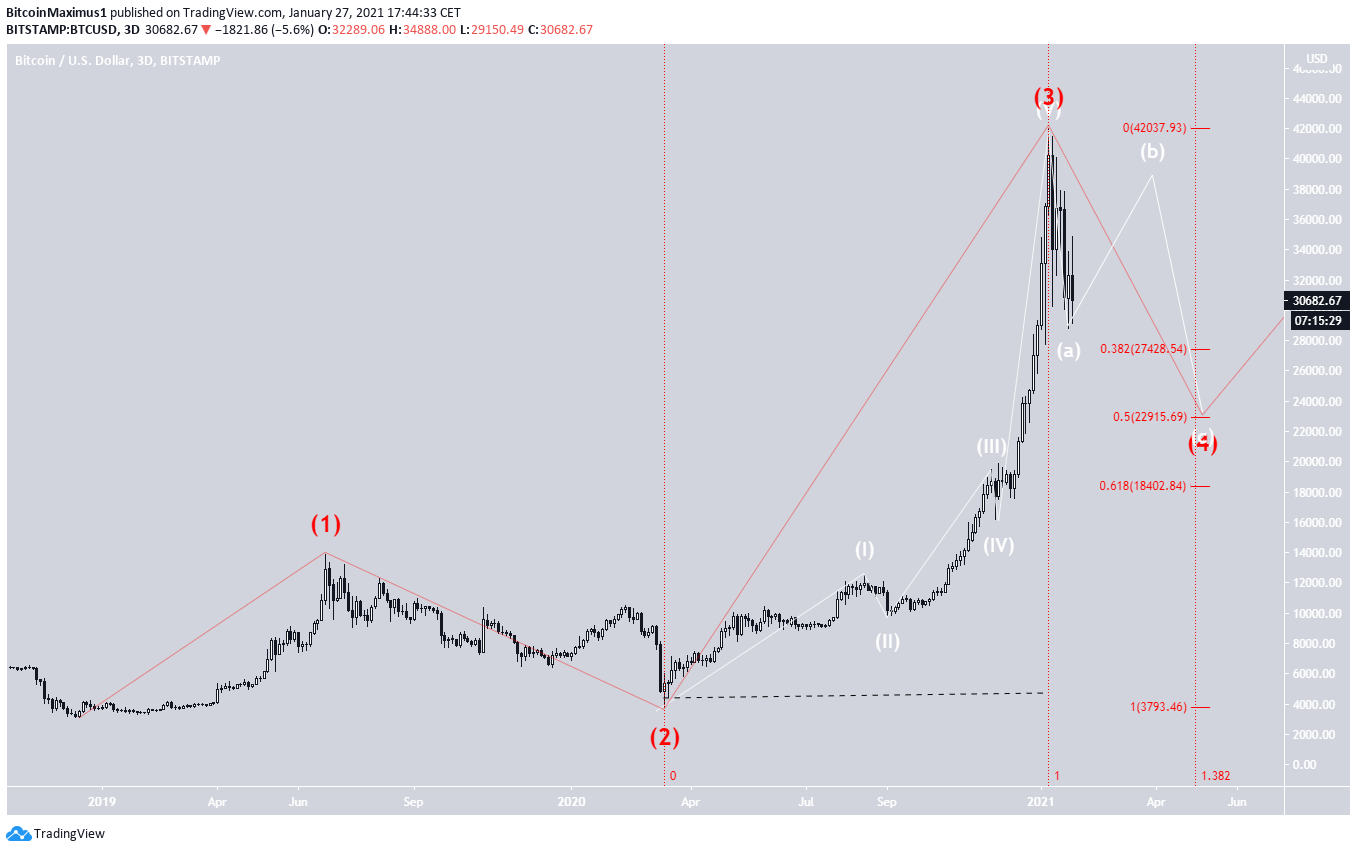
The most likely scenario is that this entire move was the cycle wave three (shown in red below) of a bullish impulse that began with the December 2018 low. If so, BTC is currently in cycle wave four, which is commonly corrective.
The three most likely targets for the top of this upward move are found at:
- $27,428 – 0.382 Fib retracement
- $22,915 – 0.5 Fib retracement
- $18,402 – 0.618 Fib retracement
Due to the length of time it took for cycle wave three to complete, the correction could take until the beginning of May. This would give a correction roughly a third of the time it took for the upward movement to complete. However, a more accurate target is likely to be uncovered once BTC gets closer to reaching its low.
Nevertheless, what the ratio between these lengths tells us is that it’s likely that BTC has only completed the first portion of its correction.
The wave count is shown in white and will be looked at in more detail in the next section.
Short-Term Count
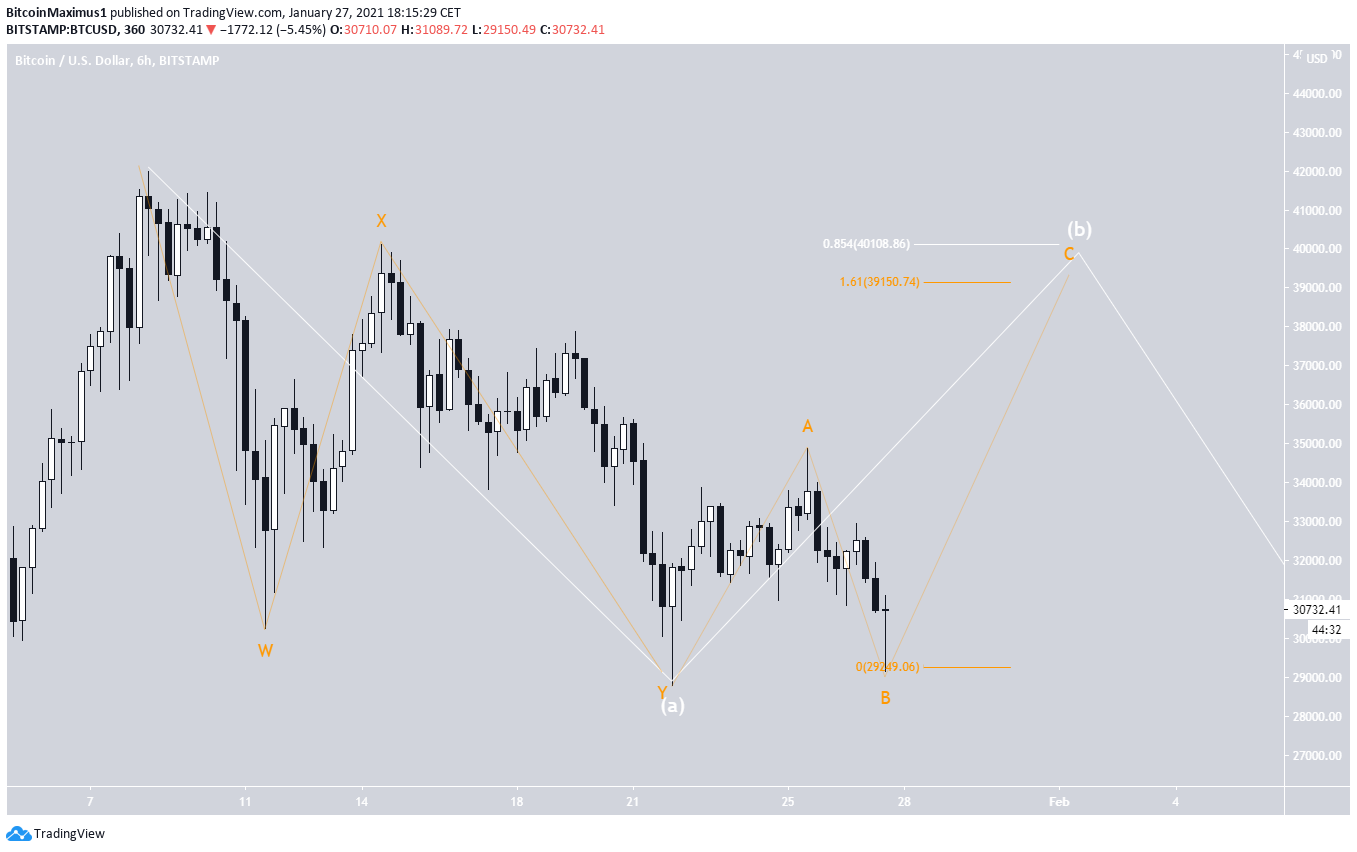
A closer look shows that BTC has completed wave A in a complex, W-X-Y sub-wave structure (shown in orange).
Since A was a three-move down, this is likely a flat correction. Therefore, the B wave is expected to retrace to the 0.85 Fib level at $40,108.
If sub-waves A:C have a 1:1.61 ratio, which is common in a flat corrective structure, the C wave would go to $39,150. Given this, the most likely target for the top is found between $39,150-$40,108.
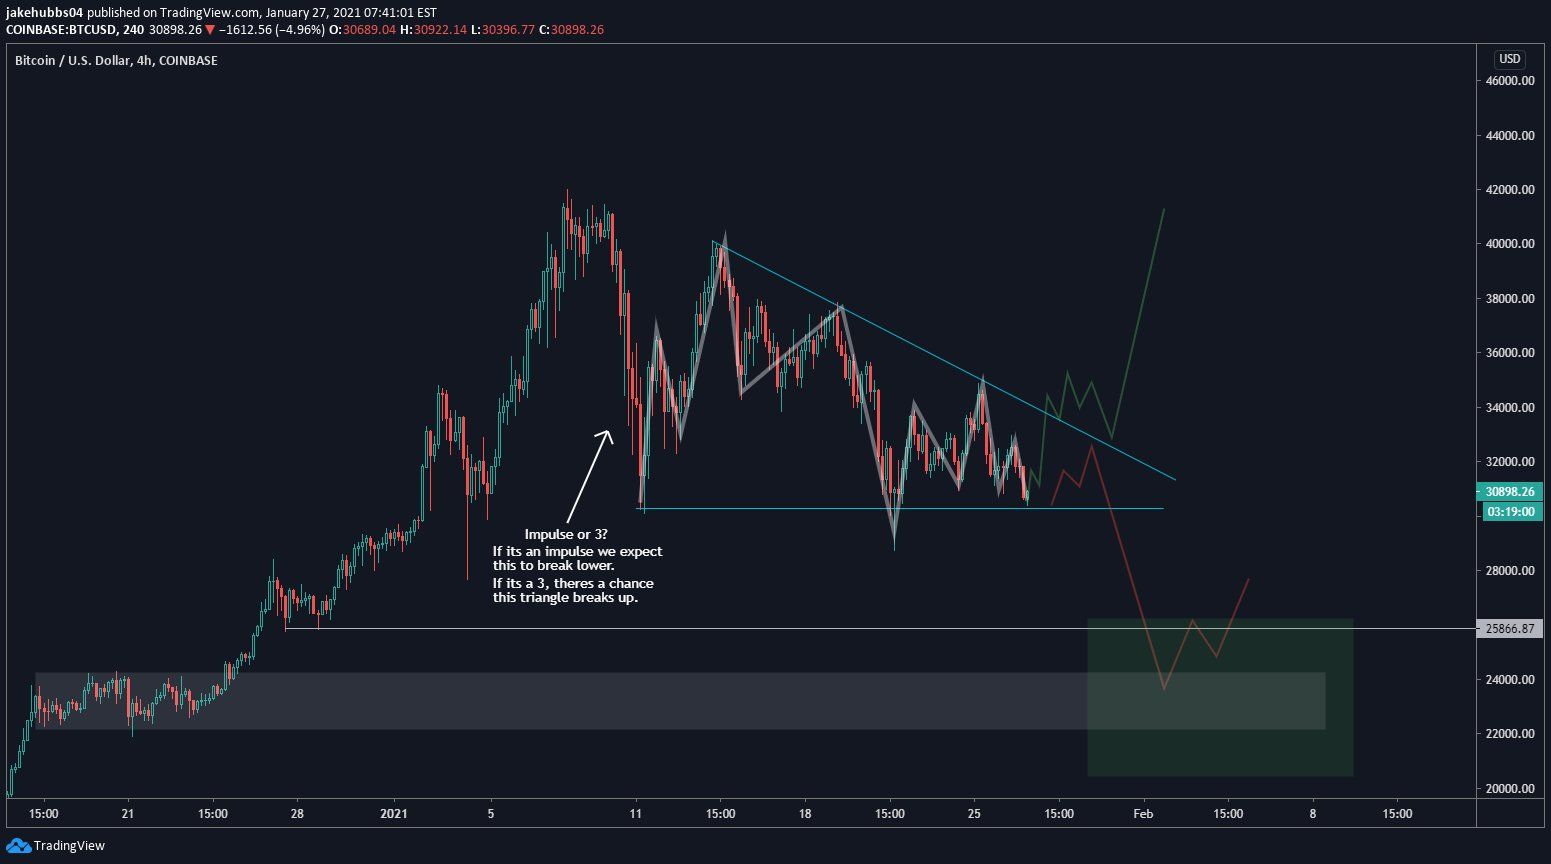
Cryptocurrency trader @Thetradinghubb outlined a descending triangle for BTC, which shows two potential paths outlined.
If the count transpires as presented above, BTC is likely to break out from the triangle and continue higher.
Conclusion
It’s likely that Bitcoin is still correcting and will eventually settle to a low around $27,428. A significant bounce toward the range of $39,150-$40,108 is expected prior to one final decrease.
For BeInCrypto’s latest Bitcoin (BTC) analysis, click here!
