
Bitcoin (BTC) has increased more than 4% in the last 24 hours and over 5% in the past seven days as it attempts to recover the $90,000 level. The recent price rebound comes amid improving technical indicators that suggest growing bullish momentum.
Traders are closely watching whether Bitcoin can reclaim $90,000 and build a stronger foundation for further upside. Several trend indicators, including the DMI, Ichimoku Cloud, and EMA lines, are signaling that a potential breakout could be forming.
BTC DMI Shows Buyers Are Now In Full Control
Bitcoin’s DMI chart is showing a significant uptick in momentum. The ADX (Average Directional Index) has climbed to 18.24 today, a notable increase from 9.2 just yesterday, signaling that the strength of the current trend is building.
An ADX reading below 20 typically suggests that the market is trending weakly or is range-bound, so this rise could be an early sign of a developing trend.
While the ADX itself does not indicate the direction of the trend, it measures the overall strength, and today’s reading suggests momentum is beginning to pick up.
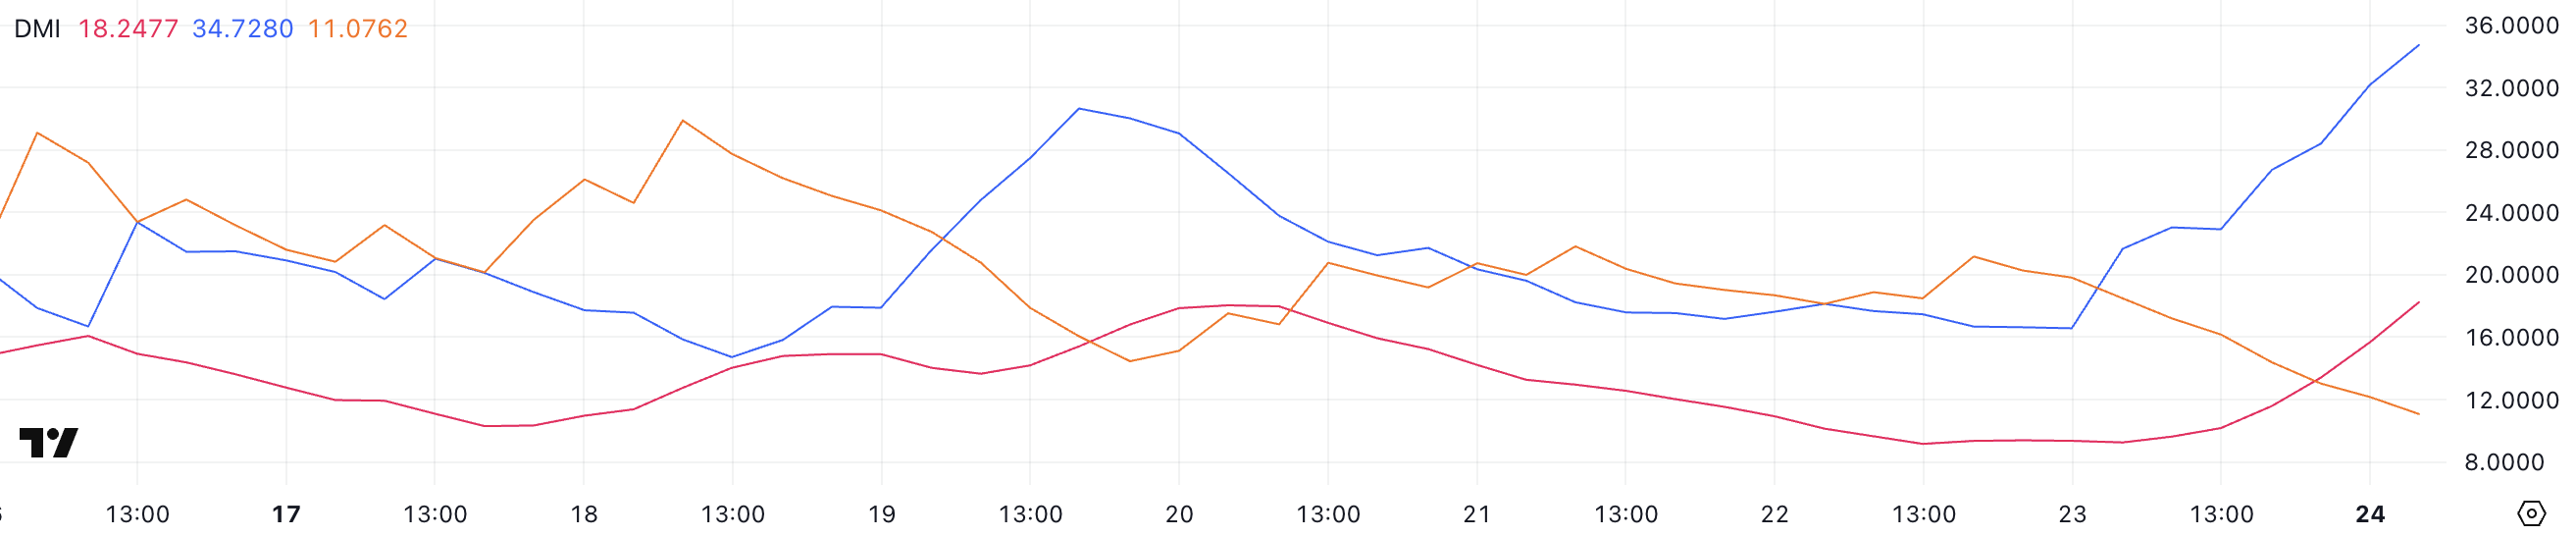
The ADX is a widely used technical indicator that helps traders gauge the strength of a market trend. Generally, an ADX value below 20 signals a lack of a clear trend, while readings above 25 suggest a strong trend is present.
Alongside the ADX, the +DI (Positive Directional Indicator) and -DI (Negative Directional Indicator) provide insight into trend direction. Currently, the +DI has surged to 34.7 from 16.57 yesterday, while the -DI has declined to 11 from 21.17.
This widening gap between +DI and -DI indicates that bullish momentum is gaining dominance, as buyers appear to be overwhelming sellers. If this trend continues, it could point to a further rise in BTC’s price in the near term, as the market shifts towards a more decisive bullish trend and Bitcoin ETFs show signs of recovery.
Bitcoin Ichimoku Cloud Shows A Bullish Setup Is Forming
The Ichimoku Cloud chart for Bitcoin shows the Tenkan-sen (blue line) and Kijun-sen (red line) crossing in a bullish pattern. The faster Tenkan-sen moves above the slower Kijun-sen, signaling a momentum shift.
These lines have converged after a period of separation, indicating strengthening trend conditions.
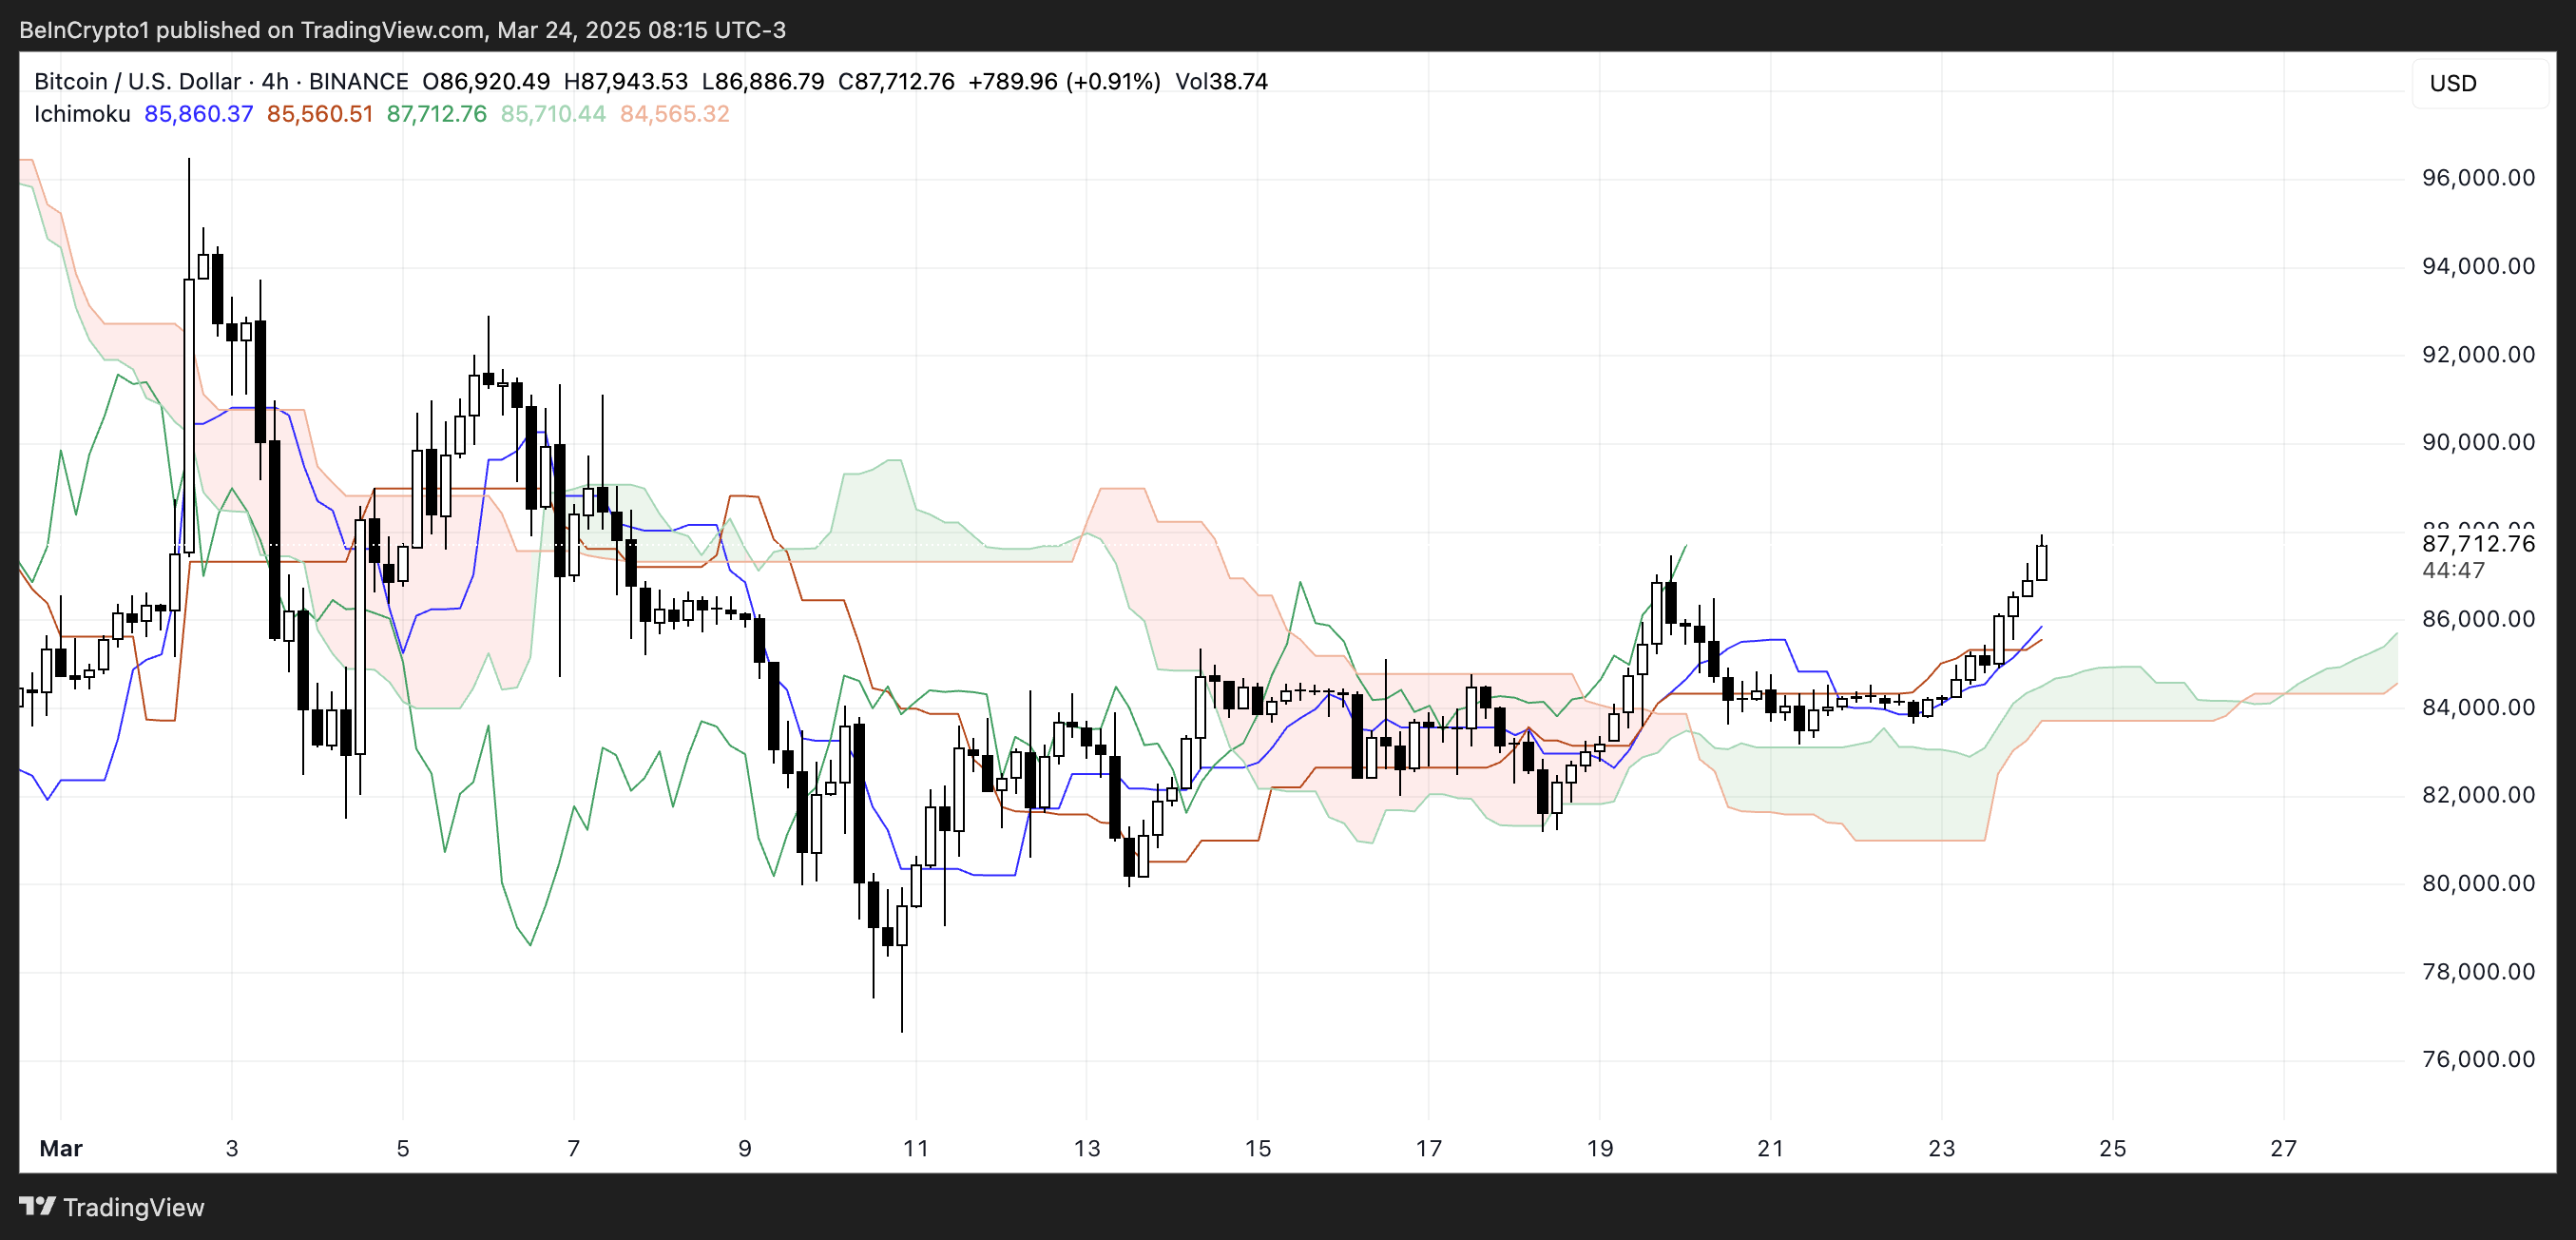
The cloud formation (Kumo) has changed from red to green in the right portion of the chart, marking a shift from bearish to bullish sentiment. Price action has broken above the cloud after testing it as support multiple times throughout mid-March.
This emergence above the cloud signals that previous resistance has potentially become support. The cloud’s varying thickness throughout the period reflects changing market volatility and conviction in the trend direction.
Can Bitcoin Reclaim $100,000 Before April?
Bitcoin’s EMA lines are currently showing mixed signals. While the broader trend remains bearish, short-term exponential moving averages have started to turn upward, and a recent golden cross suggests that bullish momentum is building.
If this momentum continues and additional golden crosses occur, Bitcoin price could target key resistance levels. The first major resistance lies at $92,920, and a successful breakout could see BTC pushing towards $96,484.
If the uptrend strengthens further, Bitcoin may test $99,472. It has the potential to break above $100,000 for the first time since February 3. This could be driven by 5 US economic events that can influence Bitcoin sentiment this week.
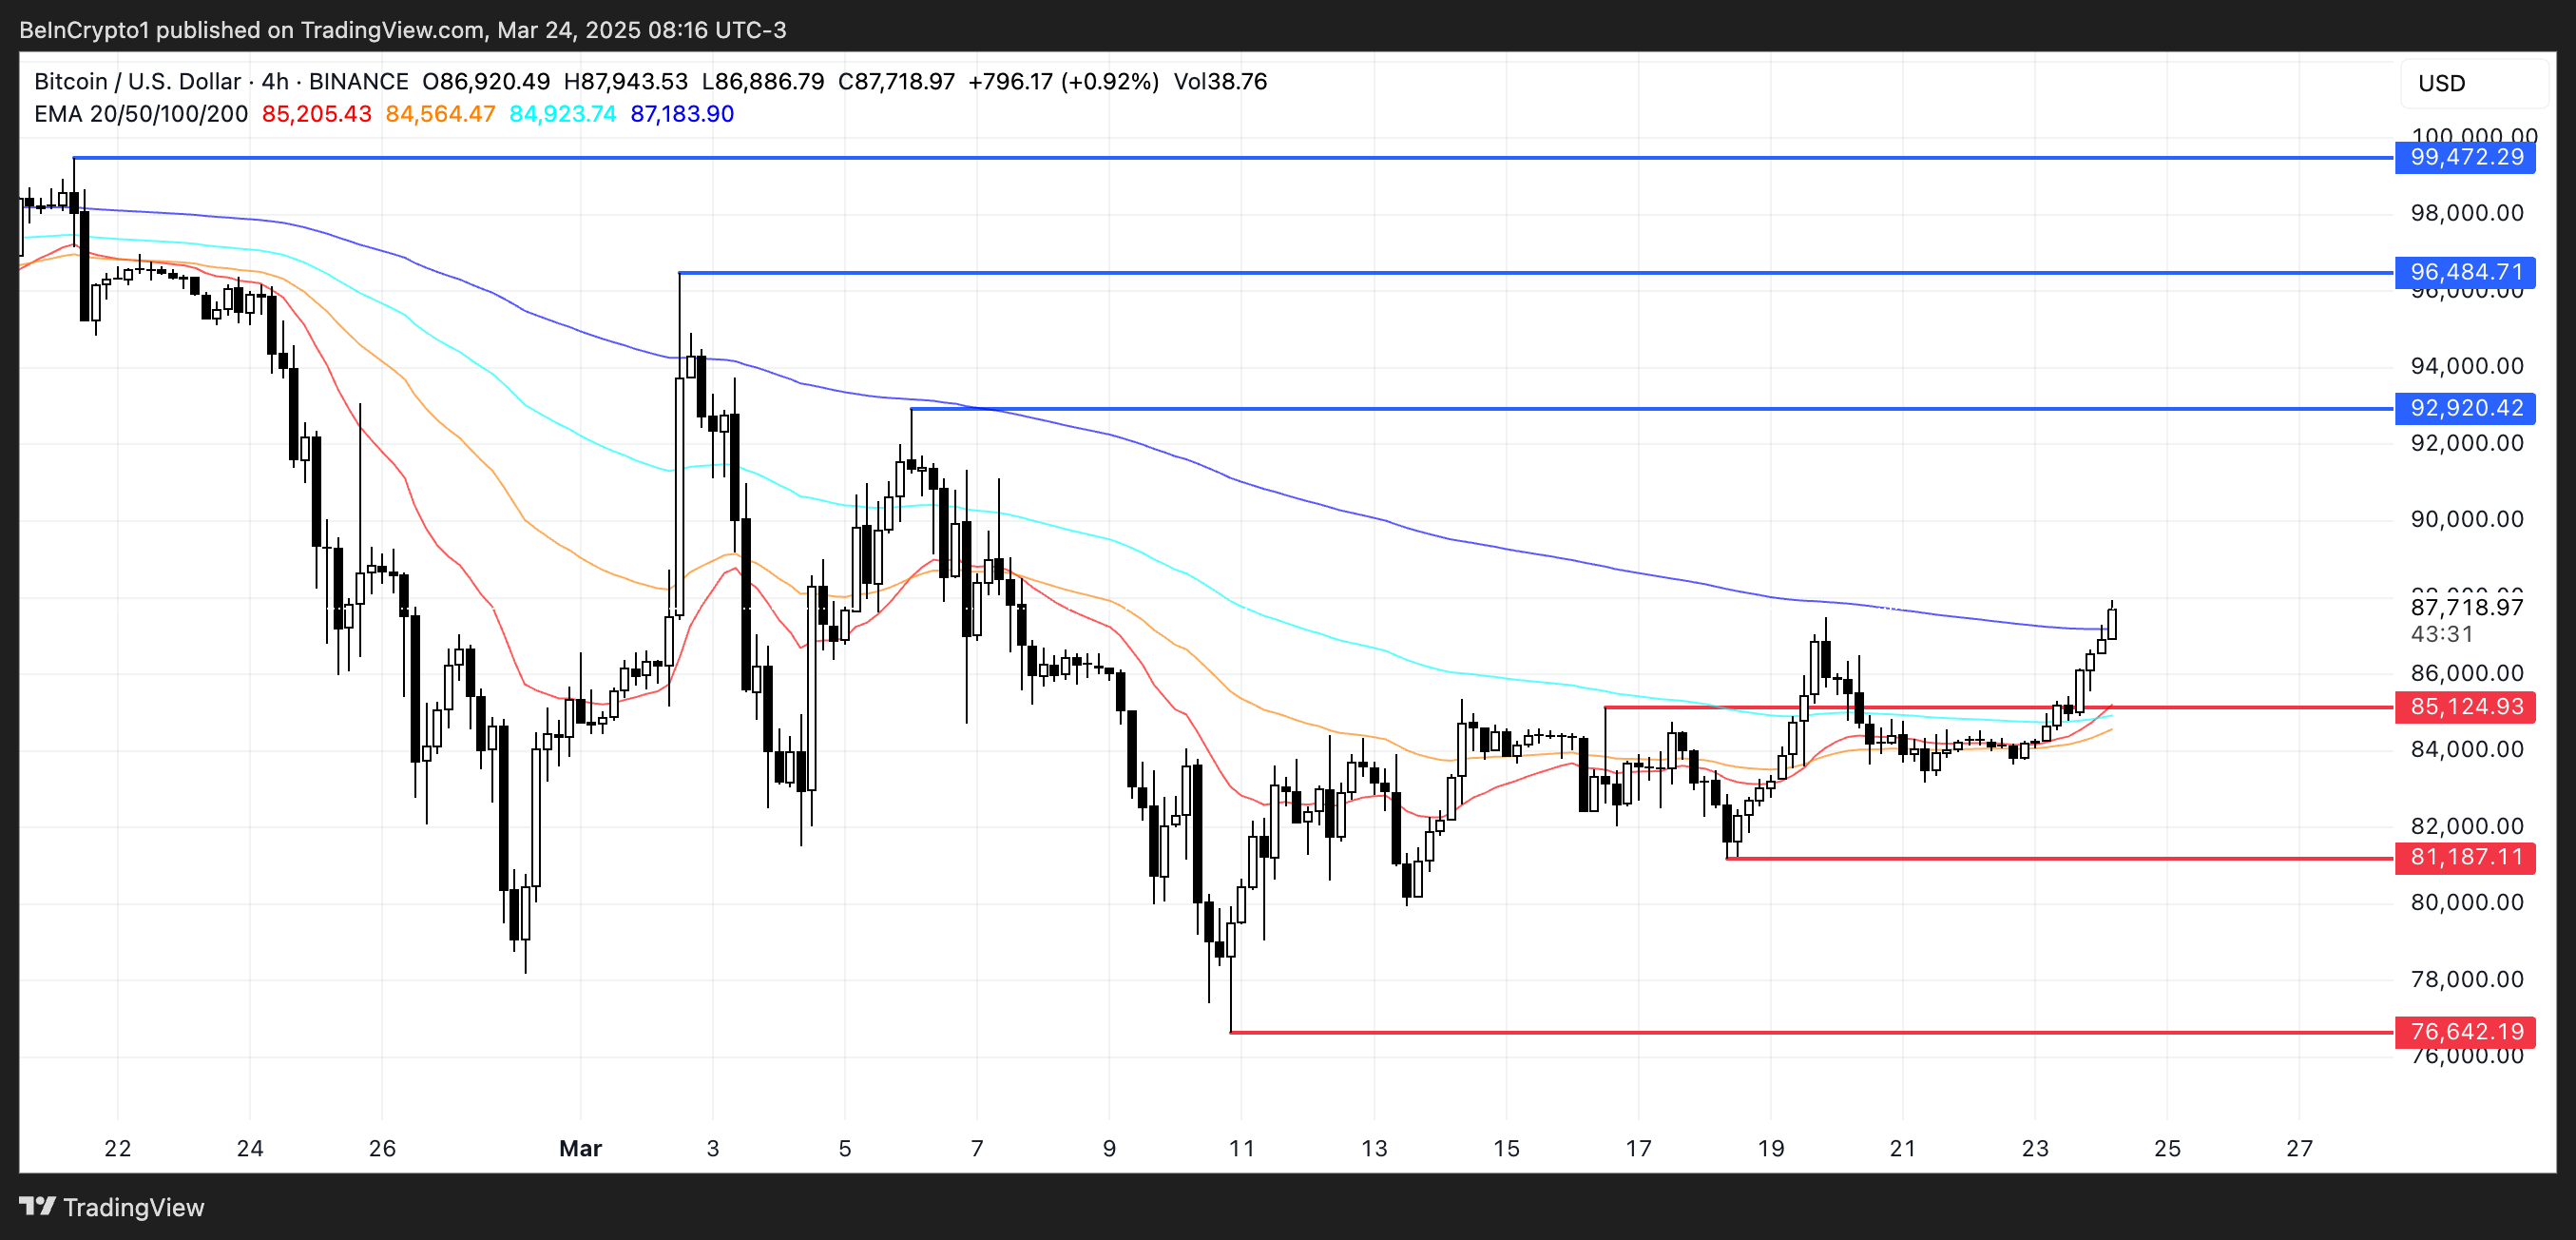
However, the bullish scenario hinges on sustained buying pressure. If the upward momentum fades and the broader bearish trend resumes, Bitcoin could first retest the support level at $85,124.
A break below this level might open the door for a decline towards $81,187, with further downside potentially leading BTC back below the $80,000 mark.
In a stronger bearish scenario, Bitcoin could revisit $76,642, reinforcing the bearish bias.
