
Trading patterns are created when the price of an asset trades within the confines of a certain range, following both a support and resistance line. They are very useful in determining the direction of decisive moves after the price moves out of its previous trading range.
For the past 13 days, Bitcoin has been trading inside a descending triangle. The descending triangle is considered a bearish pattern, making a price breakdown more likely.
Popular crypto analyst @CryptoWelson noted this descending triangle, along with the fact that he is opening long positions in this area.
https://twitter.com/CryptoWelson/status/1181086183738265600?ref_src=twsrc%5Etfw
While it may seem counter-intuitive to open a long inside a bearish pattern, it is worth noting that the price is at the support line of the triangle.
This means that even if a breakdown occurs, a movement from support to resistance could transpire before it does. This, however, would mean that this is a move against the underlying trend, which is considered to be bearish since a breakdown is expected.
Bullish Divergence
Looking closer at the price movement, we can see that BTC has been trading inside this descending triangle since September 25.
The price is right at the support line. Additionally, the RSI and the MACD have both generated bullish divergence.
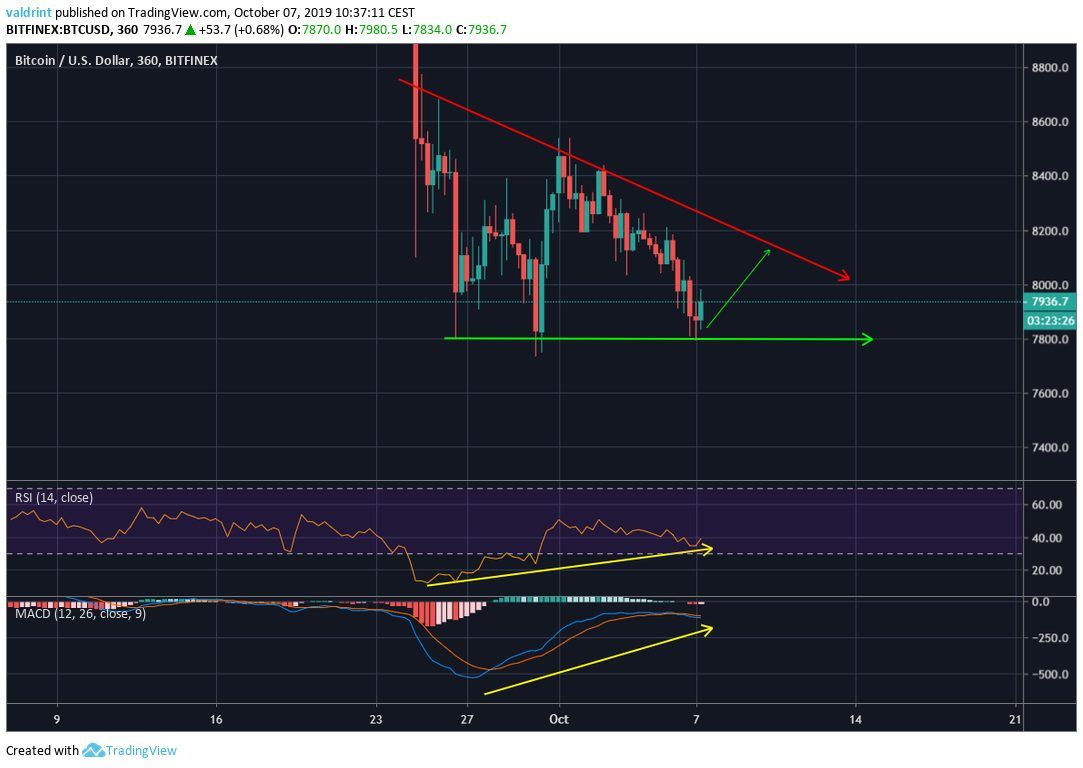
This often means that an upward move will soon follow.
However, it is yet unclear if this is a move towards the resistance line or a breakout from the triangle.
Wave Four
As BeInCrypto has stated in our Bitcoin price prediction, we believe the price is in the final wave of its correction.
The movement inside the triangle is likely part of wave four, with the final, fifth wave to follow shortly after.
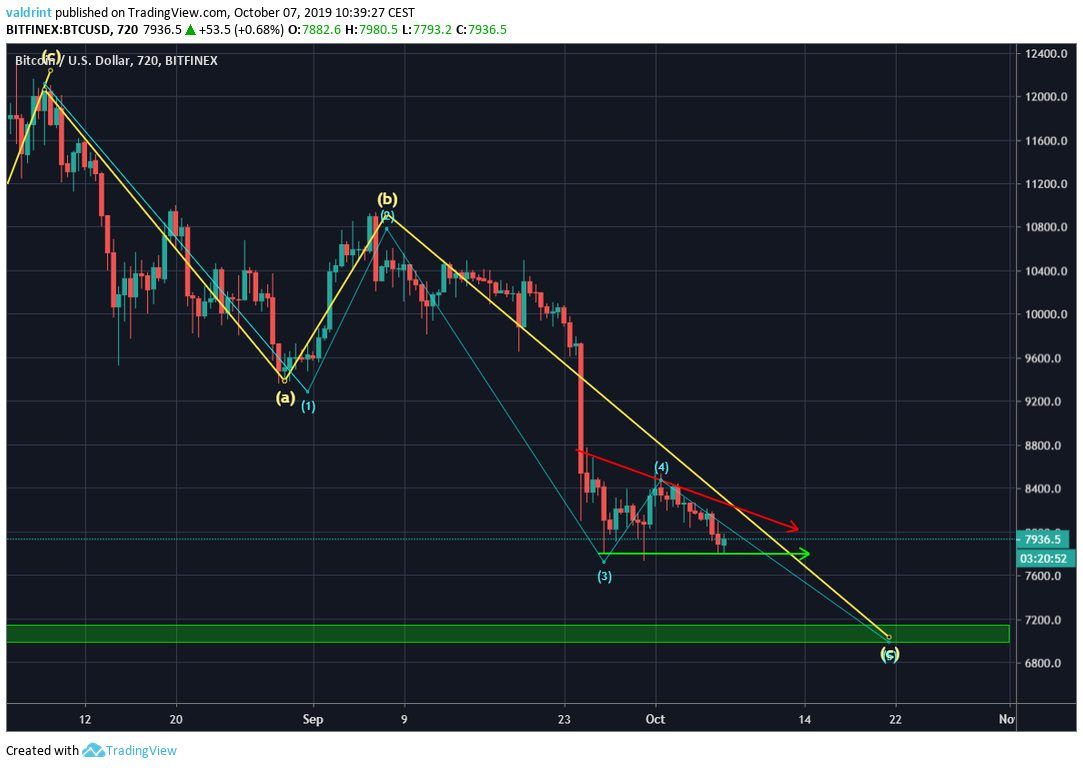
Therefore, BTC should eventually reach the low $7000s, indicating that this is an upward move towards the resistance line only and not the beginning of a breakout.
Too Long or Not to Long?
Now that we have decided that the market will go lower, let’s look at the possibility of initiating a long.
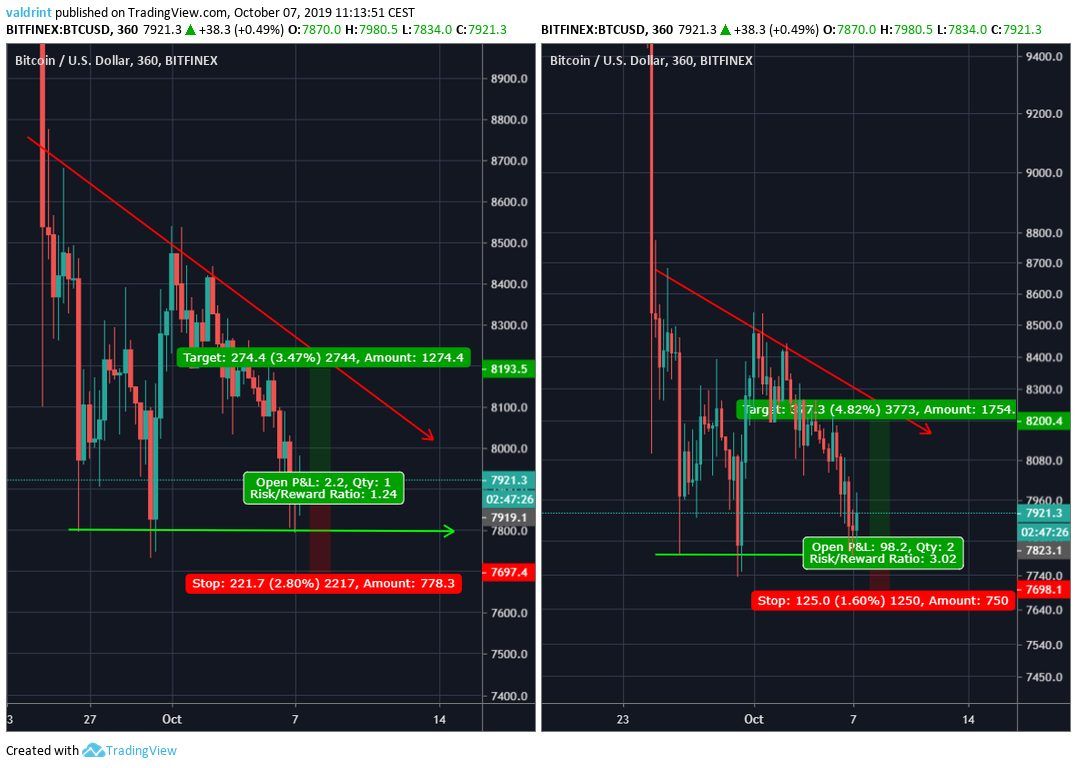
First, the target should likely be set around $8200, the level of the descending resistance line.
Also, a suitable level for the placement of the stop loss is slightly below $7700, in order to reduce the risk of getting stopped by a long lower wick.
So, the only changing variable is the entry price.
Doing so at current prices ($7921), gives us a risk:reward ratio of only 1.25.
Waiting for a better entry price ($7821) gives us a better but not exceptional 3:1 ratio.
Therefore, doing this counter-trend trade does not present with a very lucrative R:R ratio, even if we wait for an optimal entry point.
Do you think BTC will break down? Would you initiate a long at the current level? Let us know in the comments below.
Disclaimer: This article is not trading advice and should not be construed as such. Always consult a trained financial professional before investing in cryptocurrencies, as the market is particularly volatile.
Images are courtesy of Shutterstock, TradingView.
