


The Bitcoin price is in the process of breaking out from a descending wedge This movement could take the price all the way to the closest resistance area to create a triple-top.
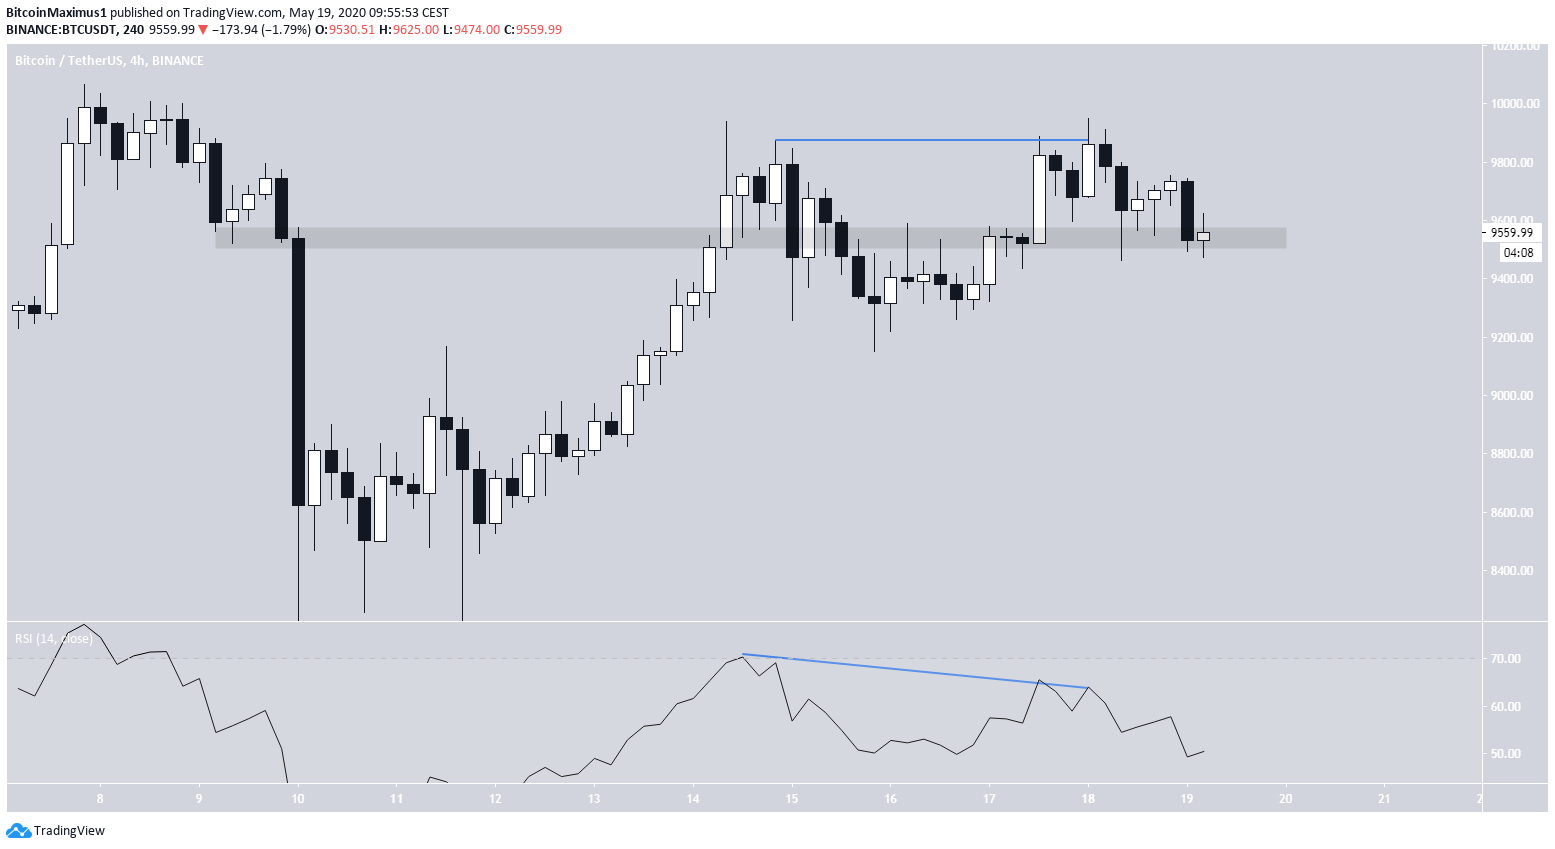
The Bitcoin price is currently trading inside a minor support level, found at $9,550. Prior to falling to this level, BTC created a double-top at the $9,900 level, which is known as a bearish reversal pattern.
The double-top was combined with a bearish divergence in the RSI, a sign that the price will likely break down from this pattern and head lower.
If so, it could fall below this minor support level and to the $9,200 area. This coincides with the bottom prior to these two highs.
Possible Bitcoin Breakout
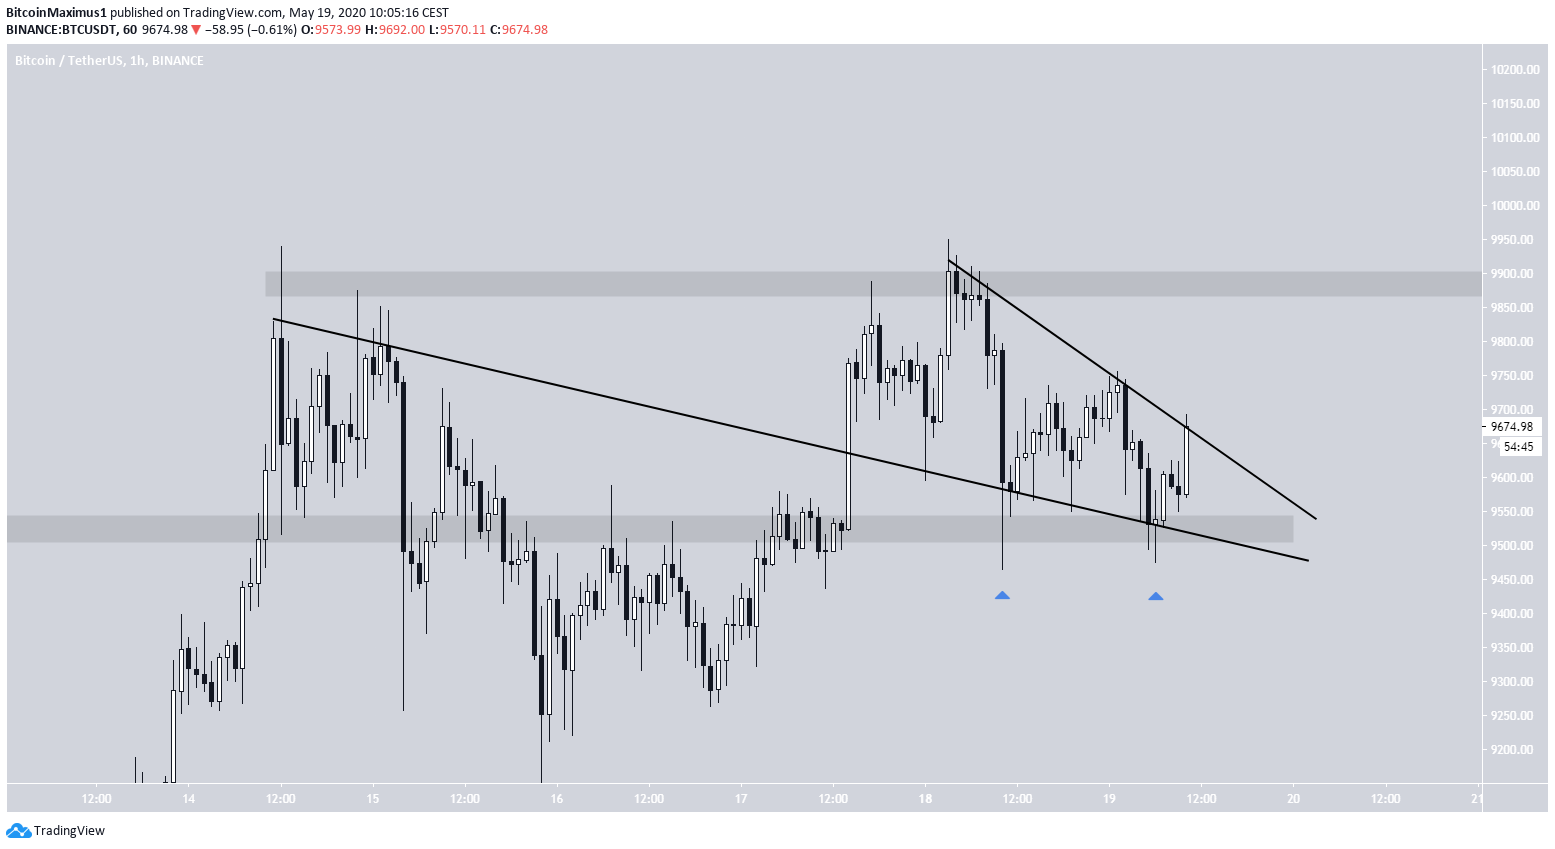
A look at the short-term charts provides a more bullish outlook. BTC has validated the previous resistance line as support. In addition, it is trading inside a descending wedge and is currently in the process of breaking out.
Furthermore, the price has created two long lower-wicks inside this minor support level, a sign that the price wants to move upwards.
Therefore, a breakout from this pattern is likely, one that could take the price all the way to $9,900. Once it gets there, the presence of bearish divergence will likely dictate if BTC will create a triple-top and break down or if it will continue to new highs.
Future Movement
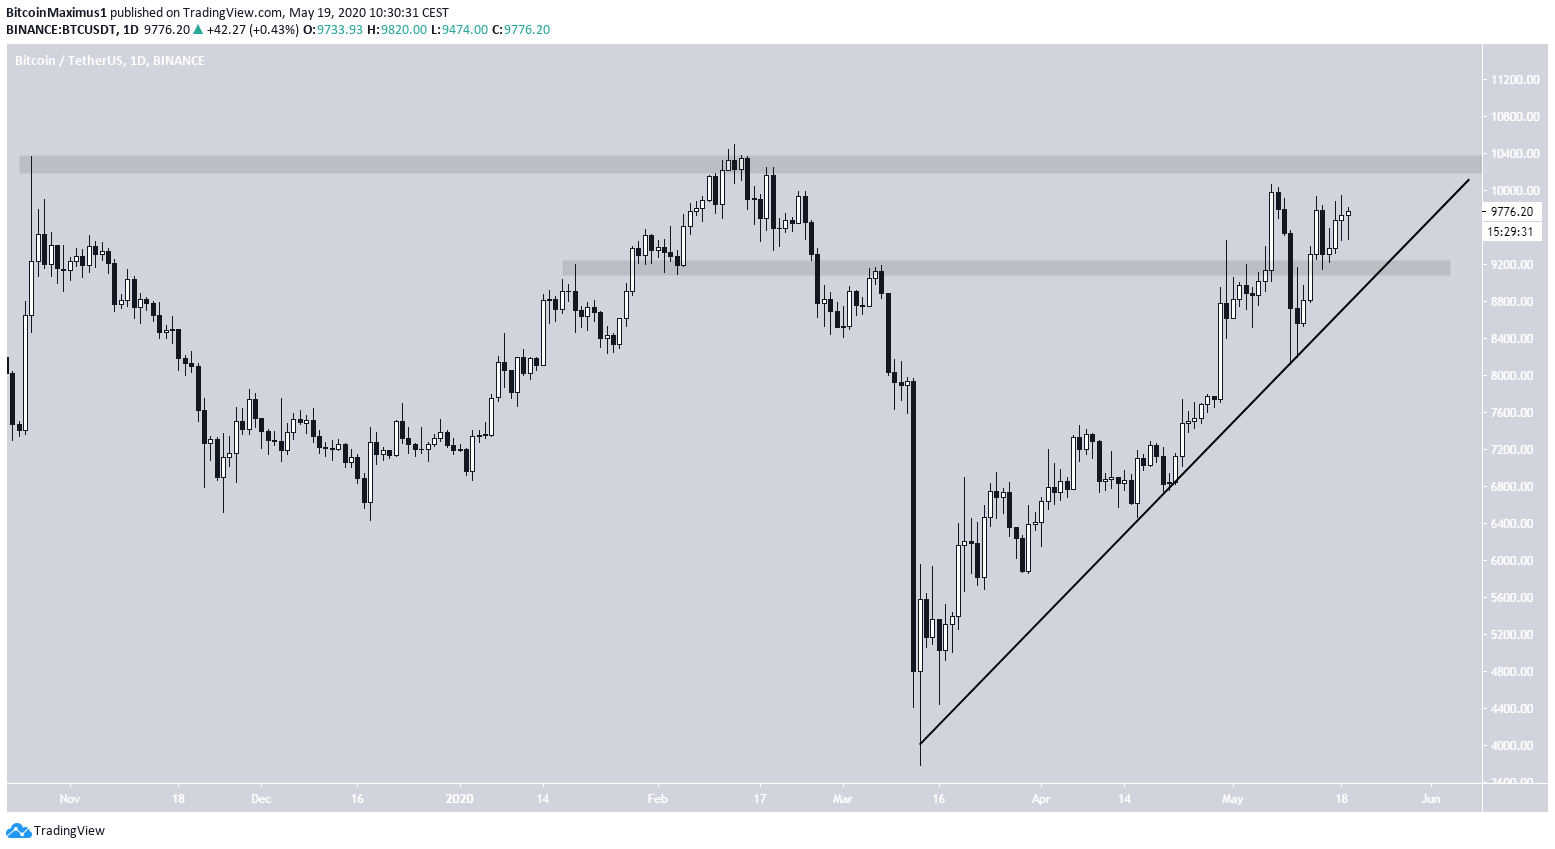
In the long-term, the price is approaching the major resistance area at $10,450, above which it has not traded since September 2019.
If the price does not create a triple-top, but rather breaks out above the $9,900 area, it is likely to continue increasing and reach this major resistance level. At this point, it’s difficult to predict if the price will be able to break out above this level or decrease retreat back to support.
For those interested in BeInCrypto’s previous Bitcoin analysis, click here.


