

On May 14, 2019, the Bitcoin SV price reached a low of ₿0.0073. A rapid upward move ensued shortly after. BSV reached a high of ₿0.03 on June 5. It has been decreasing since.
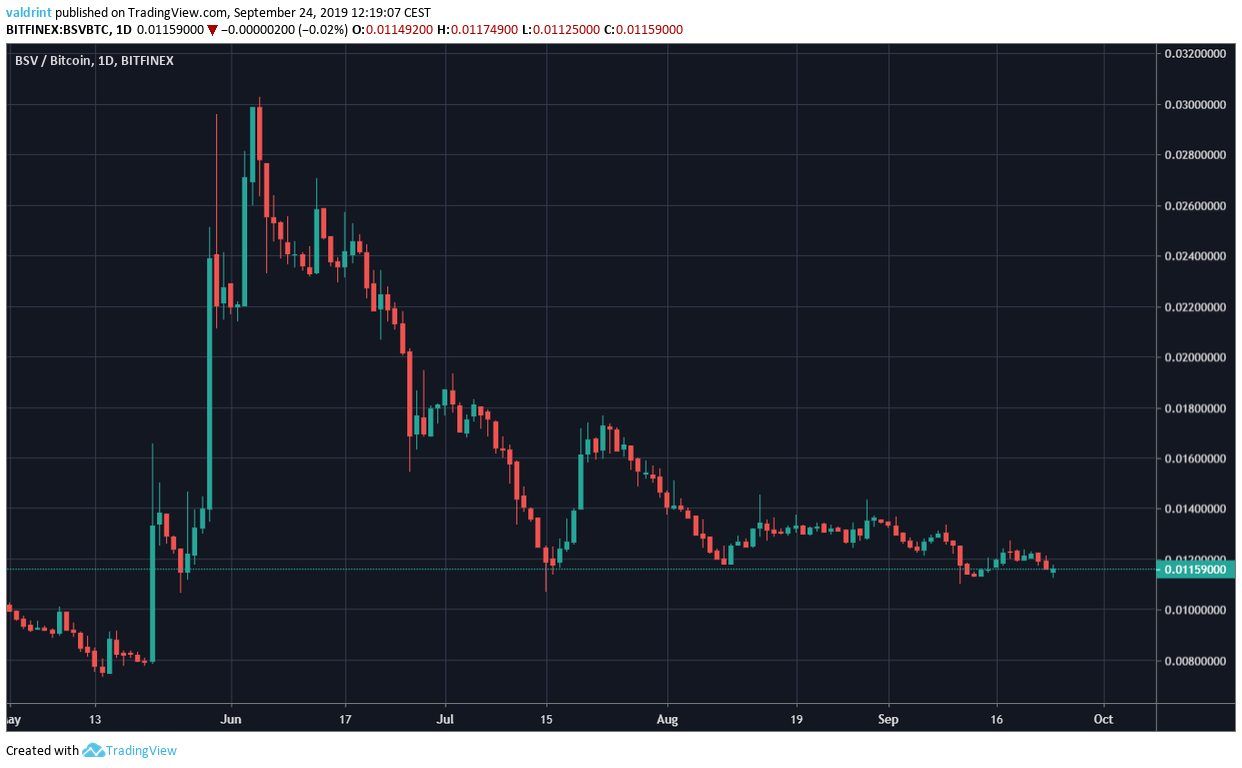 At the time of writing, the Bitcoin SV price was trading at ₿0.011.
Where will the BSV price go to next? Keep reading below if you are interested in finding out.
For our previous analysis, click here.
At the time of writing, the Bitcoin SV price was trading at ₿0.011.
Where will the BSV price go to next? Keep reading below if you are interested in finding out.
For our previous analysis, click here.
Bitcoin SV Price: Trends and Highlights for September 24
- BSV/BTC is trading inside a descending triangle.
- The BSV price is facing resistance from the daily moving averages.
- BSV has created a double bottom combined with bullish divergence.
- There is support at ₿0.008.
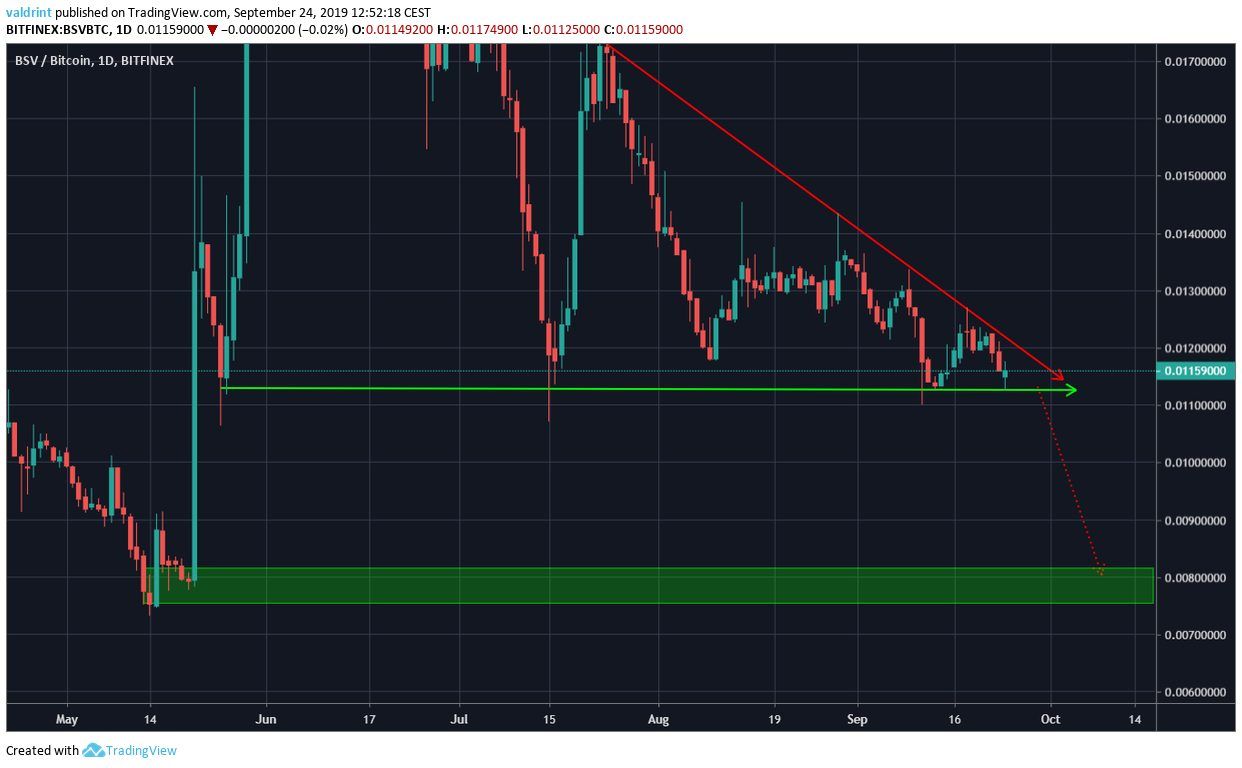
Current BSV Price Pattern
Looking at the daily chart we can see that the BSV price has been trading inside a descending triangle since May 24.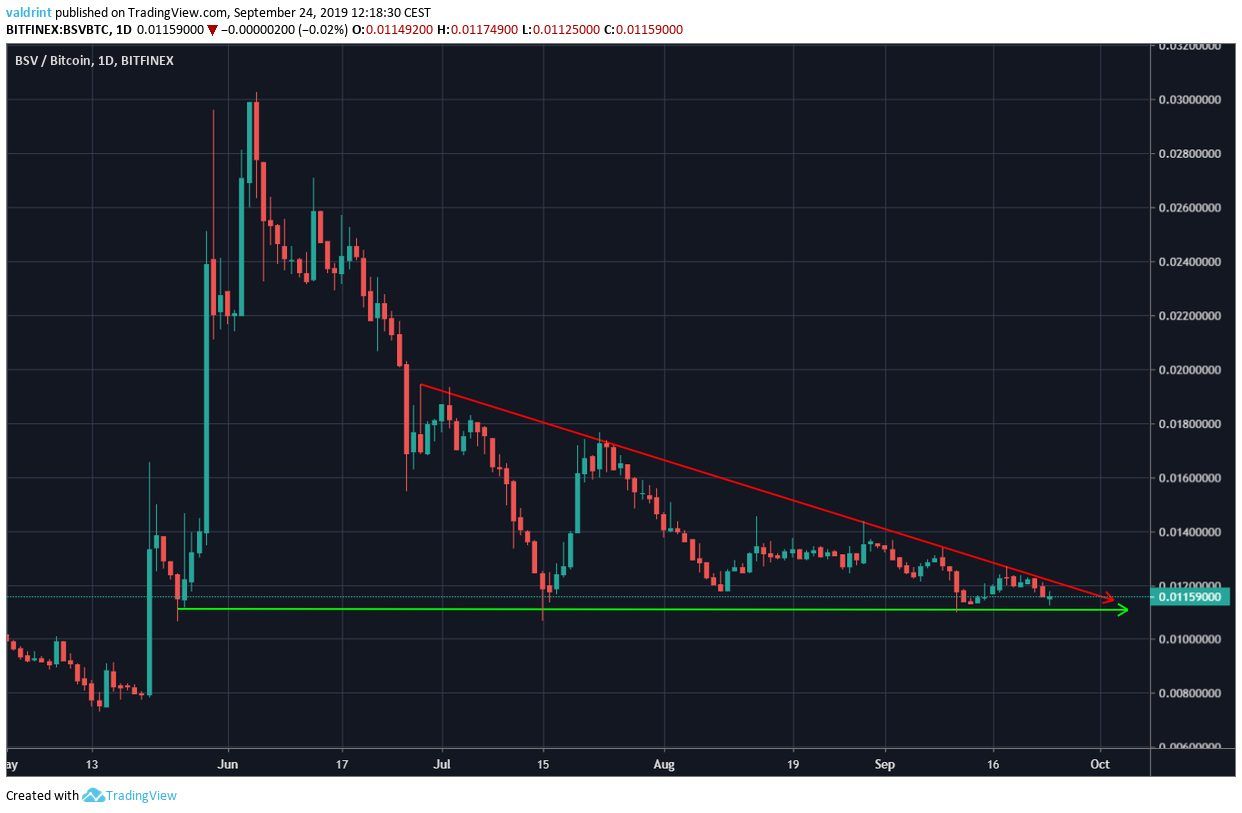 The descending triangle is considered a bearish pattern — making a price breakdown more likely.
Additionally, the BSV price is approaching the end of the triangle, at which time a decisive move should occur.
Will the Bitcoin SV price break down?
The descending triangle is considered a bearish pattern — making a price breakdown more likely.
Additionally, the BSV price is approaching the end of the triangle, at which time a decisive move should occur.
Will the Bitcoin SV price break down?
Technical Indicators
In order to determine the direction of the upcoming move, we have incorporated the daily moving averages (MA) into the analysis.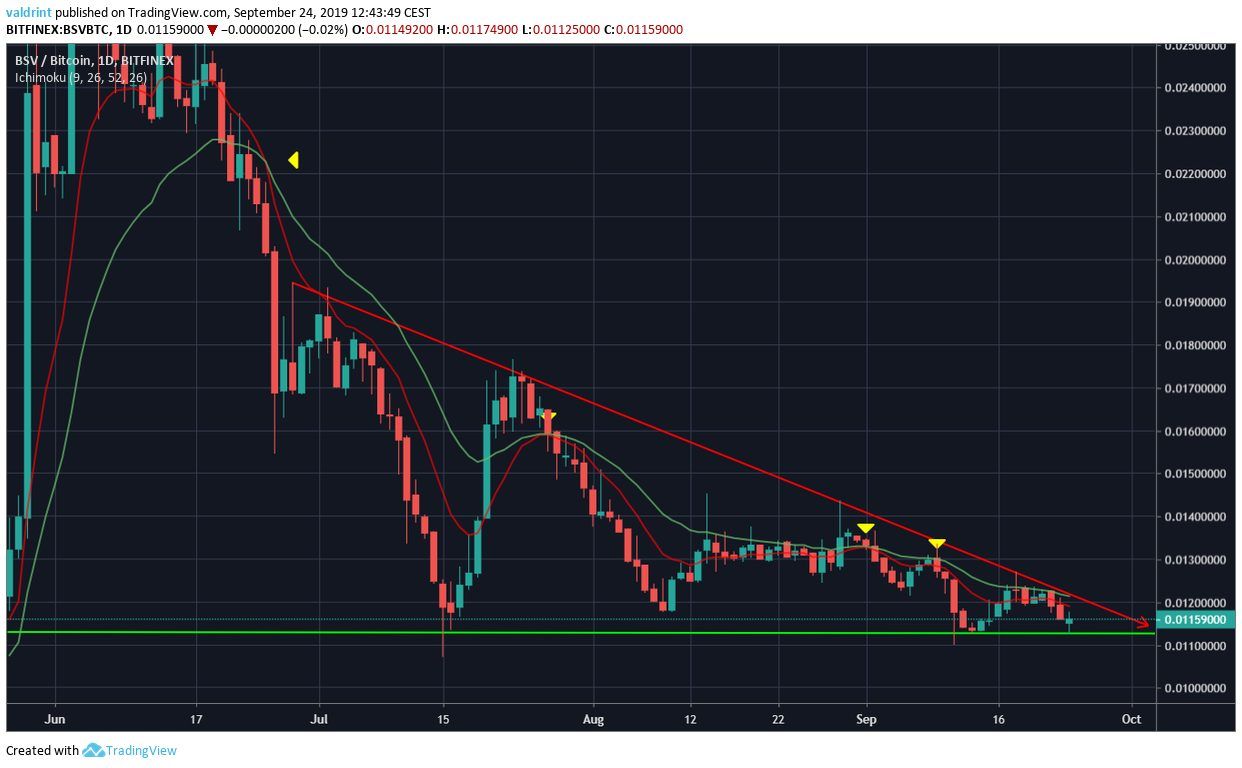 A bearish cross between the 10- and 20-day MAs occurred on June 24.
Since then, there have been three attempts at making a bullish cross — all unsuccessful.
At the current time, the BSV price is trading below both the 10- and 20-day MAs — facing very close resistance from the former.
A bearish cross between the 10- and 20-day MAs occurred on June 24.
Since then, there have been three attempts at making a bullish cross — all unsuccessful.
At the current time, the BSV price is trading below both the 10- and 20-day MAs — facing very close resistance from the former.
Double Bottom
Looking at a shorter time-frame, we can see that the BSV price has made a double bottom.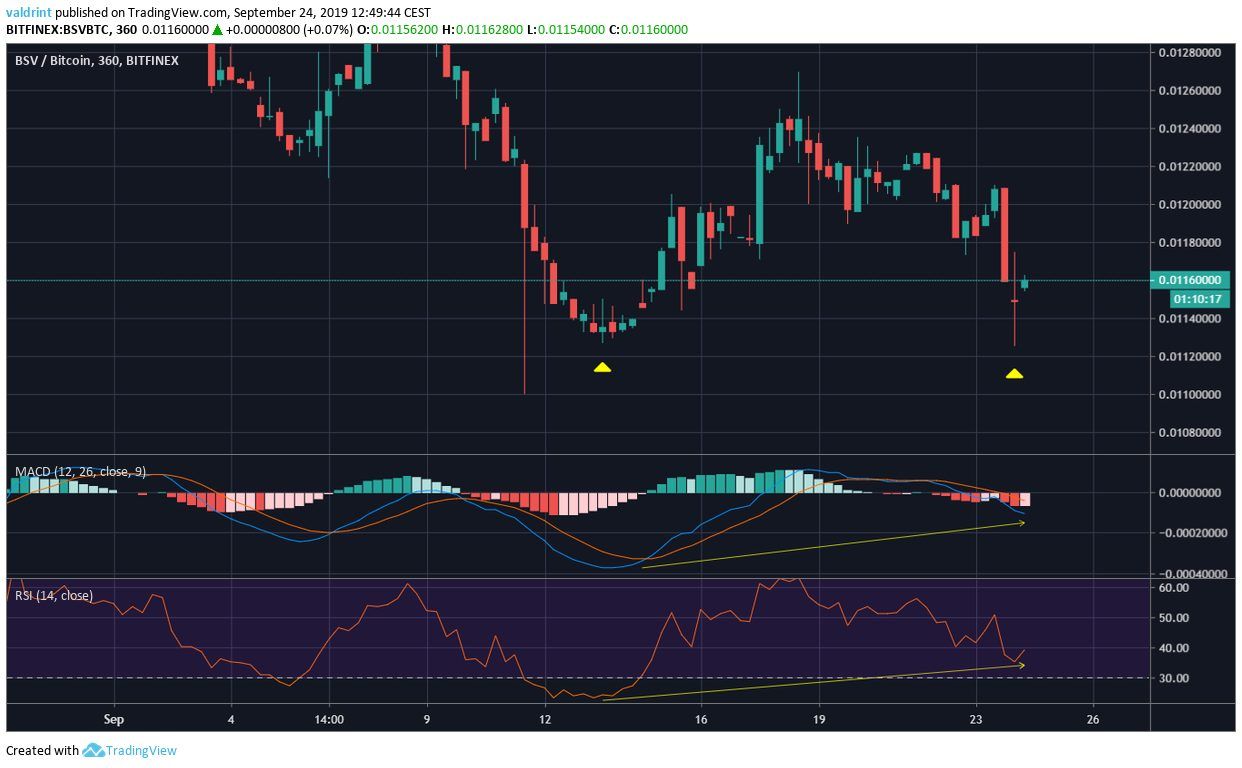 This has been combined with a bullish divergence in the RSI.
While this is a bullish sign, it is not significant enough to offset the creation of a long-term bearish pattern and significant resistance above the BSV price.
Therefore, we believe that any increase as a result of the double bottom will be short lived.
This has been combined with a bullish divergence in the RSI.
While this is a bullish sign, it is not significant enough to offset the creation of a long-term bearish pattern and significant resistance above the BSV price.
Therefore, we believe that any increase as a result of the double bottom will be short lived.
Future Movement
An outline of possible future BSV price movement is given below.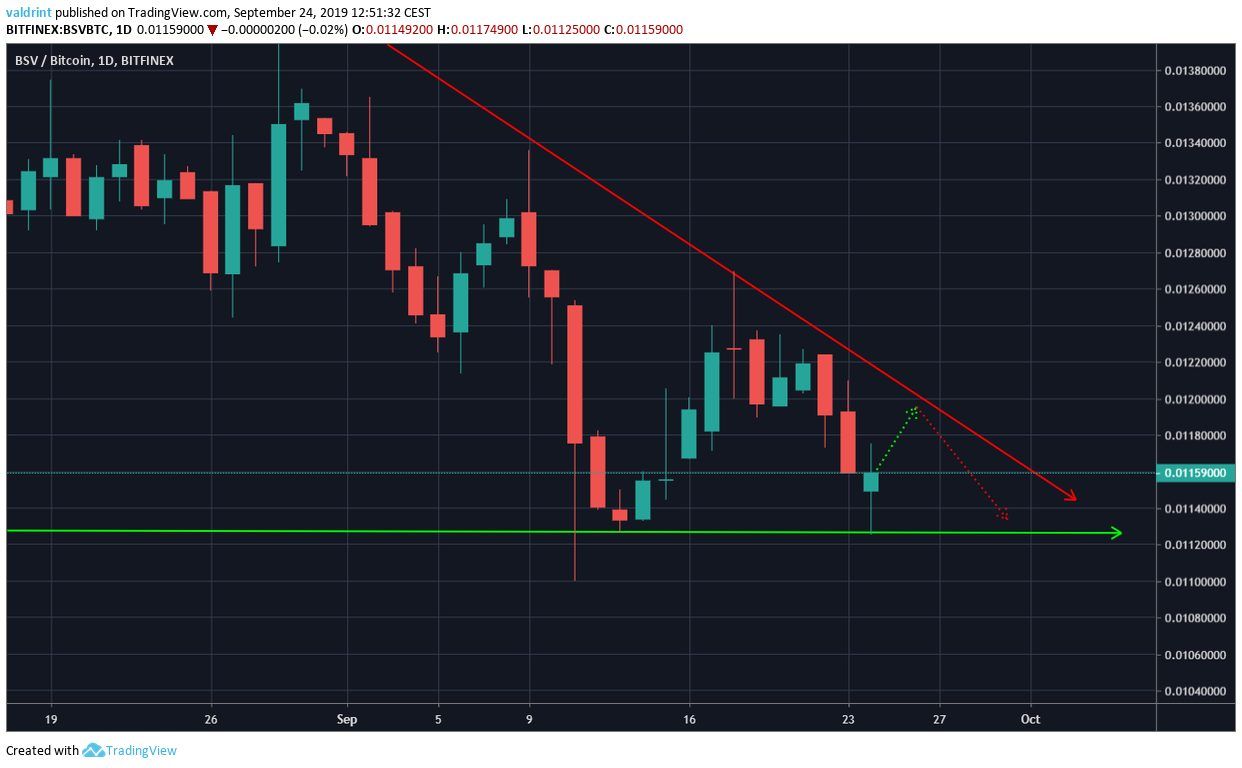 BSV is likely to increase towards the resistance line before again dropping to support.
If a breakdown occurs, the BSV price is likely to reach the support area at ₿0.008.
BSV is likely to increase towards the resistance line before again dropping to support.
If a breakdown occurs, the BSV price is likely to reach the support area at ₿0.008.
Bitcoin SV Price Summary
The BSV price is trading inside a descending triangle. According to our analysis, it is likely to reach the support line of the triangle and eventually break down. For hypothetical trading purposes, we consider BSV a sell. Do you think BSV will break down from the triangle? Let us know in the comments below.
Disclaimer: This article is not trading advice and should not be construed as such. Always consult a trained financial professional before investing in cryptocurrencies, as the market is particularly volatile. Images are courtesy of Shutterstock, TradingView.
Disclaimer
In line with the Trust Project guidelines, this price analysis article is for informational purposes only and should not be considered financial or investment advice. BeInCrypto is committed to accurate, unbiased reporting, but market conditions are subject to change without notice. Always conduct your own research and consult with a professional before making any financial decisions. Please note that our Terms and Conditions, Privacy Policy, and Disclaimers have been updated.

Valdrin Tahiri
Valdrin discovered cryptocurrencies while he was getting his MSc in Financial Markets from the Barcelona School of Economics. Shortly after graduating, he began writing for several different cryptocurrency related websites as a freelancer before eventually taking on the role of BeInCrypto's Senior Analyst.
(I do not have a discord and will not contact you first there. Beware of scammers)
READ FULL BIO
Sponsored
Sponsored