
On April 25, the Bitcoin SV (BSV) price broke out from a long-term descending resistance line. This is a bullish sign that suggests the price has begun a new upward trend. The Bitcoin Cash fork has only increased incrementally since then.
When zooming out, it is clearly visible that Bitcoin SV has been trending downwards for quite some time — creating numerous lower highs in the process. Cryptocurrency personality @liujackc stated his disbelief about the BSV price decrease, stating that:
BSV Price is down 40% since the conclusion of @CambrianSV Lisbon just over two months ago.CambrianSV is a boot camp for developers that are building on Bitcoin SV. The event in question was concluded on February 15. In this article, we will take a closer look at the BSV price and determine where it is heading next.
Long-Term Resistance
On April 21, the Bitcoin SV price broke out above a long-term descending resistance line. The line had been in place since January 14, when the price had reached a high of $458.7. Since the breakout, the price has increased, albeit only slightly. The closest resistance areas are found at $220 (minor) and $255 (major). Technical indicators give a bullish outlook. The BSV price has moved above its 200-day MA and validated it as support. In addition, the RSI has bounced at the 50-line and has moved upwards — a sign that the price has begun a bullish trend.

BSV versus BCH
The prices of BSV (candlesticks) and Bitcoin Cash (BCH, orange) are shown in the image below. In the period measuring from February 5, BSV has decreased by 24.71 percent while BCH has done so by 33.18 percent. The movement of both has been almost identical, especially until the March 13 bottom. However, BSV has fared slightly better during its recovery, hence the difference in the rate of decrease. BeInCrypto has previously compared the long-term price movement of BCH and BSV since their respective halving here.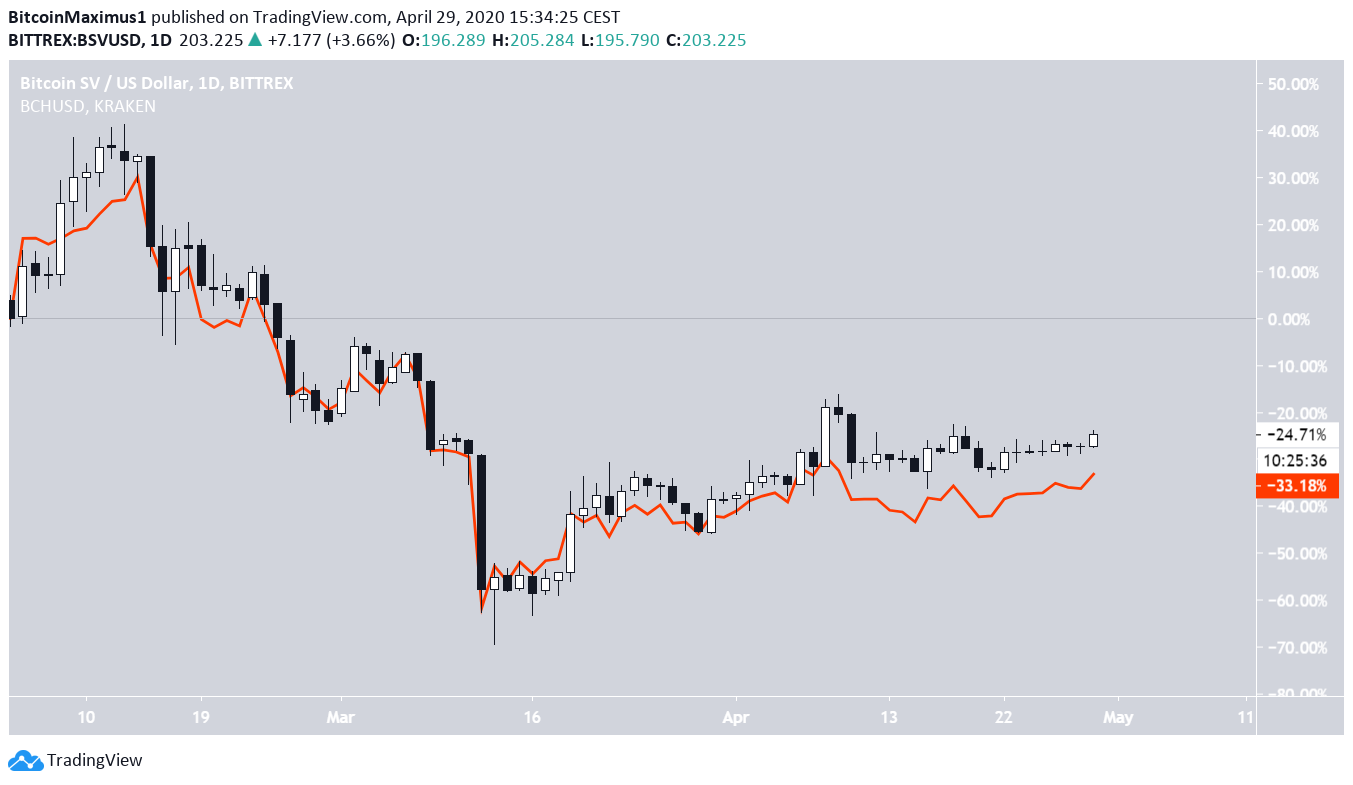
Disclaimer
In line with the Trust Project guidelines, this price analysis article is for informational purposes only and should not be considered financial or investment advice. BeInCrypto is committed to accurate, unbiased reporting, but market conditions are subject to change without notice. Always conduct your own research and consult with a professional before making any financial decisions. Please note that our Terms and Conditions, Privacy Policy, and Disclaimers have been updated.

Valdrin Tahiri
Valdrin discovered cryptocurrencies while he was getting his MSc in Financial Markets from the Barcelona School of Economics. Shortly after graduating, he began writing for several different cryptocurrency related websites as a freelancer before eventually taking on the role of BeInCrypto's Senior Analyst.
(I do not have a discord and will not contact you first there. Beware of scammers)
READ FULL BIO
Sponsored
Sponsored