


The Bitcoin (BTC) price reached a new all-time high on Dec. 1 but was not able to sustain the increase and has dropped back slightly since.
However, the price movement suggests that Bitcoin will soon make yet another attempt at breaking out, though a short-term correction could occur prior.
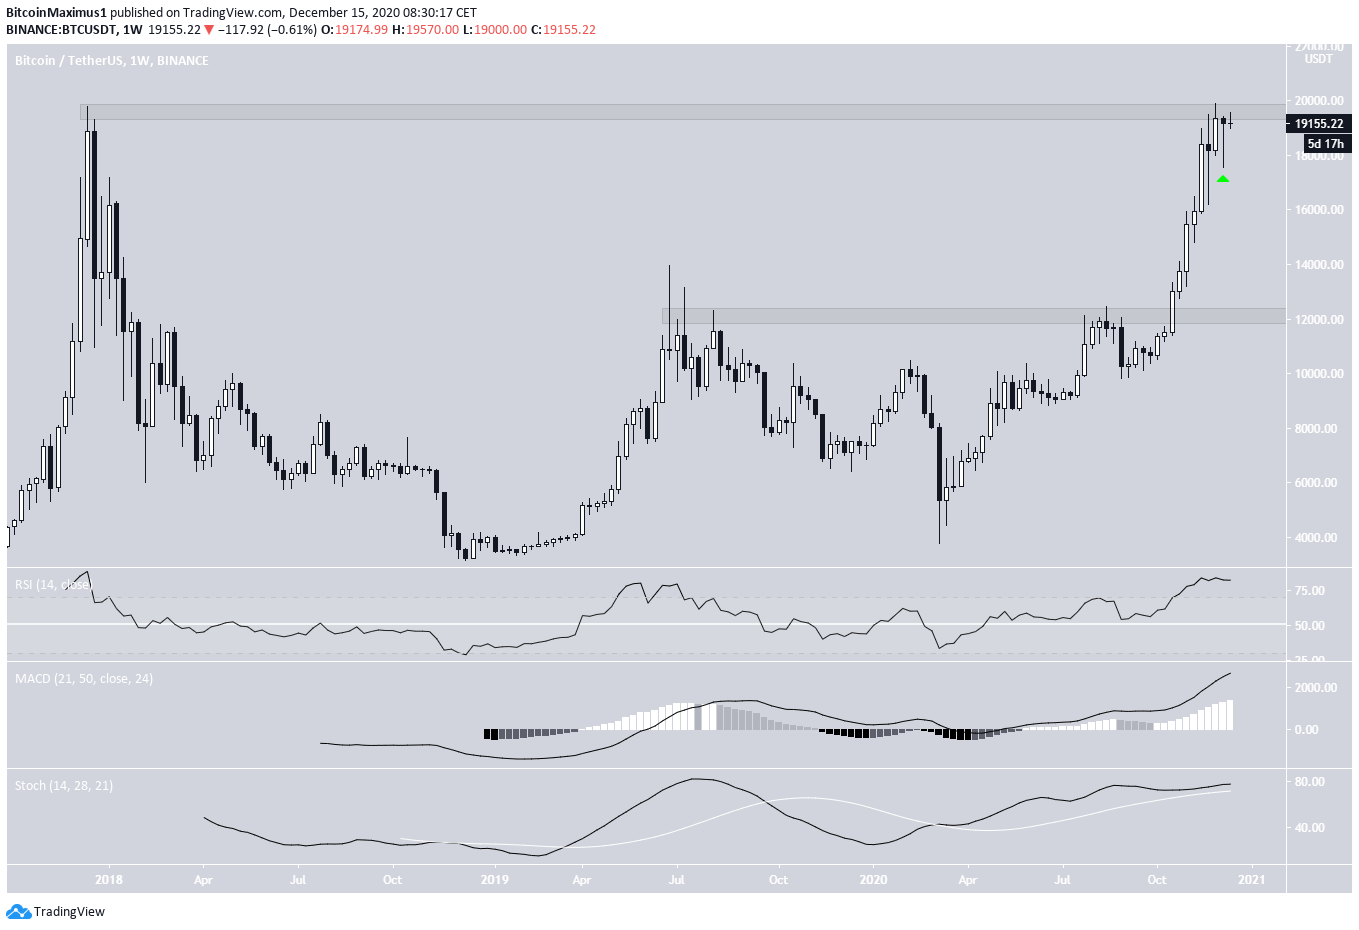
Bitcoin All-Time High Resistance
The weekly chart shows that BTC is trading very close to a long-term resistance area, created by the all-time highs near $19,600.
Last week, BTC created a hanging man candlestick, which is commonly considered a bearish reversal pattern, especially when coming after an extended upward move.
Despite this, technical indicators do not yet show weakness. The RSI, MACD, and Stochastic oscillator are all increasing despite being in overbought territory.
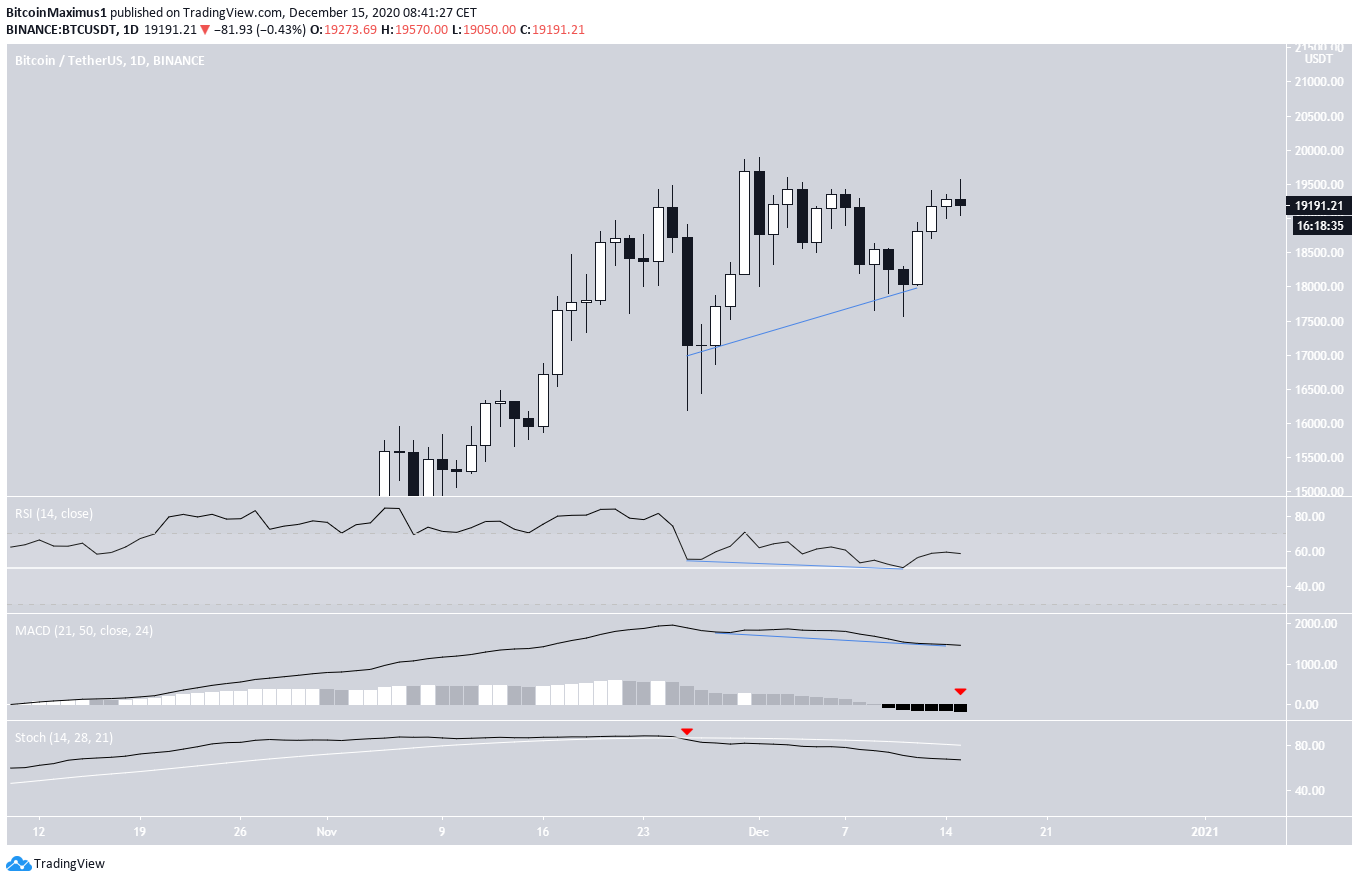
Trend Continuation or Rejection?
The daily chart for BTC gives ambiguous signals. While BTC is struggling to move above the prior highs, it has already made a higher low which was combined with long lower wicks. This is a sign of heavy buying pressure.
Technical indicators are also mixed:
- On the bearish side, the Stochastic oscillator has made a bearish cross, and both the RSI and MACD are decreasing.
- On the bullish side, the RSI and MACD have generated considerable hidden bullish divergences — a sign of trend continuation.
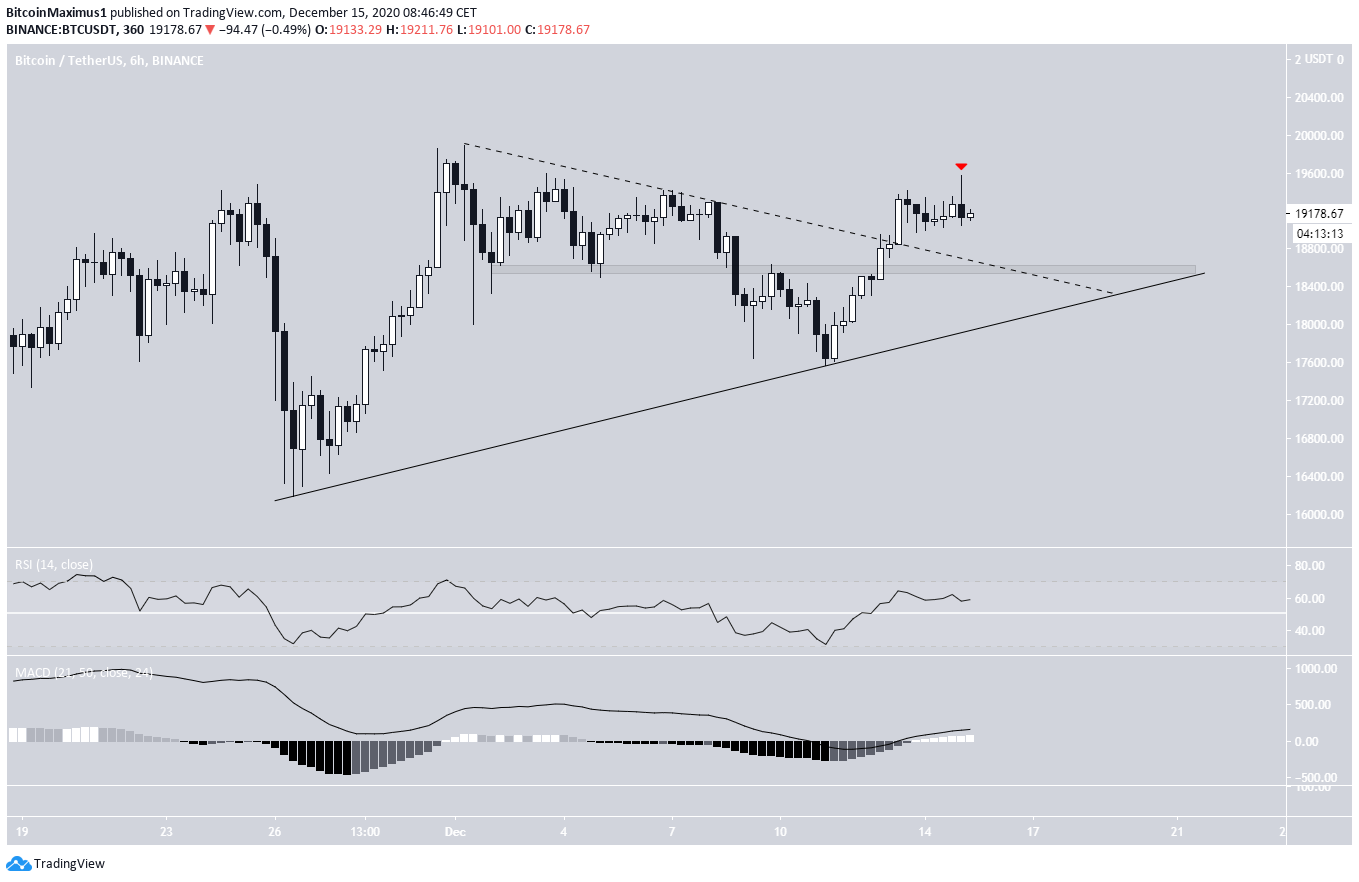
The six-hour chart also supports this possibility.
BTC has broken out from a symmetrical triangle but has yet to validate the breakout line (dashed line).
In addition, the ascending support line from the triangle is still intact and currently coincides with the minor $18,500 support level.
While technical indicators are bullish, BTC has created a shooting star candlestick, which could cause a drop in order to validate this support level before BTC move upwards once more.
Conclusion
While BTC could drop back to validate the $18,600 area, the trend seems to still be bullish and an upward move is expected to follow.
A breakdown below $18,500 and the ascending support line would invalidate this scenario.
For BeInCrypto’s latest Cardano (ADA) analysis, click here!
Disclaimer: Cryptocurrency trading carries a high level of risk and may not be suitable for all investors. The views expressed in this article do not reflect those of BeInCrypto.


