


The narrative of Bitcoin (BTC) cycles will continue to recur as long as halving has an impact on the BTC price, miner activity and investor psychology. In the author’s view of BTC cycles, a well-known analyst has published an up-to-date version of a spiral chart that perfectly shows the recurring phases of 4-year cycles.
Bitcoin cycles involve both the BTC price and on-chain data of short-term investors and their psychology. The repeating fractals once again falsify the expectations of crypto newbies that “this time is different.”
3 Phases of Each Bitcoin Cycle
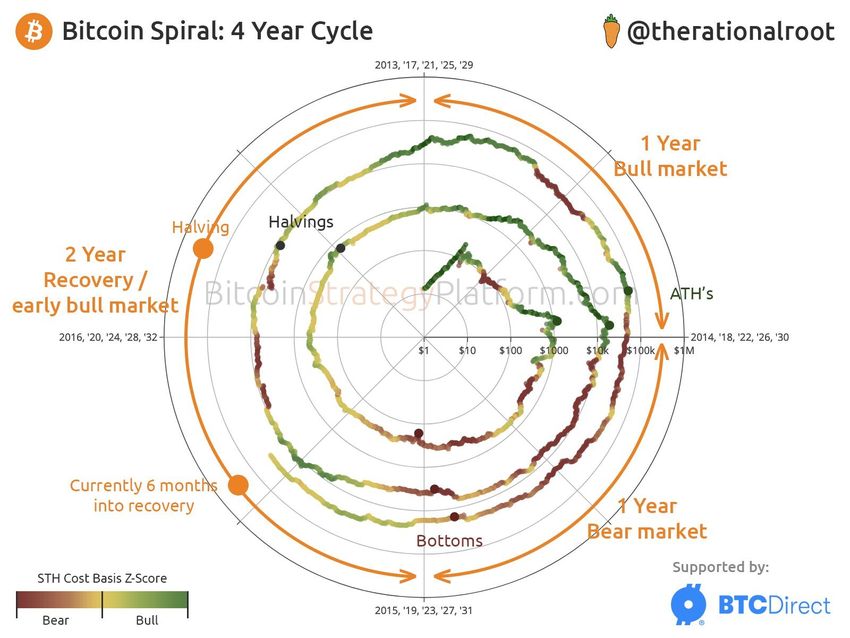
Well-known analyst @theratinalroot tweeted an updated version of his spiral chart of Bitcoin yesterday. He briefly described the rather complex fractal structure:
“The 4-year cycle is on point! Each cycle consists of 3 phases.”
The idea behind this innovative graphical representation of the historical price of BTC is the Bitcoin cycles hypothesis. This narrative is well known in the cryptocurrency market and is based on a halving event that occurs approximately once every 4 years.
Your financial future is a click away. Predict crypto prices now:
However, according to the analyst, each of Bitcoin’s three historical cycles to date has played out within 3 recurring phases. Interestingly, @theratinalroot doesn’t take into account the first genesis cycle, because, he says, “isn’t as interesting because it’s a bit of an outlier, as Bitcoin didn’t have price data during its first year.” Therefore, the 3 phases of each 4-year Bitcoin cycle are as follows:
- The mature bull market, which lasts for about 1 year. It is historically initiated by the BTC halving. On the chart, this is the first quarter (top right). This phase ends with a new Bitcoin all-time high (ATH). At the same time, he emphasizes that sometimes it can be a double top (as in 2013 and 2021) and sometimes a single top (as in 2017 and potentially 2025).
- The bear market, which lasts for about 1 year. It follows euphoria and a “blow-off top” of the BTC price. This is the second quarter of the chart. On average, during this phase of the cycle, Bitcoin loses 80% of its value, and the entire downtrend ends with 2 or 3 capitulation events. The vast majority of investors lose hope here.
- The early bull market, which lasts for about 2 years. This is the left half of the chart. After sharp declines and reaching a macro price bottom, there is a long phase of accumulation and a slow increase in the price of BTC. During this period, bitcoin generally goes up, but it does so very slowly with numerous corrections.
Bitcoin’s Spiral Fractals
According to the analyst, Bitcoin is currently in the third phase of its cycle. Which has been running roughly since early 2023. It will last at least until the next halving. Which, according to the latest data from BuyBitcoinWorldwide, is expected on April 17, 2024.
An interesting graphical representation of the above chart highlights the fractal similarities between Bitcoin cycles. These relate not only to the timing and regularity of the repeating phases, but also to the profits and psychology of crypto market investors.
First of all, @theratinalroot colored the chart with a scale from intense green to strong red. The former suggest market participants’ maximum profits, while the latter suggest their maximum losses. The data is based on the on-chain STH Cost Basis Z-Score indicator, which roughly describes the state of short-term investments of market participants. Their behavior best reflects the repeated patterns of BTC price action.
Then the analyst also published a slightly different version of his chart. In which he assigns successive phases of Bitcoin’s 4-year cycles to stages of investor psychology. These express the dominant emotions that surround market participants at each stage of the cycle.
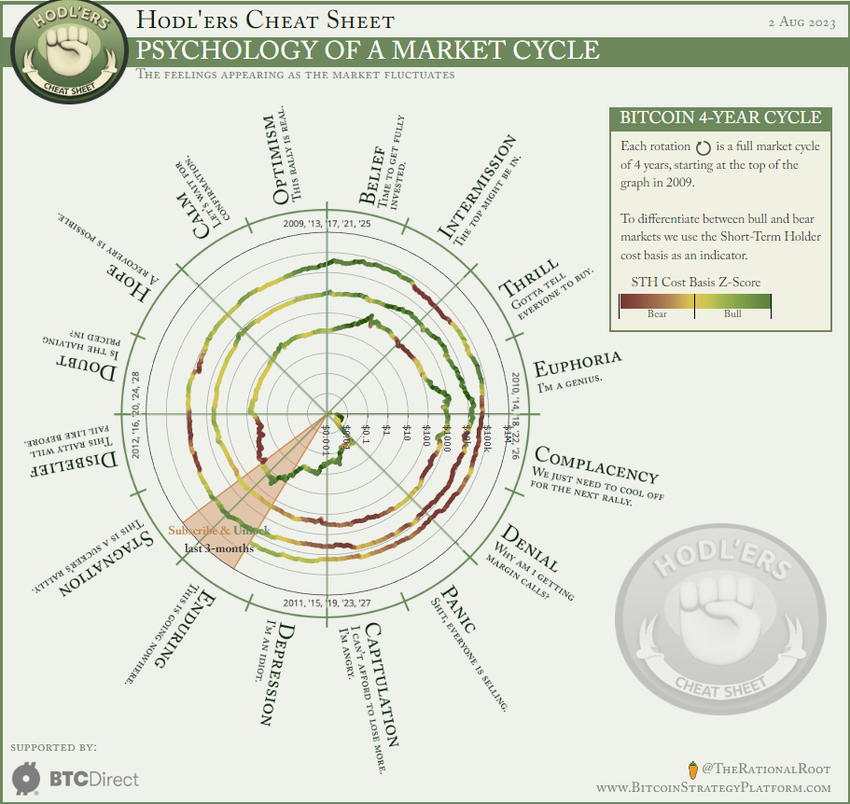
Thus, it turns out that the fractal similarity between Bitcoin cycles occurs not only with regard to the price of the largest cryptocurrency. But also – and perhaps most importantly – the psychology of market participants. Spiral cycles describe the halving-dictated changes in the BTC price just as well as they capture the prevailing emotions that overwhelm investors.
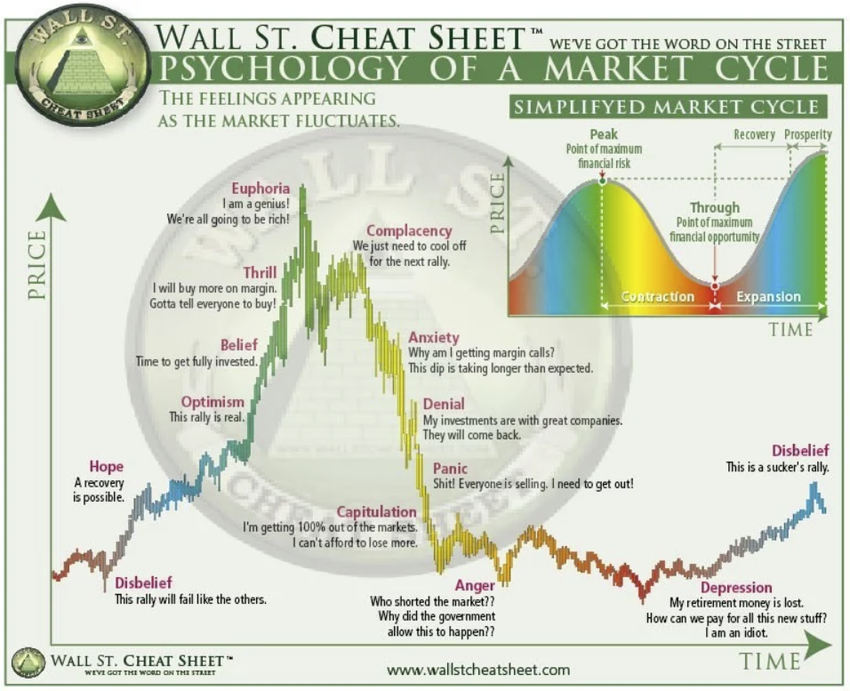
Naturally, the juxtaposition of price action and investor psychology is nothing revelatory. As it has been operating in traditional financial markets for decades.
Also, the psychological phases contained in the spiral chart of BTC coincide with those highlighted in the classic Wall Street Cheat Sheet: Psychology of Market Cycle. However, the key difference is that in mature traditional asset markets. Cycles are much harder to identify and usually last much longer than 4 years.
BTC Price Prediction: $60,000 by the End of 2024
The analyst concludes his discussion with a Bitcoin price prediction by the end of 2024. In his opinion, during the next 1.5 years, the BTC price is likely to return to the ATH area of $69,000. He points out that so far the early stage of the bull market has led to a recovery of about 30% of the loss against the ATH – from $15,000 to $30,000. In contrast, the remaining 70% should be made up by the end of 2024.
At the same time, he predicts that around halving in April 2024, the price of BTC will oscillate around $40,000. Further, it should hover in the $50,000 – $60,000 range in the second half of 2024.
Despite these moderately bullish BTC price predictions, the analyst recommends caution and reminds of events that could lead to deviations from the usual rhythm of Bitcoin cycles. According to him, the early approval of the BlackRock spot Bitcoin EFT could accelerate the upward phase.
Read More: 6 Best Copy Trading Platforms in 2023
On the other hand, he refers to still lingering fears of a global recession. If one were to occur, it would certainly affect the cycle of Bitcoin and the entire cryptocurrency market. However, the consequences would be difficult to predict:
“As there is no history of Bitcoin being in a recession, it’s difficult to predict how it exactly will respond. If it remains correlated to the S&P 500, a recession might temporarily cause turmoil.”
For BeInCrypto’s latest crypto market analysis, click here.


