

The Bitcoin (BTC) price broke out and reached a new all-time high price of $61,781 on March 13.
While a short-term decrease could occur, it’s likely that BTC could begin another upward movement after.
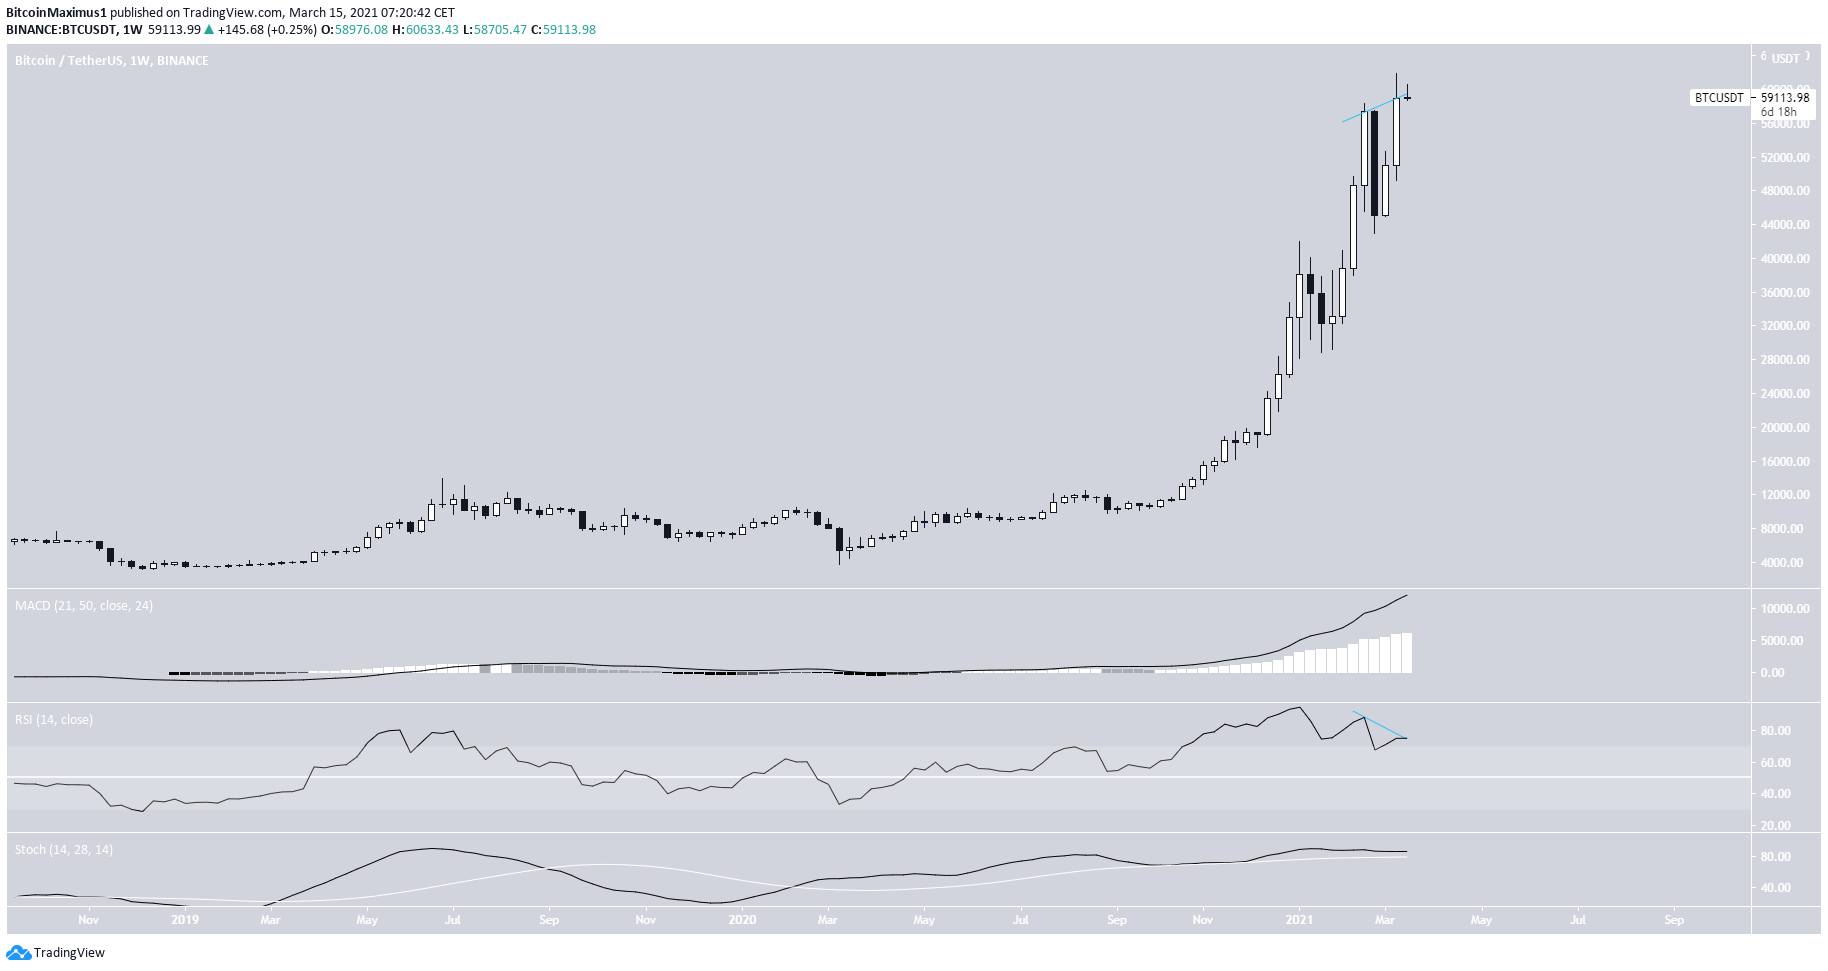
Bitcoin Weekly Outlook
Bitcoin increased considerably last week, reaching a new all-time high price of $61,844. The weekly candlestick close was bullish, even though there is a small upper wick in place.
The RSI has generated some bearish divergence — a potential reversal sign.
However, both the MACD and Stochastic oscillator are still increasing.
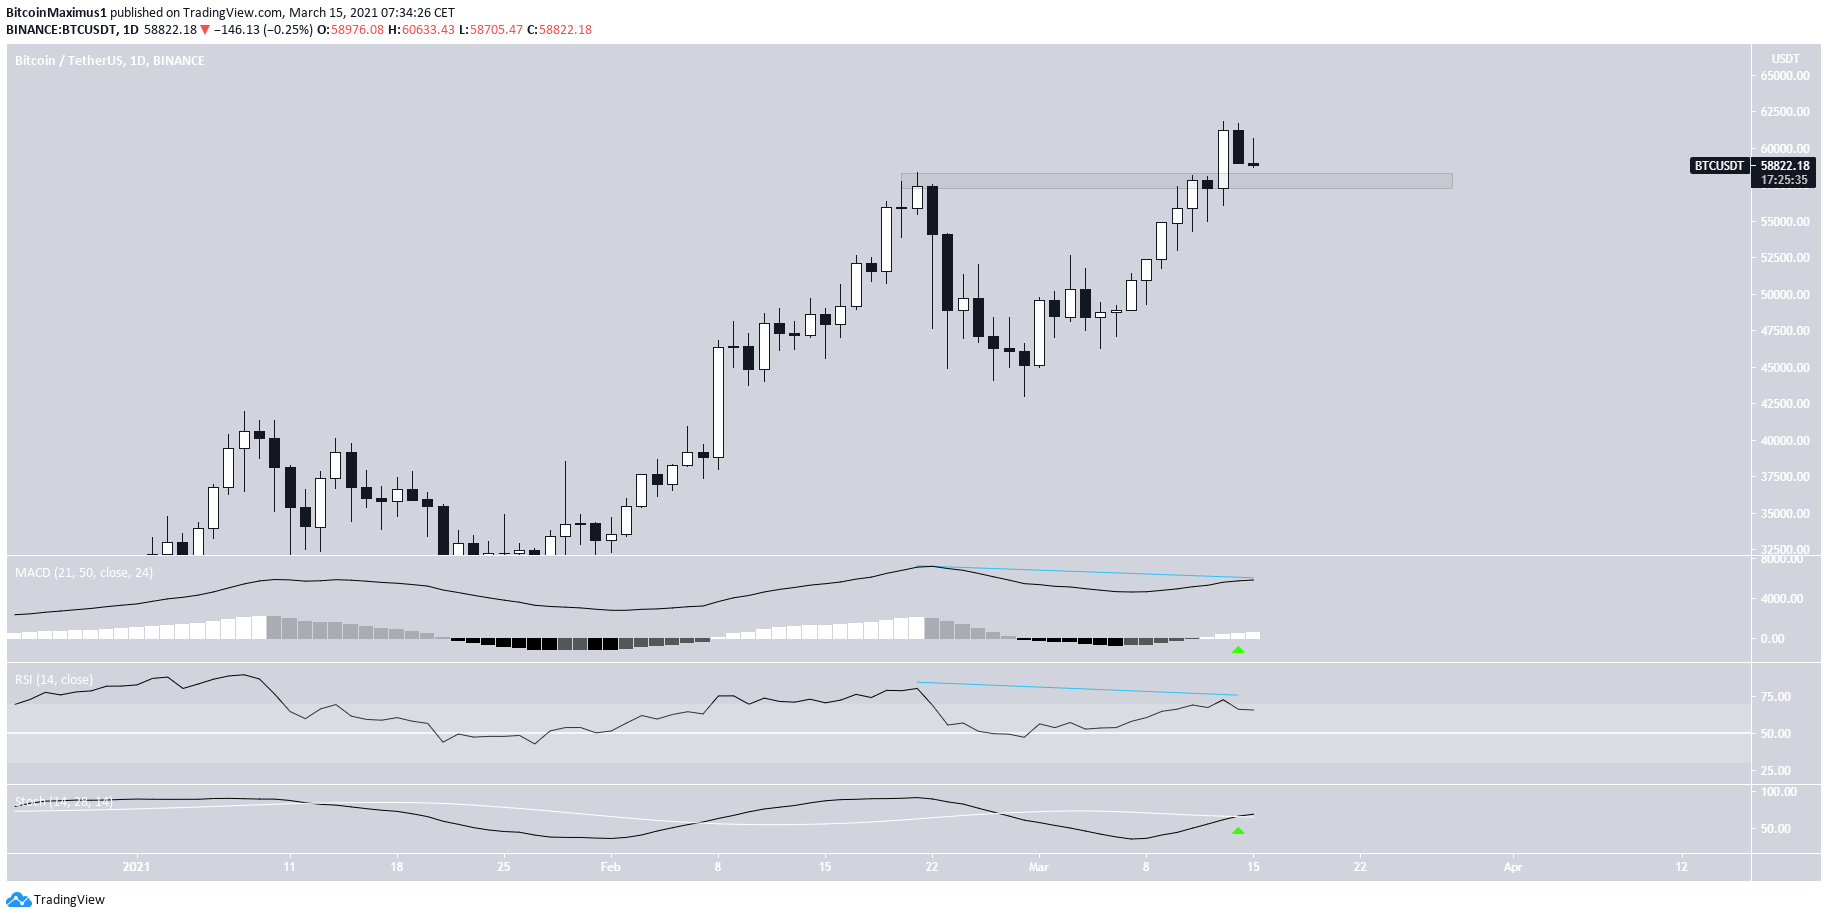
Bitcoin Daily
The daily chart provides a similar outlook.
The $58,000 area that BTC initially broke out from is now expected to act as support.
In another bullish sign, the Stochastic oscillator has made a bullish cross and the MACD has just turned positive.
However, similar to the weekly time-frame, both the RSI and MACD have generated a bearish divergence — a potential signal of a top.
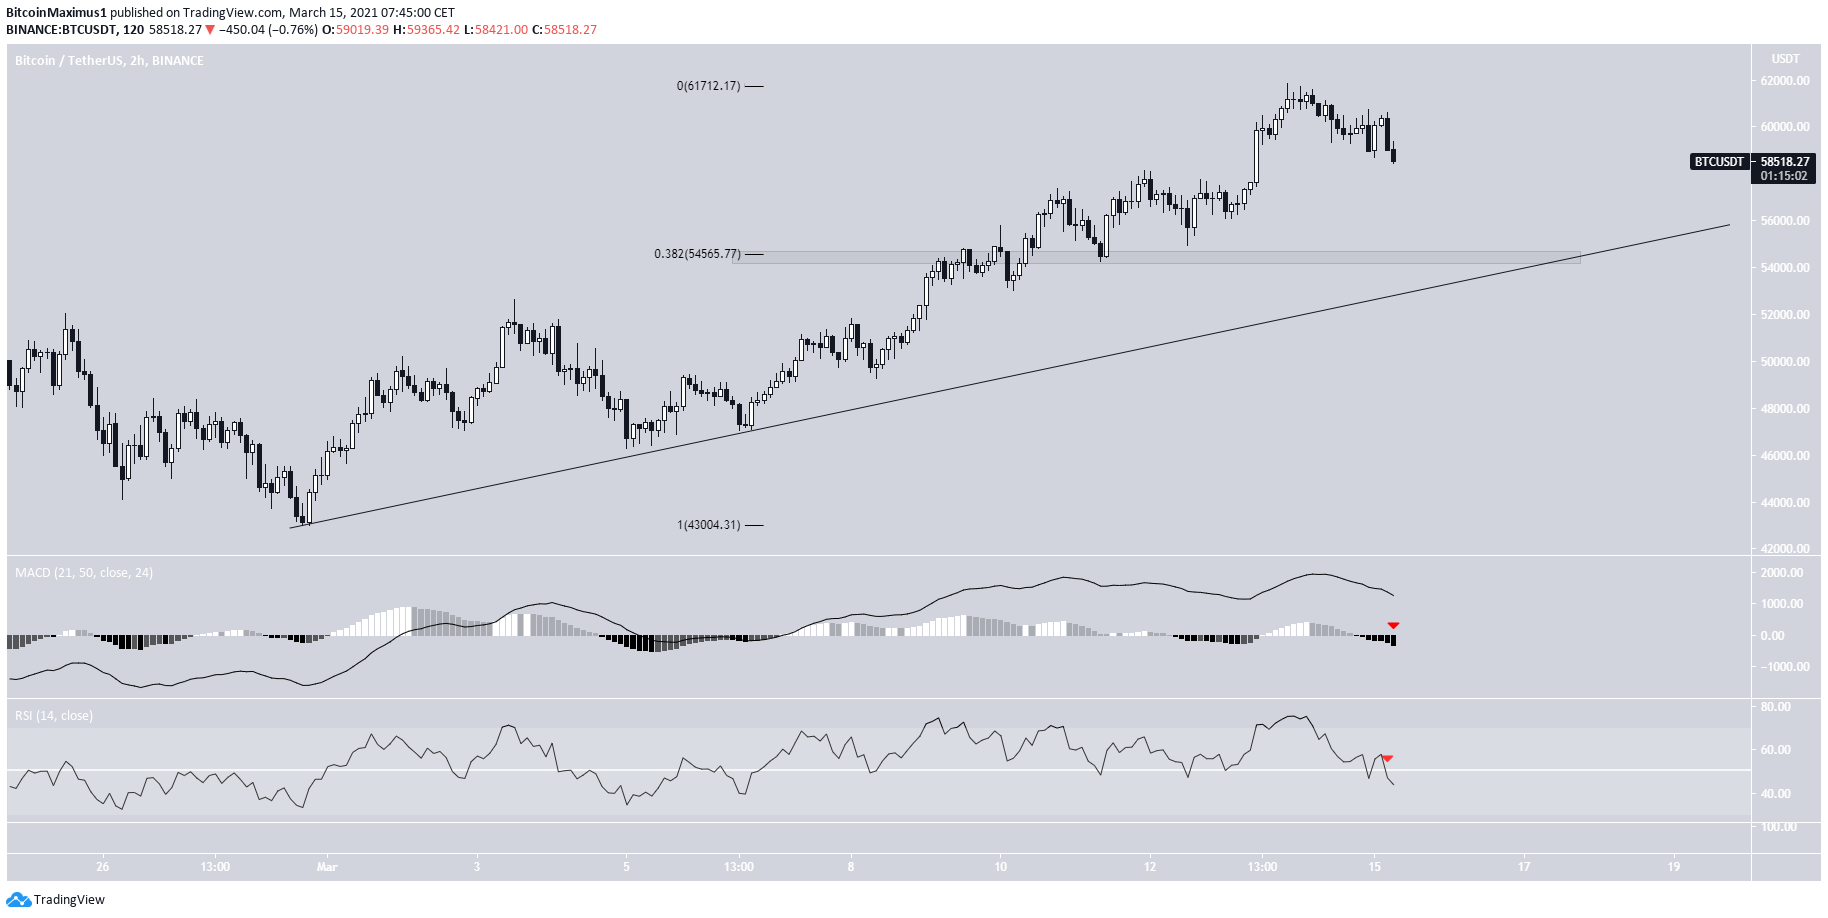
The two-hour chart also shows signs of weakness.
The MACD has crossed into negative territory while the RSI has crossed below 50. This suggests that a short-term decrease may occur. This is also supported by the bearish divergences in the weekly and daily charts.
If a decrease occurs, it’s possible that BTC could find support at $54,650. This is the 0.382 Fib retracement level and a short-term ascending support line.
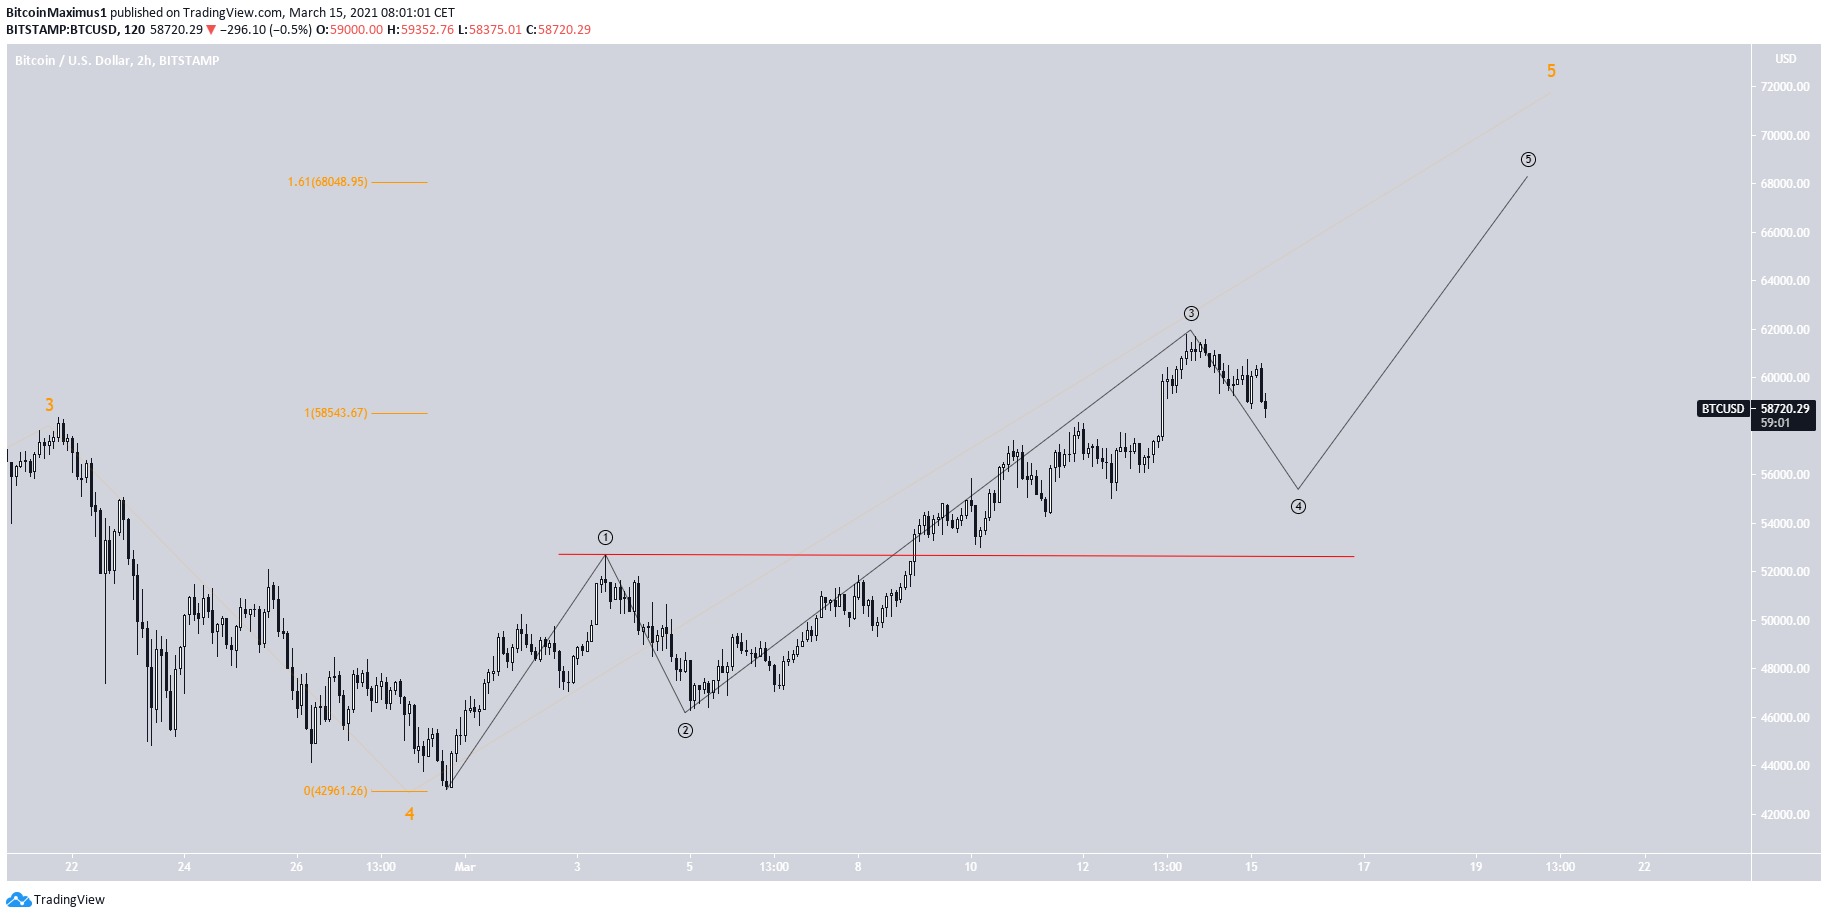
Wave Count
The wave count suggests that BTC is nearing the top of a bullish impulse (white) that began in March 2020. Currently, it’s in sub-wave five (orange).
A potential target for the top of the movement is found between $66,500-$72,300.
The latter target is found using a Fib projection on the sub-wave movement (orange). The former is found using a Fib projection on the movement of the entire wave (white).
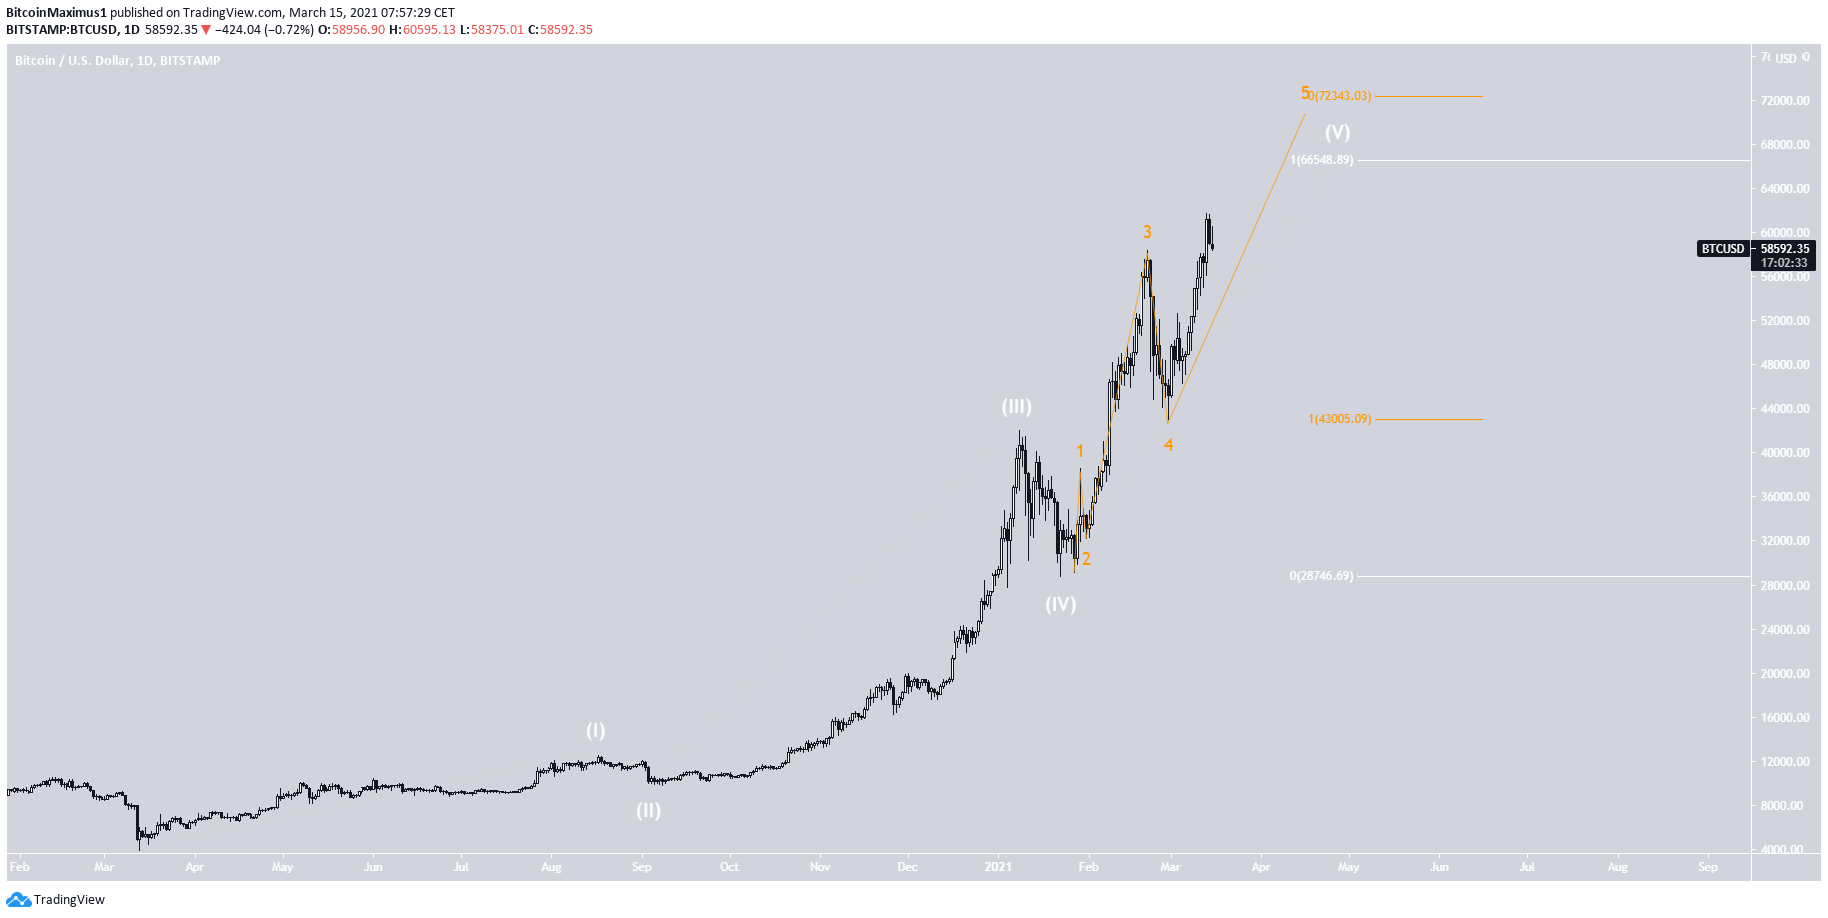
An even closer look shows that BTC is in minor sub-wave four (black). This fits with the previous readings that indicate another decrease is likely before bullish continuation.
A decrease below the minor sub-wave one high of $52,652 would likely mean that the move is finished.
Conclusion
Bitcoin is expected to decrease towards $58,000 and potentially $54,500. Afterward, another upward movement is expected.
For BeInCrypto’s previous Bitcoin (BTC) analysis, click here.
Disclaimer
In line with the Trust Project guidelines, this price analysis article is for informational purposes only and should not be considered financial or investment advice. BeInCrypto is committed to accurate, unbiased reporting, but market conditions are subject to change without notice. Always conduct your own research and consult with a professional before making any financial decisions. Please note that our Terms and Conditions, Privacy Policy, and Disclaimers have been updated.
