

The Bitcoin (BTC) price has been retracing since getting rejected by the $52,500 resistance area on March 3.
Bitcoin is approaching a crucial support area. A strong resurgence will be mandatory for the possibility of bullish continuation to remain.
Bitcoin Bounce Retraces
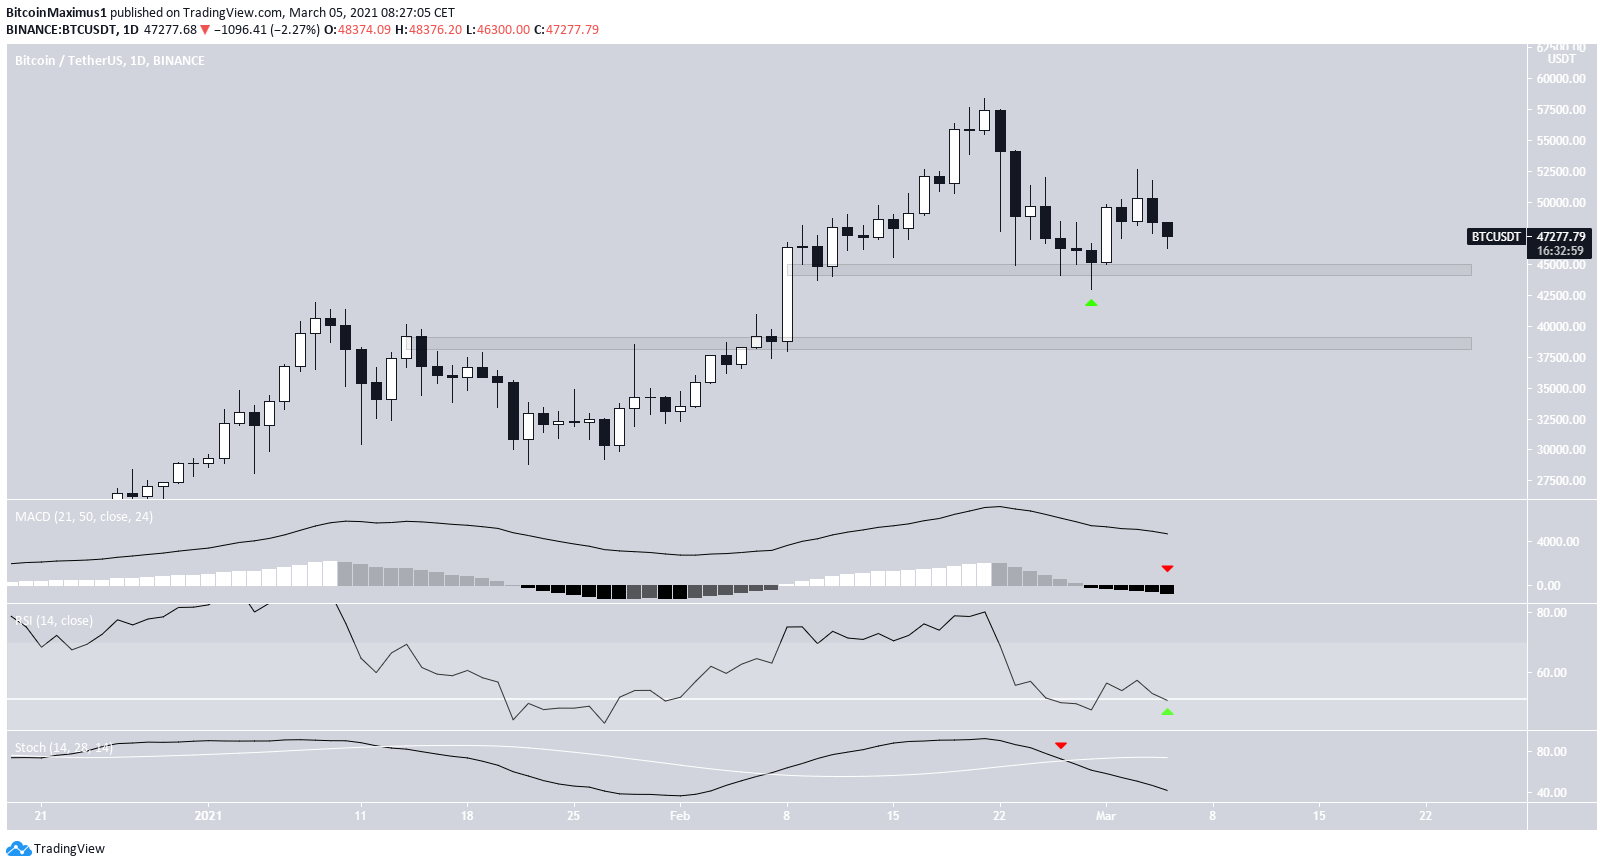
On Feb. 28, BTC reached the $45,000 support area and bounced upwards. It proceeded to reach a high of $52,652 four days later but has been moving downwards since.
So far, BTC has reached a low of $46,294 in the early hours of March 5. This is still inside the body of the bullish candlestick of March 1. Therefore, it’s still inside the parameters of a normal retracement.
However, both the MACD and Stochastic oscillator are bearish. The latter has already made a bearish cross. On the other hand, the RSI is trying to hold on above the 50-line.
Bitcoin Struggles to Find Support
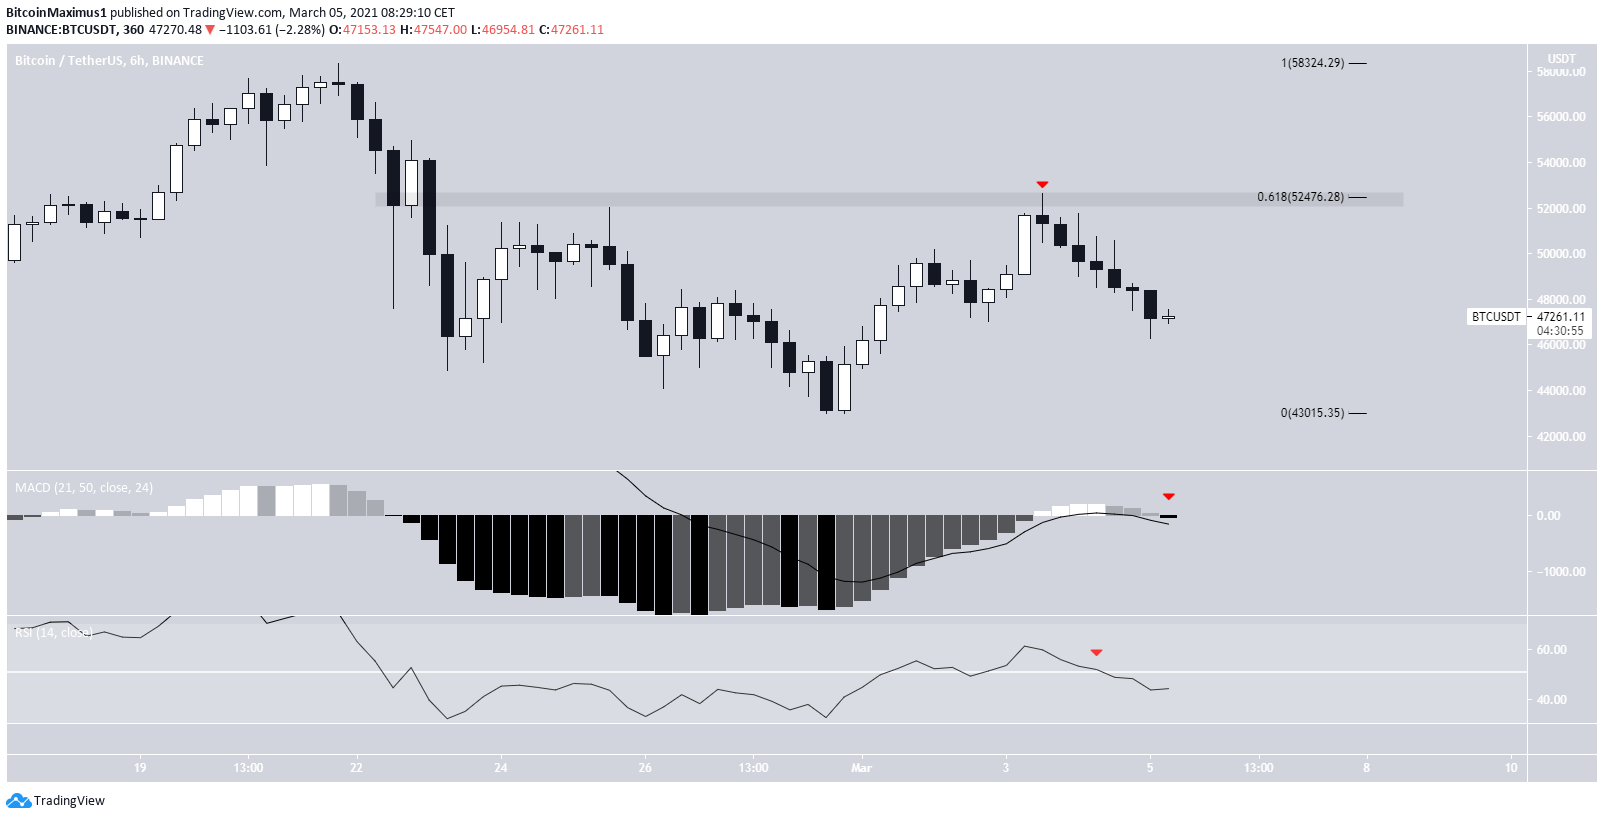
The six-hour chart shows that the main resistance area is found at $52,476. This is the 0.618 Fib retracement of the most recent downward movement and a horizontal resistance area.
Therefore, until BTC manages to clear it, we cannot consider the trend bullish — at least not in the short/medium-term.
Similar to the daily time-frame, the MACD and RSI are bearish.
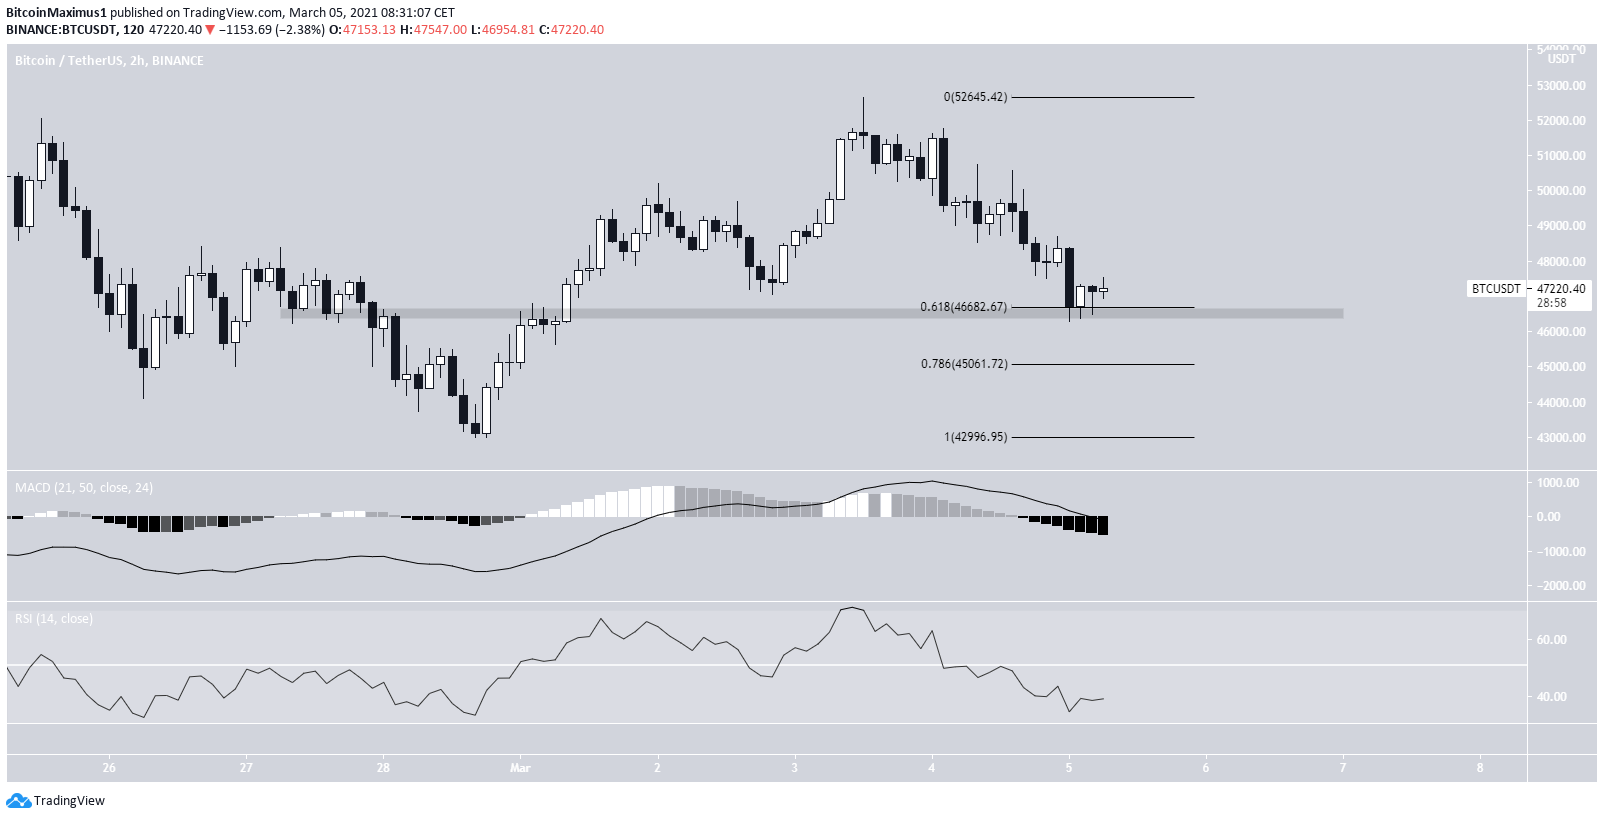
Finally, the two-hour chart shows that BTC is still above the $46,600 support area (0.618 Fib retracement).
However, there are no bullish reversal signs yet.
If BTC were to break down, the next closest support area would be found at $45,000. This is the 0.786 Fib level of the most recent move and a horizontal support area from the daily chart.
Therefore, the loss of this level would be a significant bearish development for BTC.
Corrective Decrease?
A look at the very short-term 15-minute chart shows a continued decrease that has been ongoing since March 3.
The downward movement is perfectly channeling, and the significant overlap suggests that it’s likely to be corrective. This means that despite the lack of bullish reversal signs, an eventual breakout is expected.
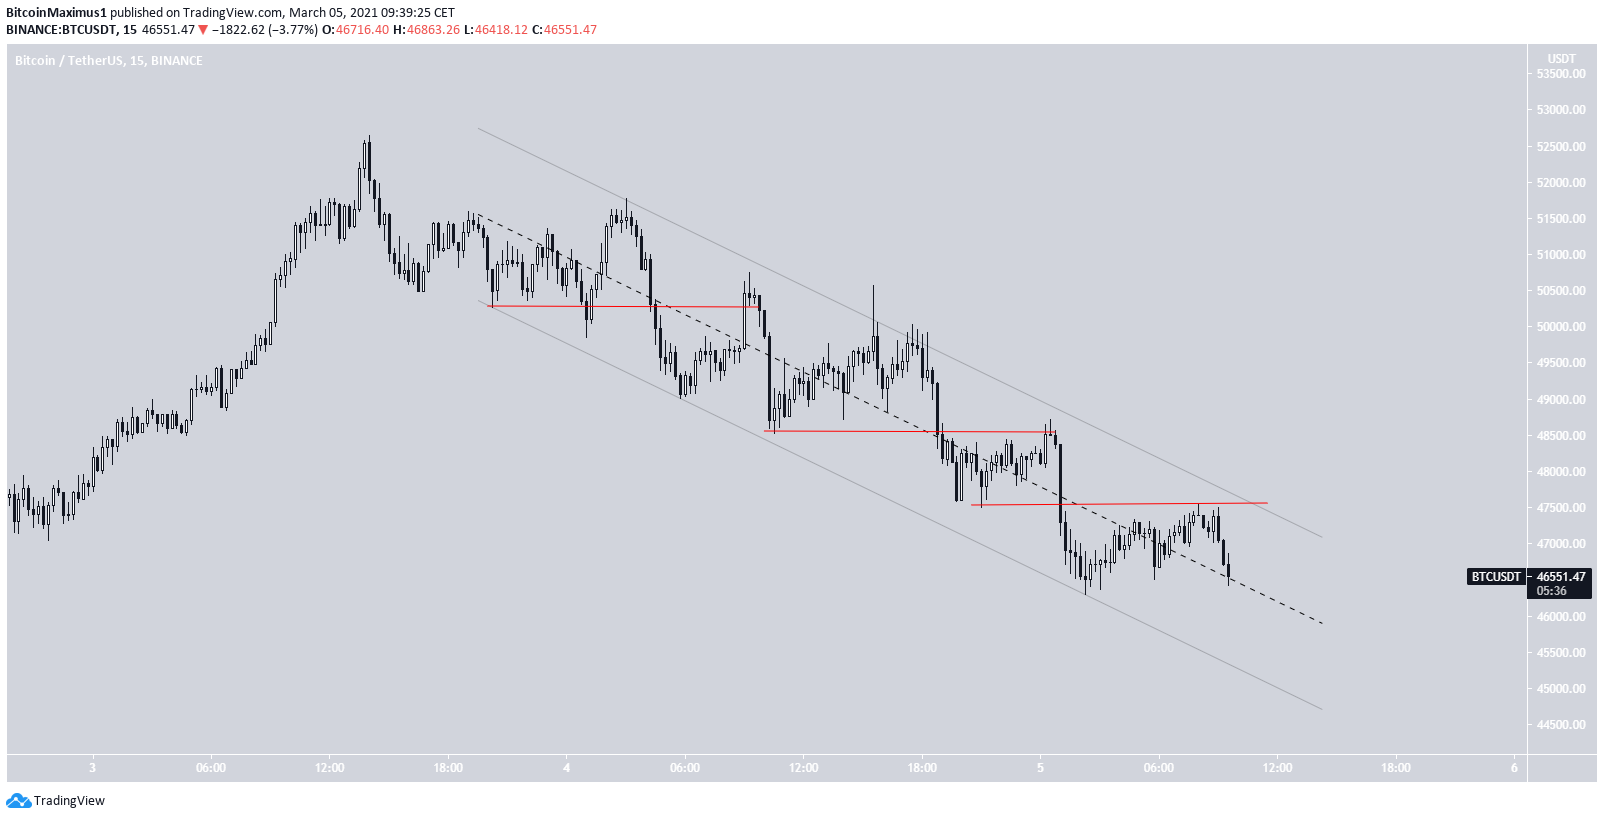
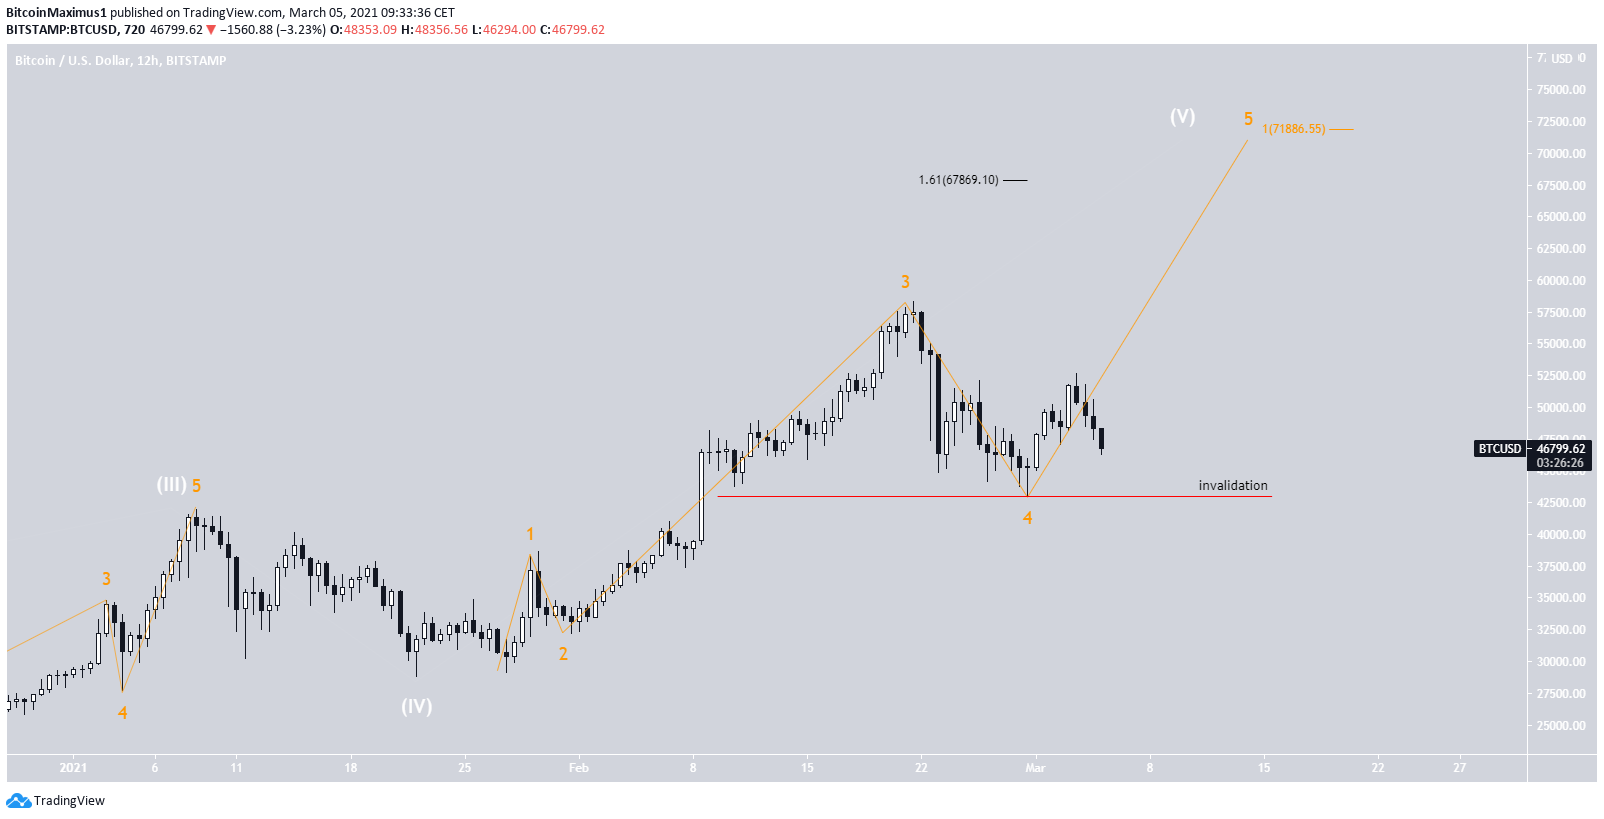
The most likely wave count suggests another upward move towards a new all-time high.
However, a decrease below the Feb. 28 low would signal that BTC is likely to fall towards $40,000.
Conclusion
Bitcoin is expected to find relief at one of the support levels outlined and continue moving higher.
The loss of the $45,000 support area would be a major bearish development, indicating that the local low might not be in yet.
For BeInCrypto’s previous Bitcoin (BTC) analysis, click here.
Disclaimer
In line with the Trust Project guidelines, this price analysis article is for informational purposes only and should not be considered financial or investment advice. BeInCrypto is committed to accurate, unbiased reporting, but market conditions are subject to change without notice. Always conduct your own research and consult with a professional before making any financial decisions. Please note that our Terms and Conditions, Privacy Policy, and Disclaimers have been updated.
