


The Bitcoin (BTC) price had been slowly retracing upwards after a sharp drop on Aug 11.
Technical indicators and the price movement indicate that the increase is more likely to be a correction rather than the beginning of a new upward trend.
Bitcoin Retraces After Drop
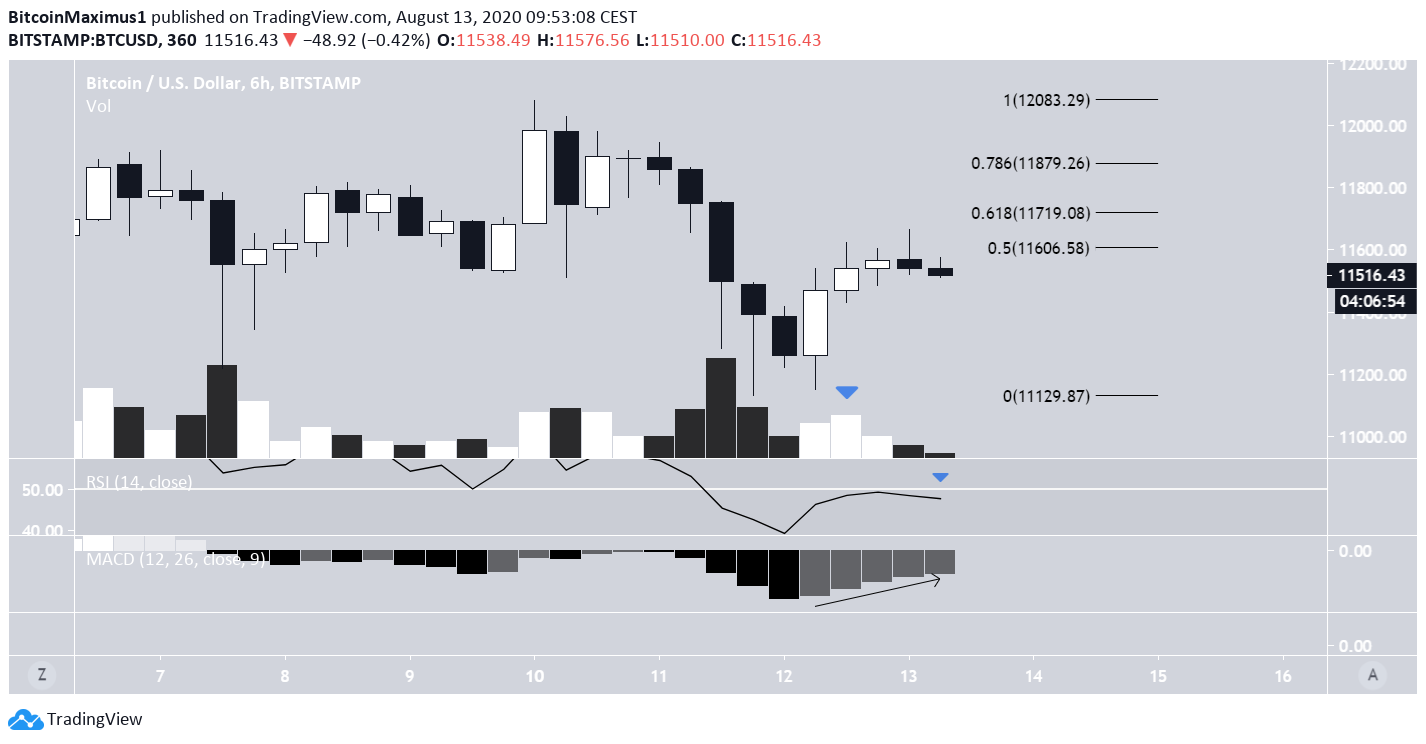
In yesterday’s analysis, BeInCrypto stated that “The price has created what resembles a double-top,” with the second top being completed on Aug 10.
Last night, the price was rejected between the 0.5-0.618 Fib levels found between $11,606 and $11,719. It then began a downward move that is still ongoing.
While the RSI was rejected by the 50-line and is moving downwards, there is a bullish divergence in the 6-hour MACD, casting some doubt in the possibility of a continued downward move transpiring.
However, the daily MACD is still bearish. In addition, volume has been weak during bullish candlesticks.
An increase above the 0.786 Fib level would likely void any regular corrective patterns.
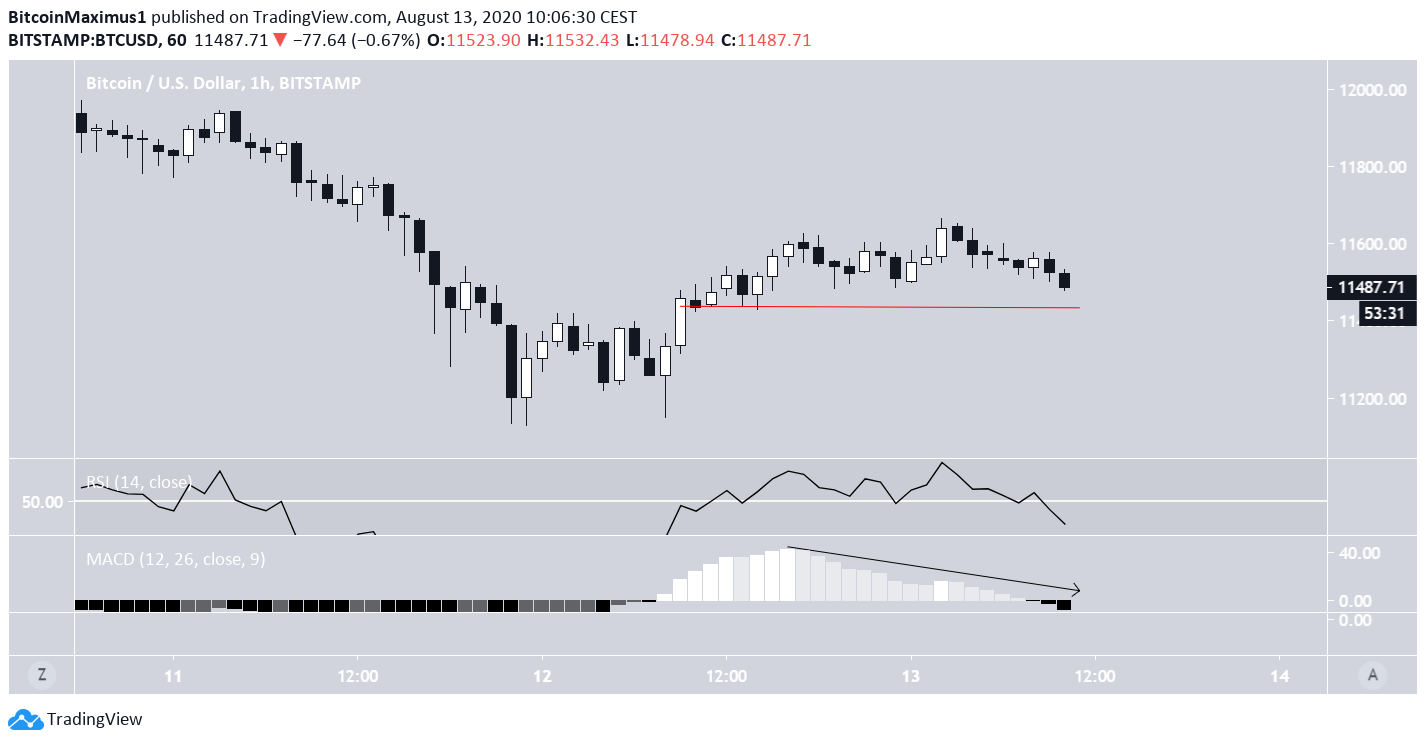
The hourly chart shows bearishness in both the MACD and RSI. In addition, hourly closes are making lower-lows. An hourly close below $11,400 would likely trigger a sharp drop towards $11,000.
Wave Count
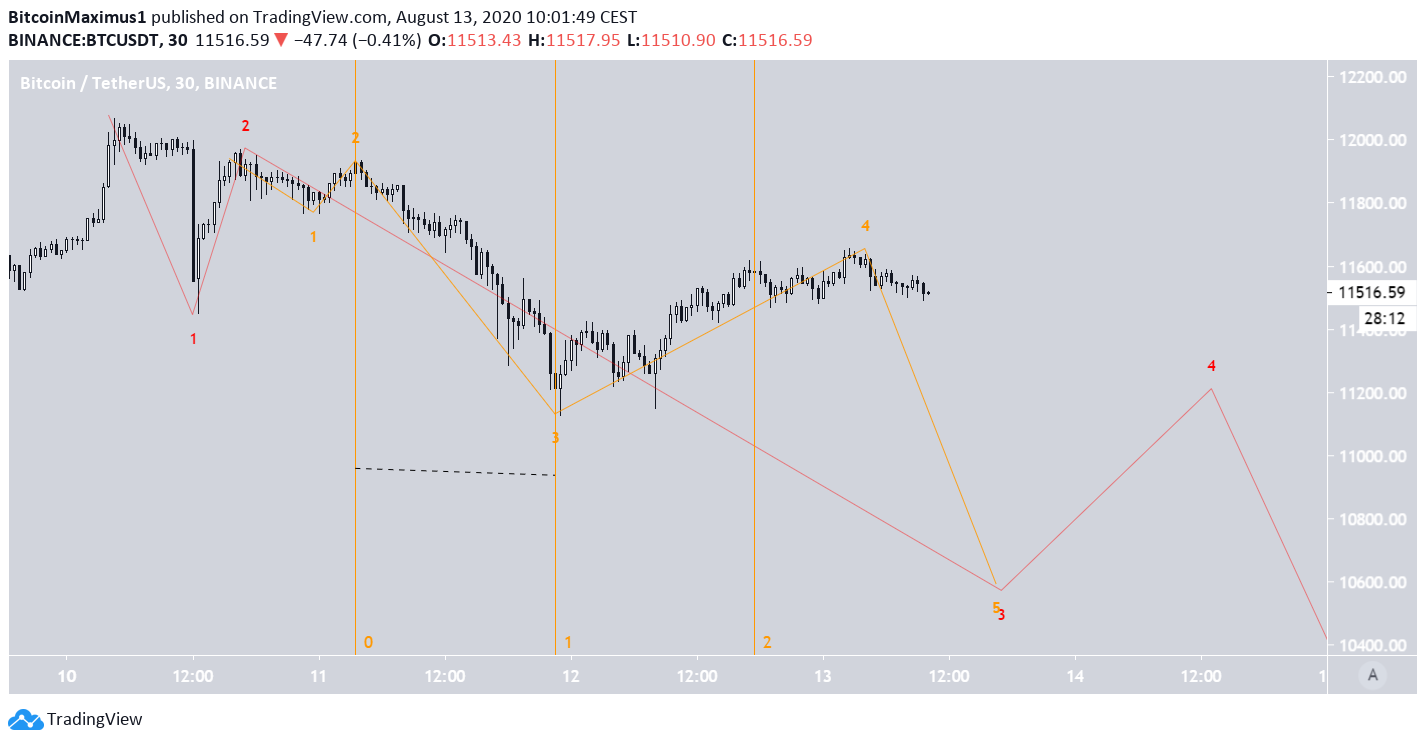
In yesterday’s analysis, BeInCrypto stated that the price is likely in a C wave, which could end around “$10,220-$10,500 on August 15.”
The C wave is expected to transpire in a five-wave formation, outlined below in red. There are two possible wave counts for this movement, both of which suggest that the third wave has been extended. The sub-waves for this extended wave are shown in yellow.
The first wave count suggests that the price has currently begun the fifth sub-wave. However, the fourth corrective sub-wave has taken a very long time to transpire, going further than the Fib time retracement level of 2, so it is possible that another wave count is correct.
The other possibility is that the price has created what is known as a 1-2/1-2 wave formation. This suggests that the third wave will be extended, and could take the price even lower than the original target of $10,220-$10,500.
The length of the downward movements and their respective corrections make this a more likely wave count.
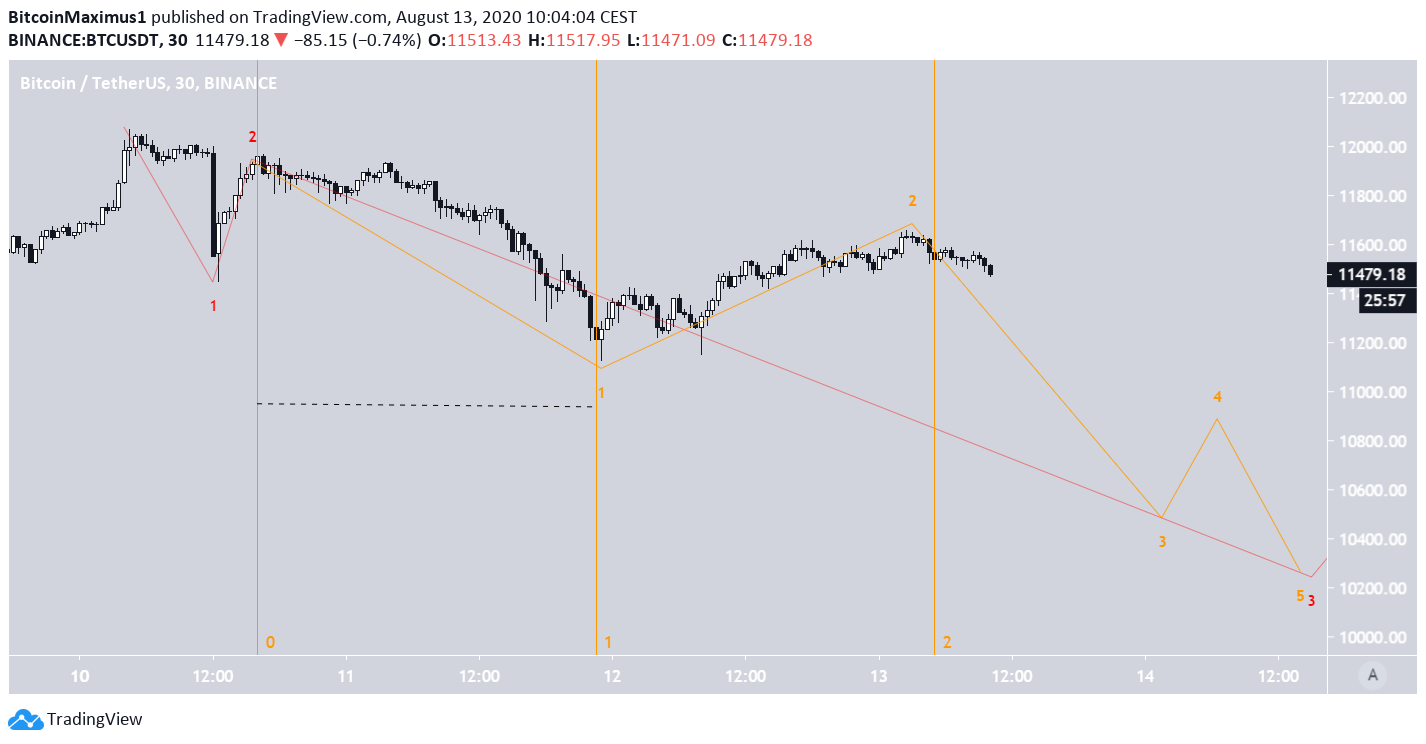
To conclude, the Bitcoin price has likely begun the C wave of its correction, which could end near $10,220-$10,550.
For our previous analysis, click here.


