


While the Bitcoin (BTC) price has increased considerably over the past few weeks, it has failed to reach a close above a crucial long-term resistance area at $12,100.
Instead, the price has created a bearish pattern and began a short-term downward movement.
Bitcoin Reaches Long-Term Resistance
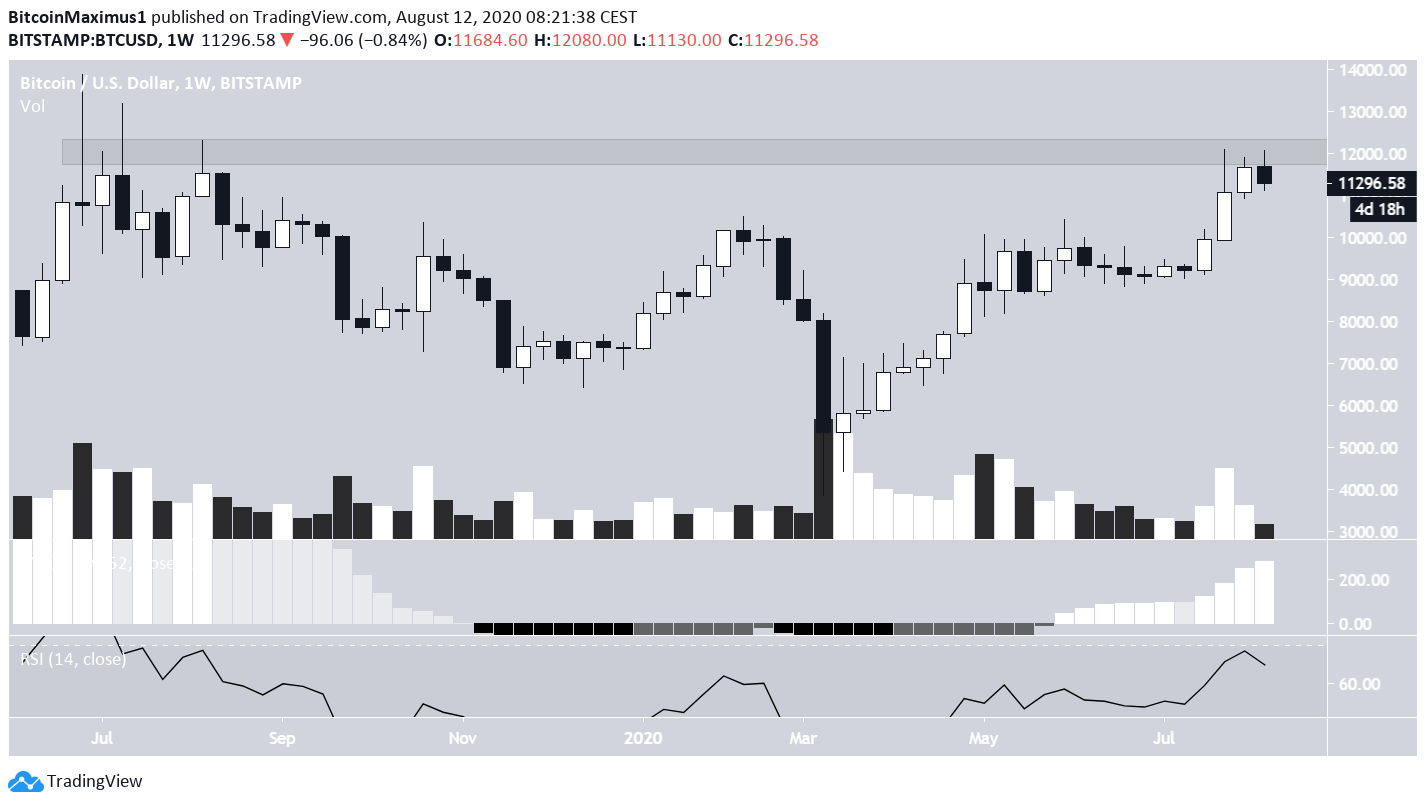
The Bitcoin price has been increasing at an accelerated rate beginning on July 20.
In the weeks that followed, the price managed to reach a high of $12,100, but decreased afterward, leaving a long upper-wick in place. The price has been trading between $11,000-$12,100 since, failing to reach a close above the latter.
The $12,100 area is crucial since it acted as the top of the July 2019 rally, before following up with a correction that continued until March 2020.
The price has not reached a weekly close above $12,000 since January 2018. When BTC does manage to close over this level, it could trigger another accelerated upward move and further confirm a bullish trend.
Technical indicators provide a bullish picture. The MACD is increasing for the eleventh week in a row, and the RSI is also moving upwards, still being below overbought levels and without a trace of bearish divergence.
Double-Top Signifies Weakness
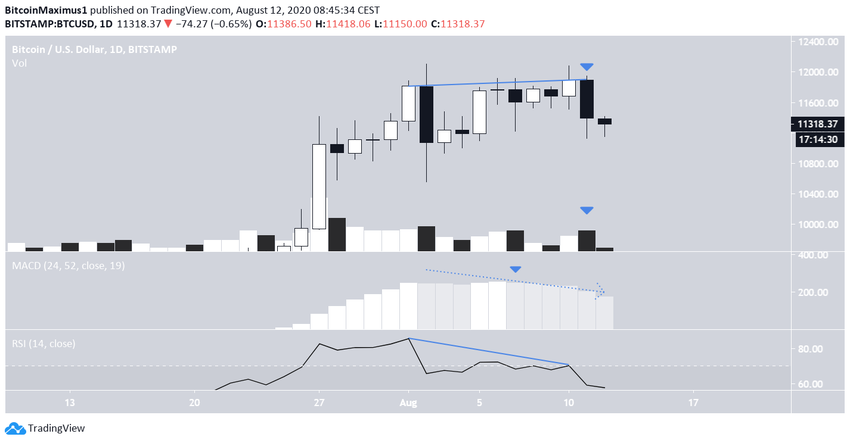
The daily chart, on the other hand, shows considerable weakness in the current trend.
The price has created what resembles a double-top, which is normally considered a bearish reversal pattern. The second top was also combined with a bearish engulfing candlestick, which transpired with a higher volume than its preceding bullish counterpart.
The double-top has also been combined with a significant bearish divergence in both the RSI and the MACD. The latter has been losing strength, shown by the shorter momentum bar.
These are signs that the price could continue to decrease.
Wave Count
As for the wave count, it is possible that the price has begun a corrective movement after it reached a local high of $12,123 on Aug 2.
The Aug 10 daily high, which completed the double-top pattern outlined in the first section could have been the B wave, and currently, the price has resumed its downward movement inside the C wave.
The likeliest level for the C wave to end would be a relatively broad range between $10,586 and $9,700, the 0.5-0.786 Fib levels of the entire upward move.
Considering that the C low often falls below the A low, the 0.5-0.618 Fib area is the most likely zone for a correction to end. A slightly less-conservative estimate of this range could find the price move between $10,220-$10,500.
As for the time it will take to complete this correction, we can use a Fib time retracement tool on the entire wave 3, in which the 1.382-1.786 Fib time levels are the most likely for a correction to end.
The 1.382 level has already passed, but 1.786 falls on Aug 15. Unless the structure develops into a complex correction (WXY or WXYXZ instead of an ABC), the correction should be complete by then. A complex correction could continue to the 2 Fib time retracement level on Aug 18.
The timeline and likely low for the correction should become clearer in the next few days after the price completes more sub-waves.
A decrease below the wave 1 high at $9,453 would invalidate this current wave count.
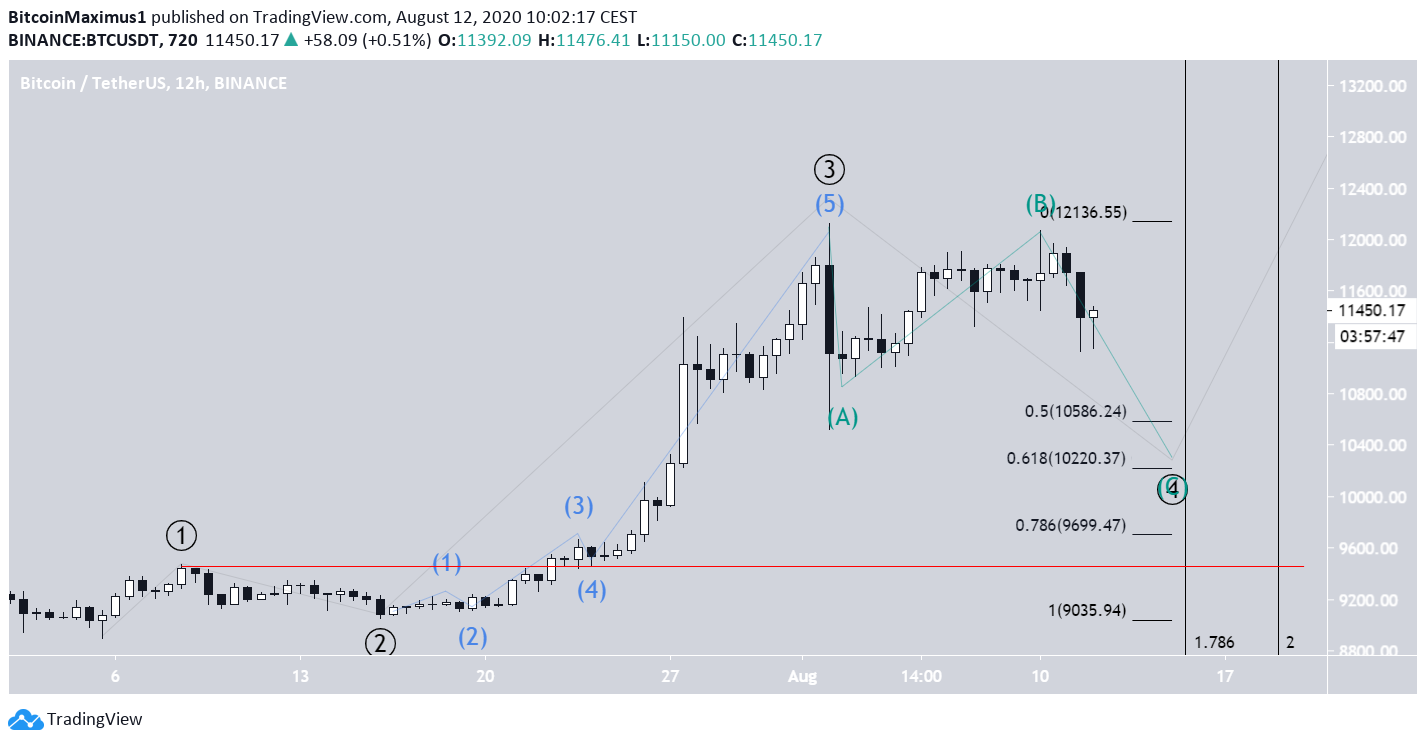
To conclude, the Bitcoin price is likely in the final wave of a correction that began on Aug 2 that could end between $10,220-$10,500.
For our previous analysis, click here.


