
Bitcoin (BTC) has been consolidating just below its all-time high price over the past week.
Bitcoin is expected to break out from the current resistance and reach a new all-time high in the process.
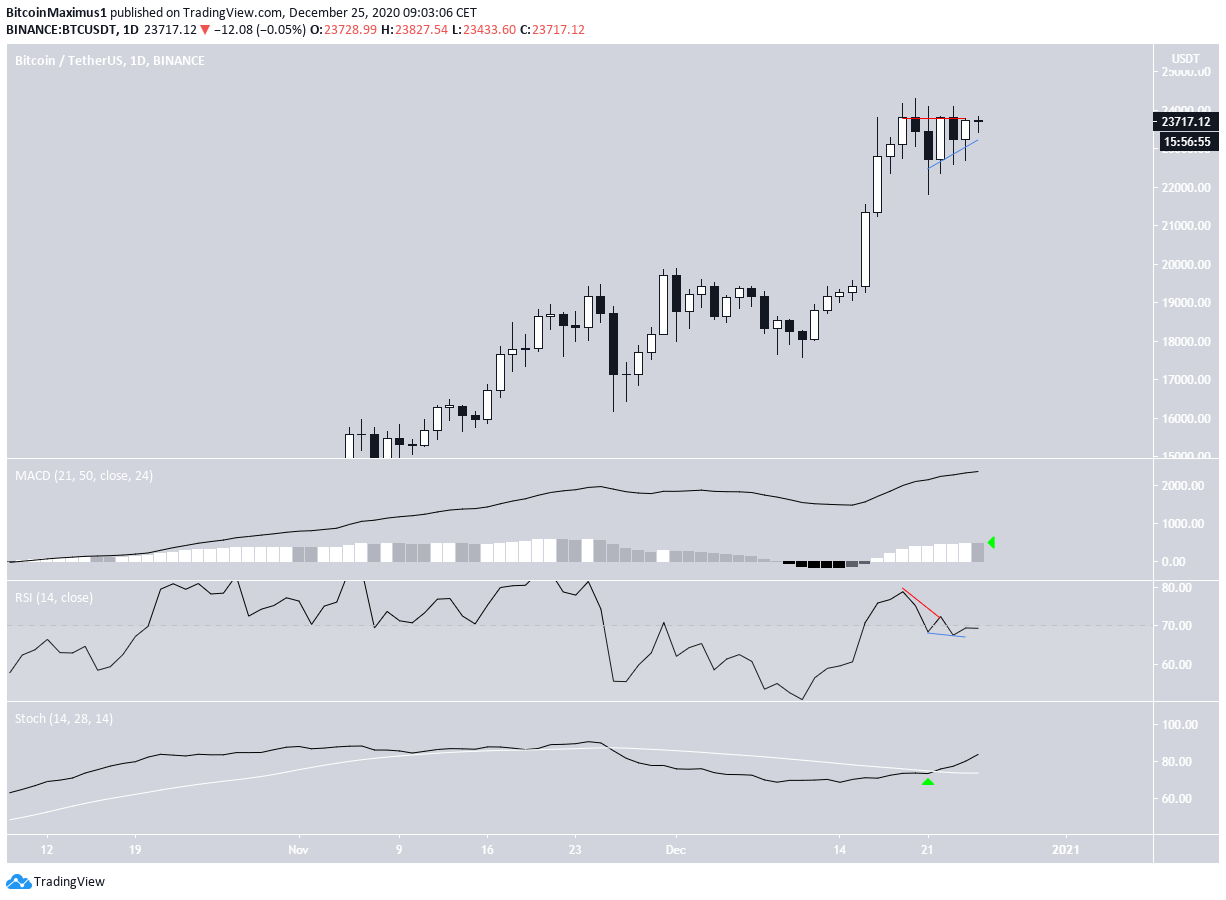
Possible Bitcoin Breakout
On Dec. 25, the BTC price continued its consolidation just below the $23,950 resistance area, creating a bullish candlestick.
While the RSI previously generated a bearish divergence (red line), it proceeded to invalidate it by generating a hidden bullish divergence after (blue line).
The Stochastic oscillator has made a bullish cross, While the MACD is in the process of generating a lower momentum bar, it has not been confirmed yet.
Therefore, technical indicators suggest that BTC is likely to break out.
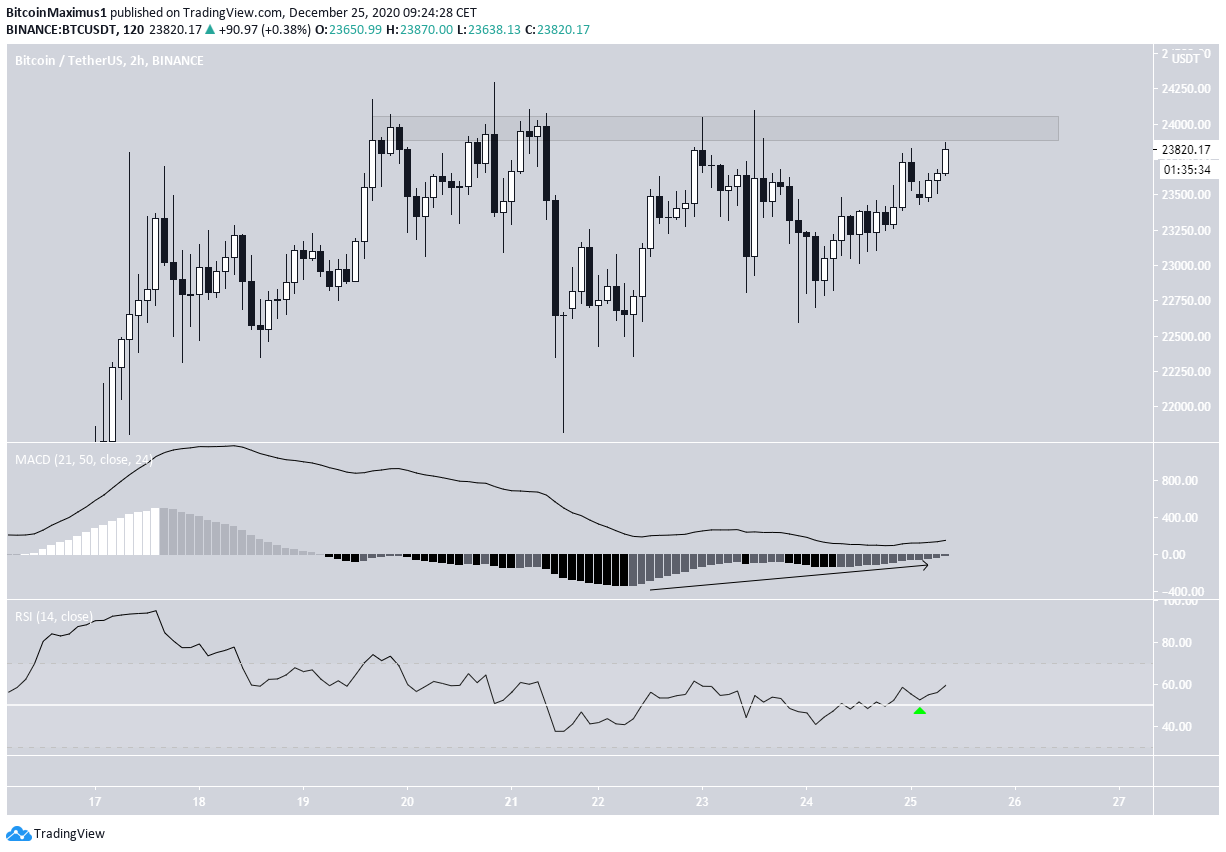
The two-hour chart also supports this possibility. While BTC is very close to resistance, both the MACD and RSI support the continuation of the upward movement and the possible breakout.
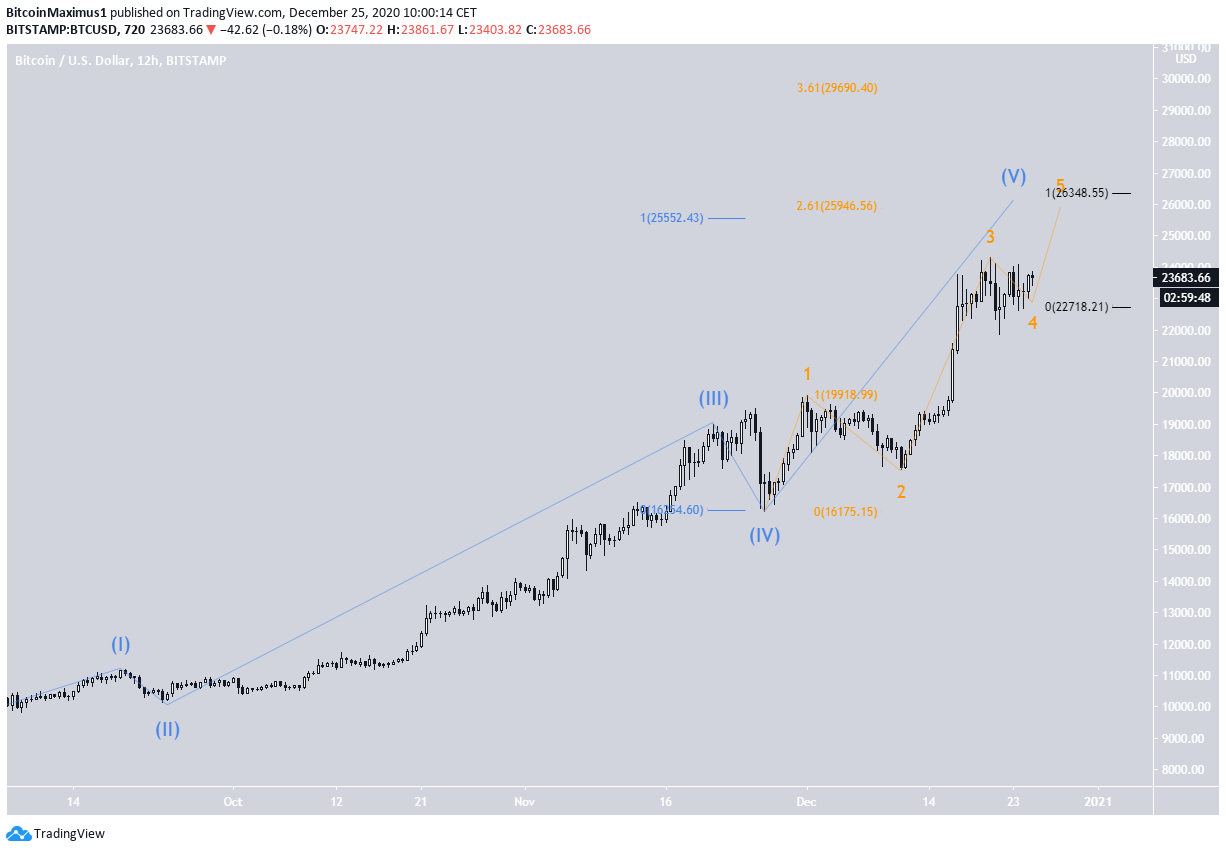
Wave Count
The wave count suggests that BTC is approaching the top of wave 5 (shown in blue below), and is currently in its fifth sub-wave (orange).
The most likely target for the top of the move is found between $25,552-$26,438. The target is found by three different Fib extensions and projections:
- Projection of the length of waves 1-3 to 4 (blue) – $25,552
- 2.61 Fib extension of sub-wave 1 (orange) – $25,946
- Projection of sub-wave 1 to 4 (black) – $26,348
Therefore, BTC is expected to reach a high inside this area.
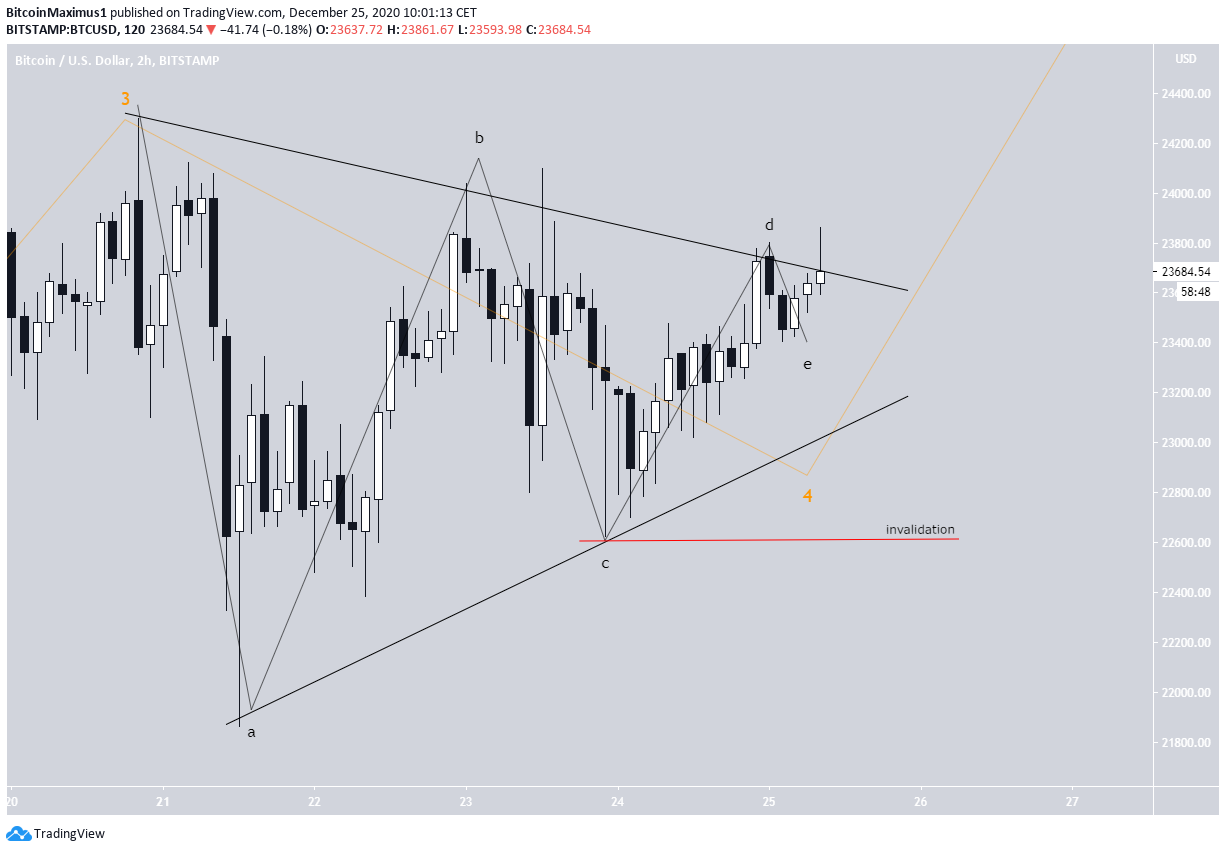
Lower time-frames show that BTC is trading inside a sub-wave 4 triangle (shown in black). A decrease below $22,624 would invalidate this scenario.
Conclusion
Bitcoin is expected to break out from its symmetrical triangle and proceed to reach a high near $26,000. A decrease below $22,624 would invalidate this scenario.
For BeInCrypto’s latest Bitcoin (BTC) analysis, click here!
Disclaimer: Cryptocurrency trading carries a high level of risk and may not be suitable for all investors. The views expressed in this article do not reflect those of BeInCrypto.
