


On July 15, the Bitcoin (BTC) price reached a daily close below the $9,250 support and the 50-day MA, both of which had been providing support up to this point.
This is a bearish sign that indicates the price will likely head lower.
Bitcoin Bearish Close
The main support area for BTC is found at $9,250. The Bitcoin price had been most recently trading above this area following a breakout on July 6. While BTC had been mostly hovering just above this level while creating numerous long lower-wicks, the price always closed inside this area and above the 50-day MA, which had also been providing support.
However, yesterday’s close was the first definitive sign that the price is likely heading lower since it fell below both the MA and the aforementioned support area. It was the lowest close since July 6. The RSI has also been rejected by the 50-line and is moving downwards—another bearish sign.
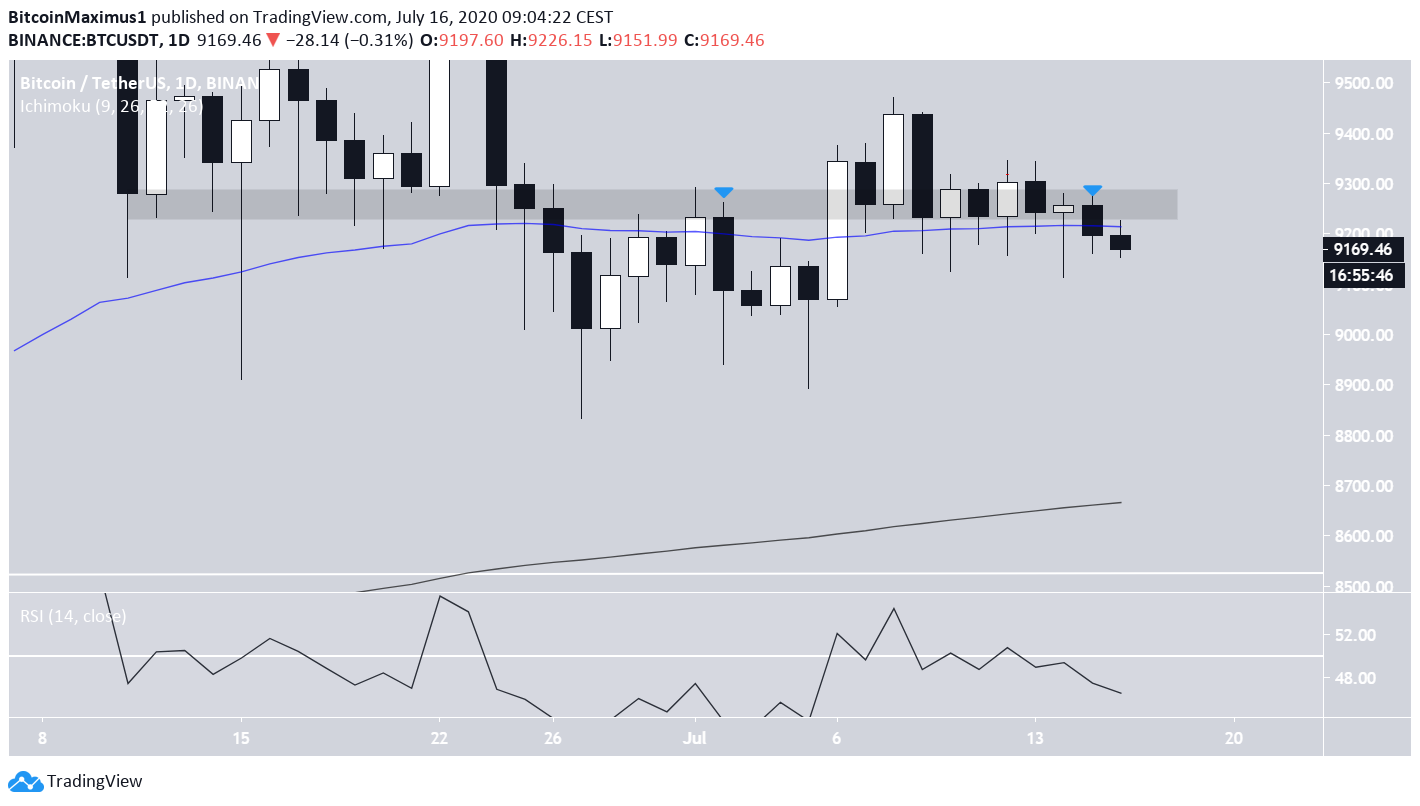
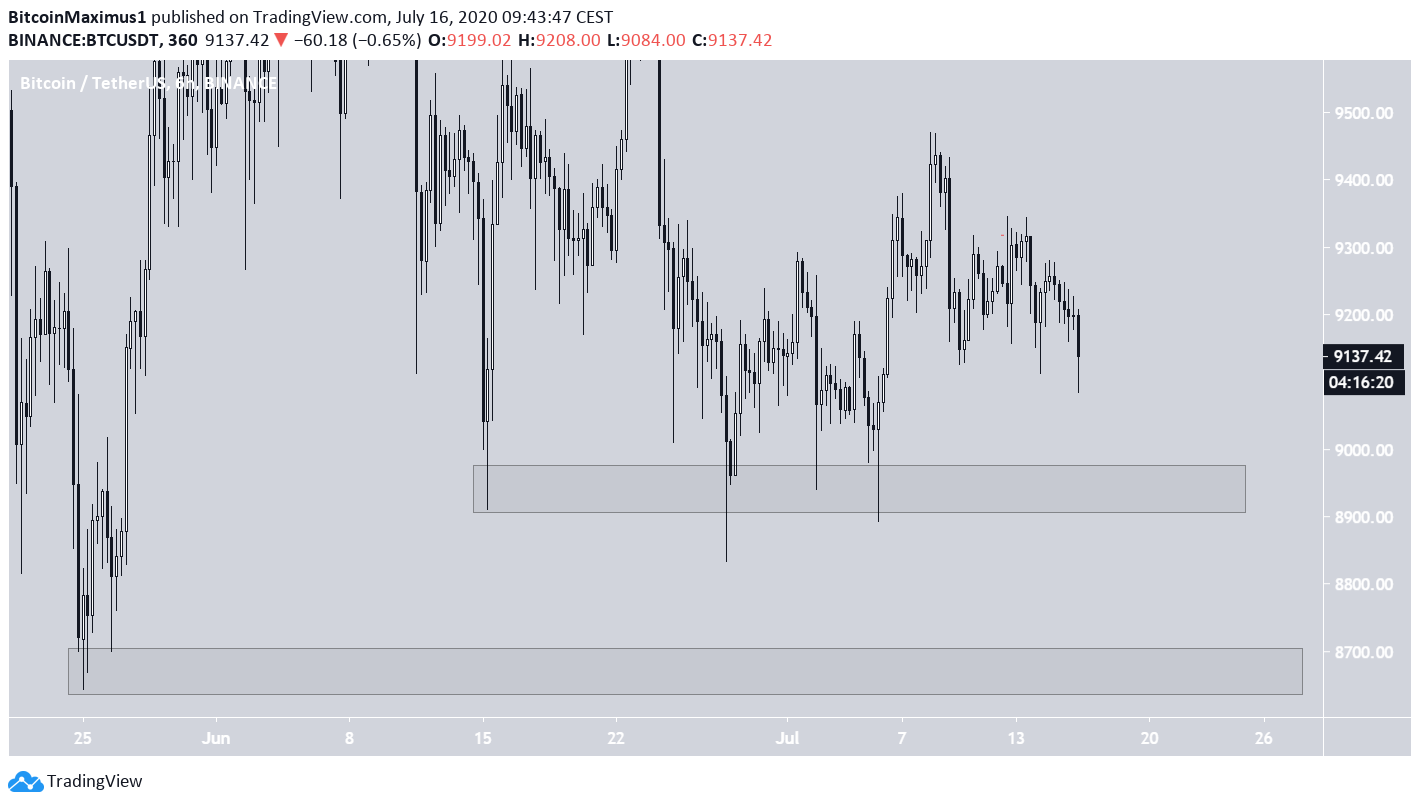
If the price continues decreasing, the first support area could be found at $8,950, created by the wick lows of June 15, 25, and July 6. However, the major support area is found at $8,650, which is the low point of the range that BTC had been trading in since May.
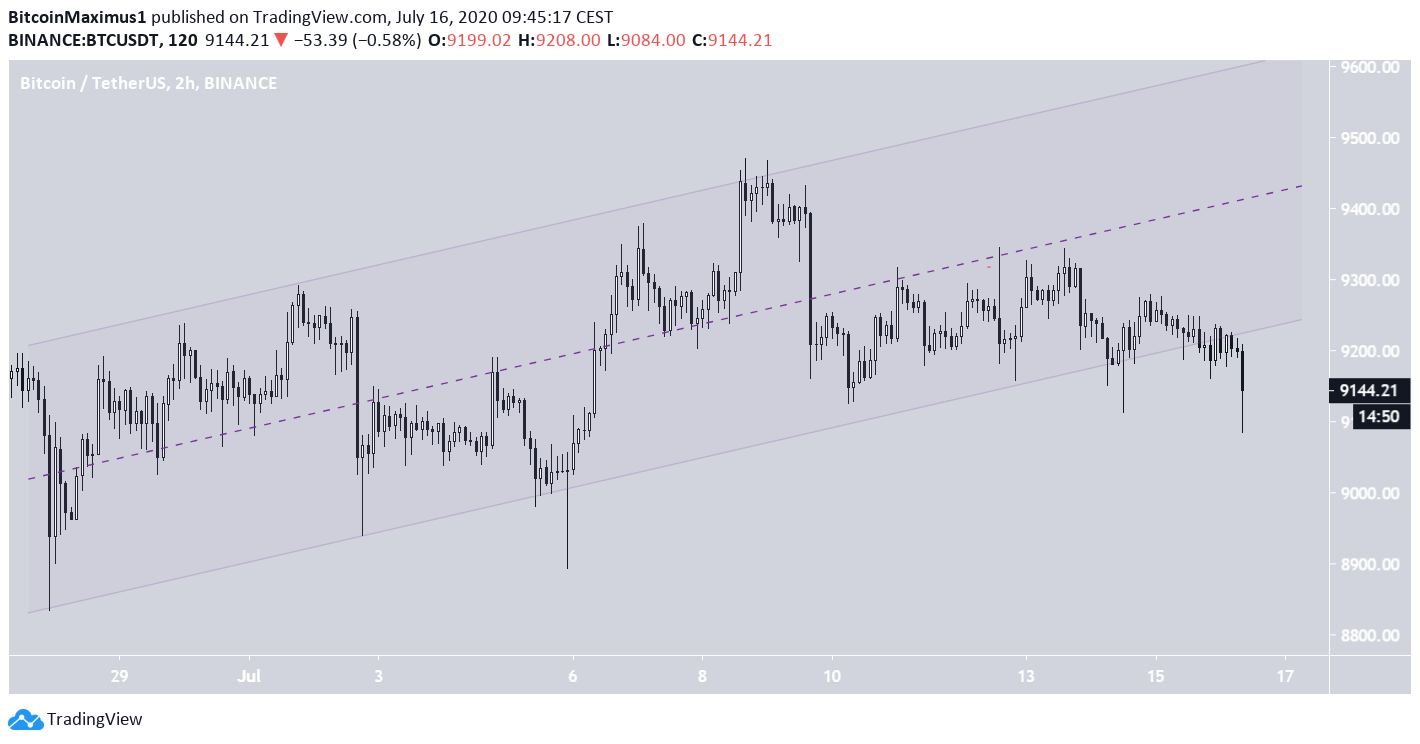
Ascending Channel
The hourly chart shows that the price had been trading inside a parallel ascending channel beginning on June 28. Since parallel channels often contain corrective movements, a breakdown from this pattern would be the most likely scenario.
While the price had been hovering around the support line of this channel over the past three days, it has decisively broken down from it, confirming the findings from the daily chart.
As for the wave count, this seems to be the C wave of an A-B-C formation, which is transpiring in an impulsive five-wave pattern to the downside. If the C wave has the same length as wave A, the price could reach a bottom near $8,500.
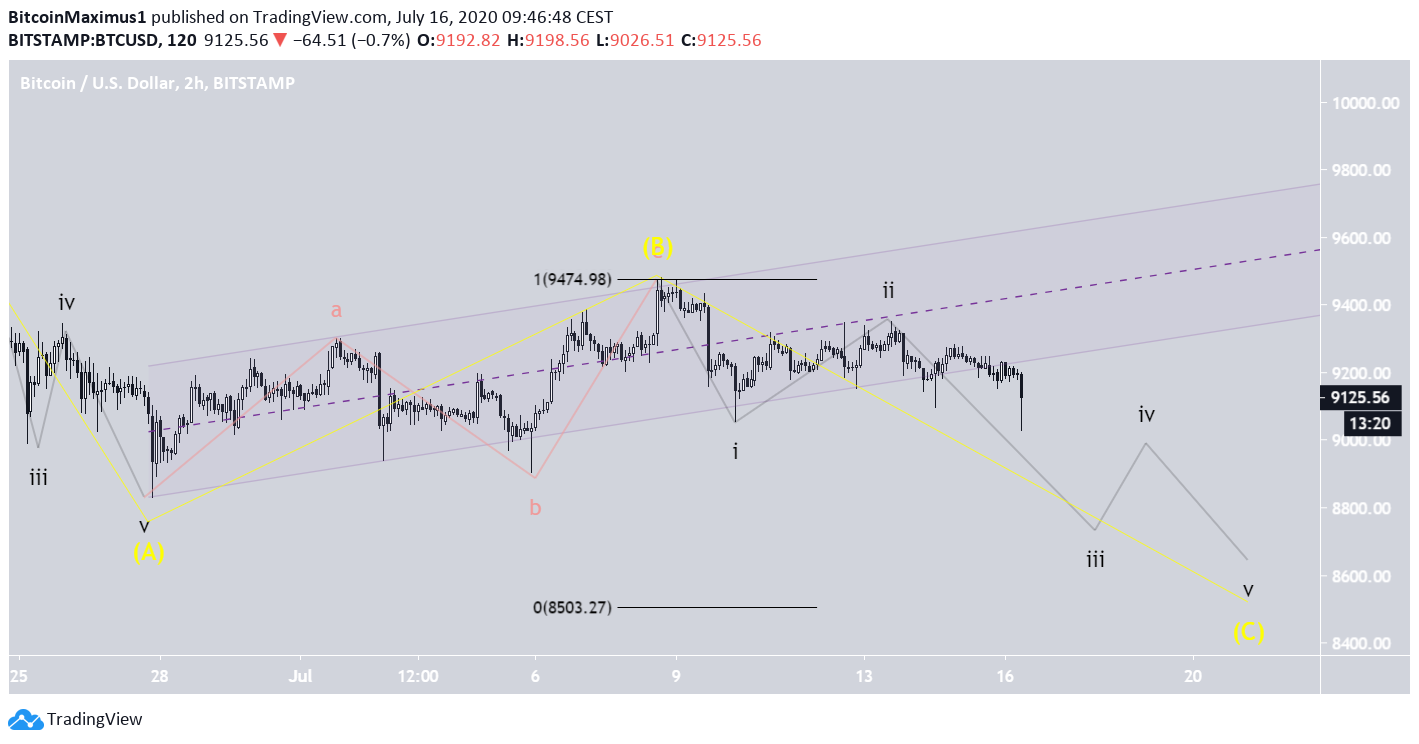
To conclude, the Bitcoin price has broken down from an ascending channel and began an impulsive downward movement. The price is expected to decrease until it reaches at least one of the support areas outlined above.
For our previous analysis, click here.


