


Bitcoin (BTC) has been increasing since it reached a low of $9,825 on Sept 5.
The rally does not appear to be very convincing though and suggests that another drop below the aforementioned low is likely to transpire.
Bitcoin Rally Shows Weakness
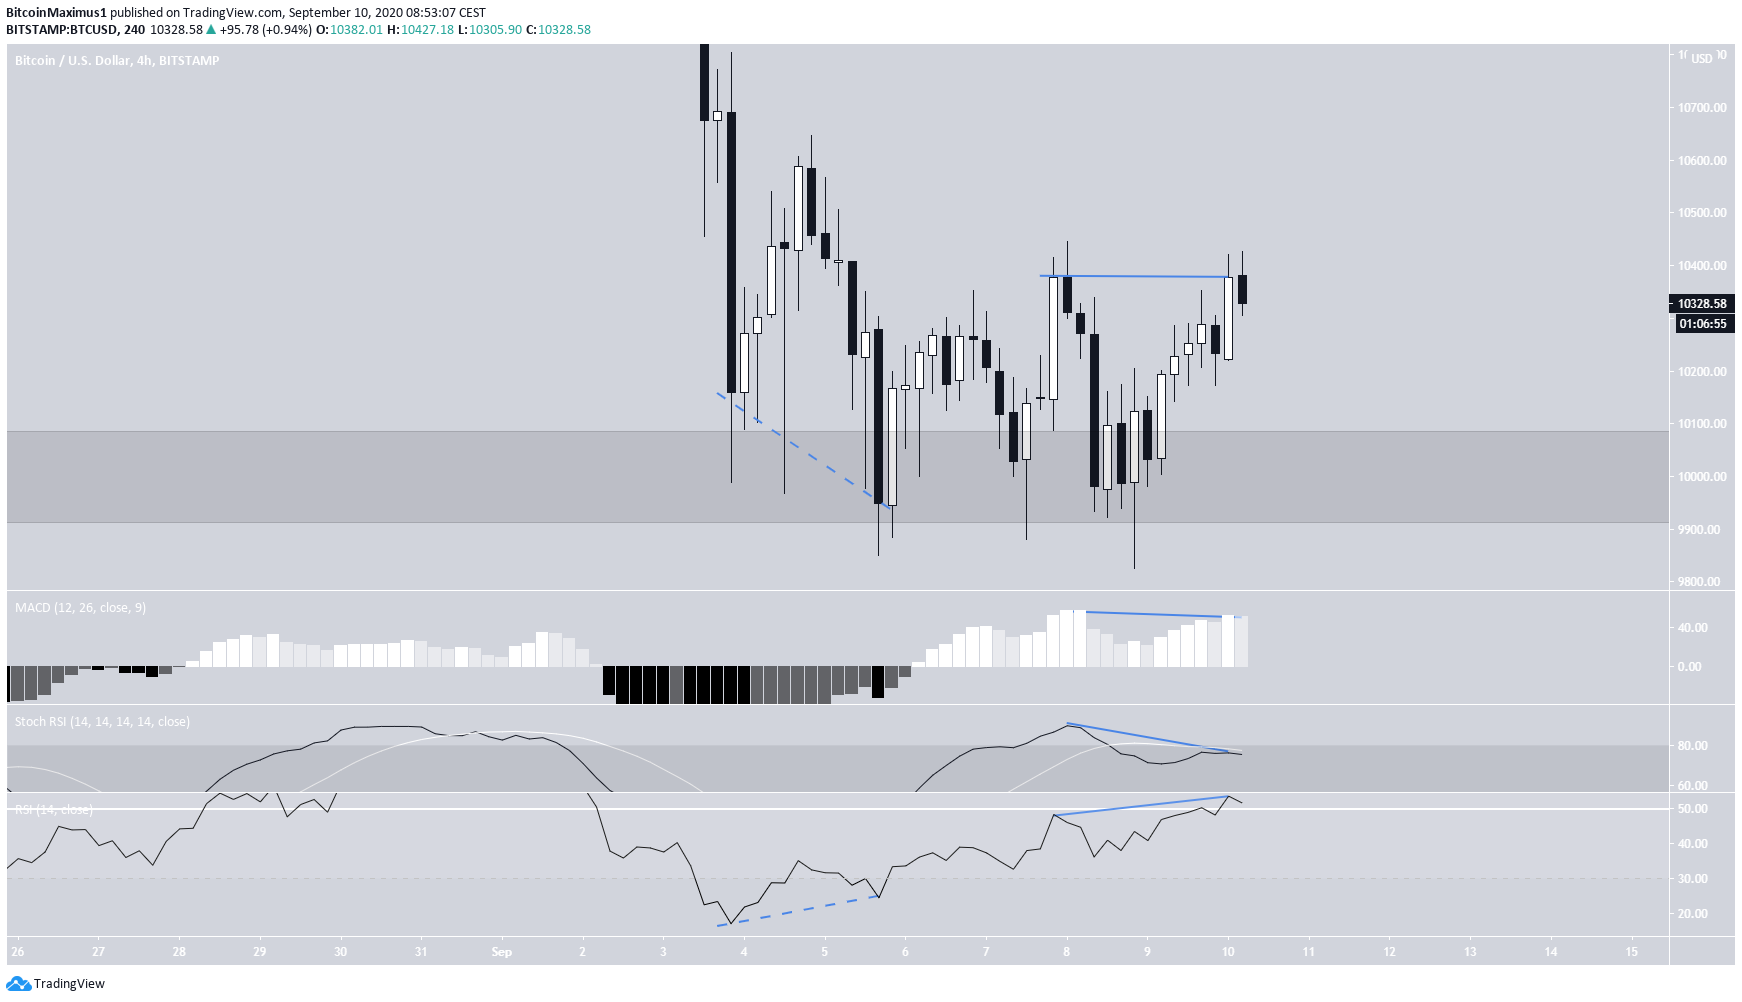
The Bitcoin price has been increasing since a low of $9,825 on Sept 5. This move to the upside was preceded by a considerable bullish divergence in the RSI in time-frames up to the six-hour.
However, while the price is currently trading at $10,300, the rally is showing weakness.
There is a bearish divergence in the MACD, RSI, and stochastic RSI, and the latter has made a bearish cross. This is a sign that the rally is expected to end and the price will soon head downwards.
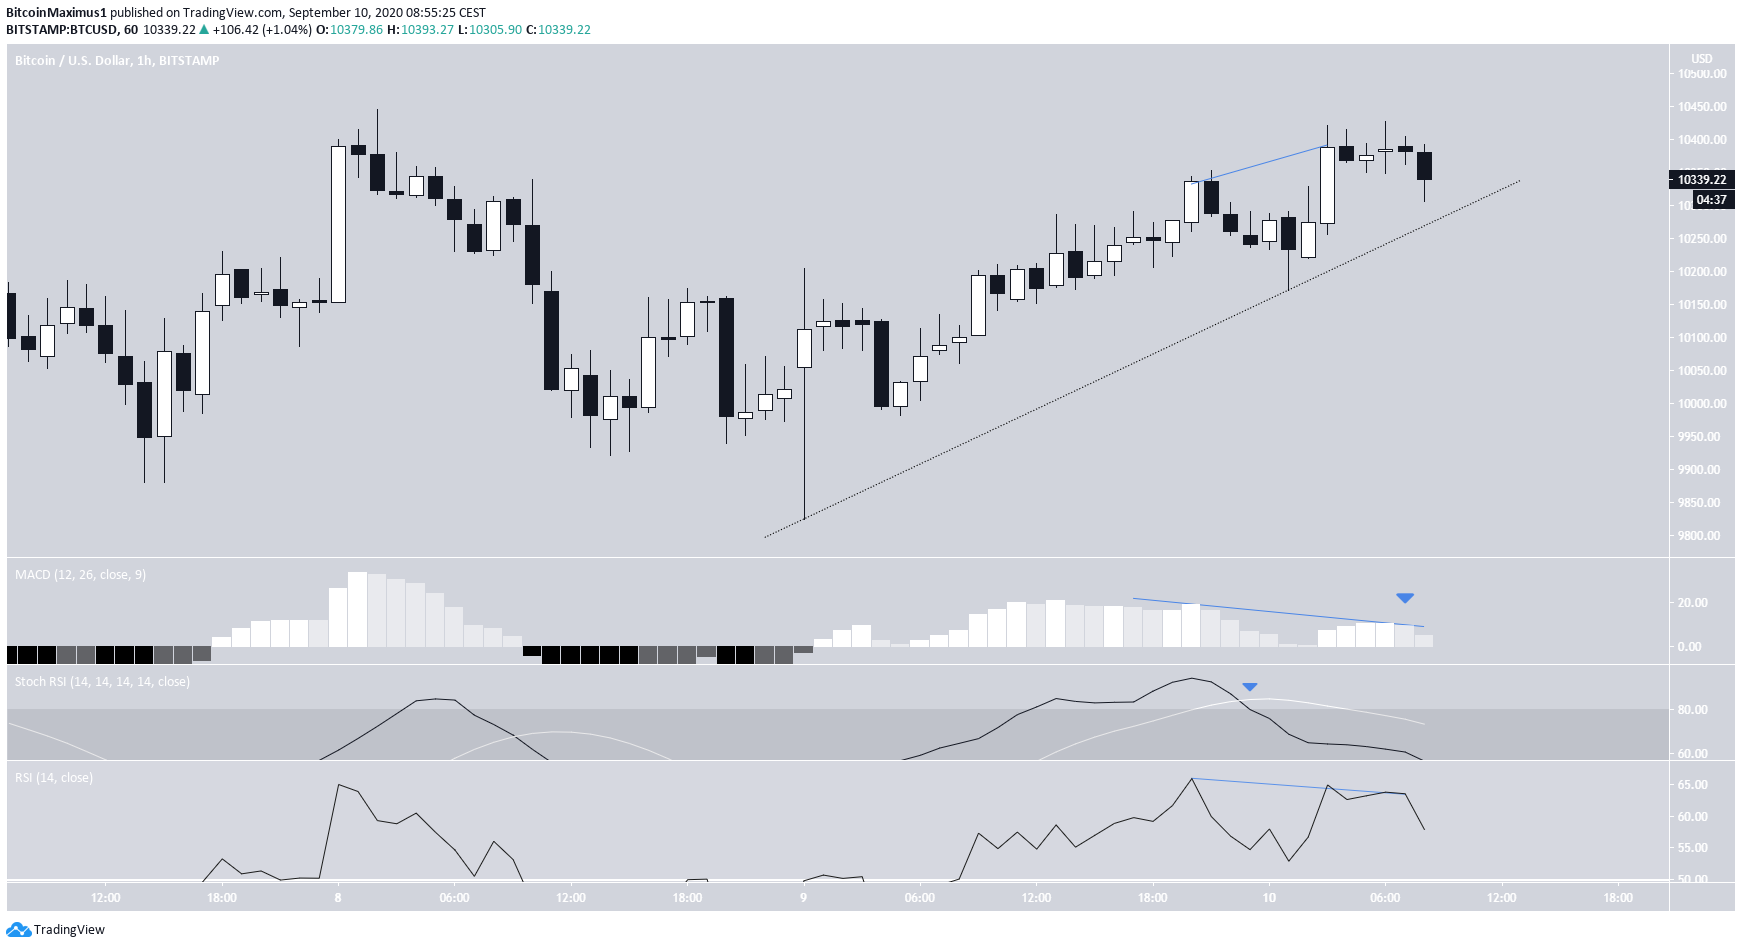
The hourly chart gives a similar outlook, since there is an even more pronounced divergence in all three indicators, and the RSI and MACD are decreasing considerably.
If the price breaks down from the current short-term ascending support line, it would likely confirm that the price is heading lower.
BTC Wave Counts
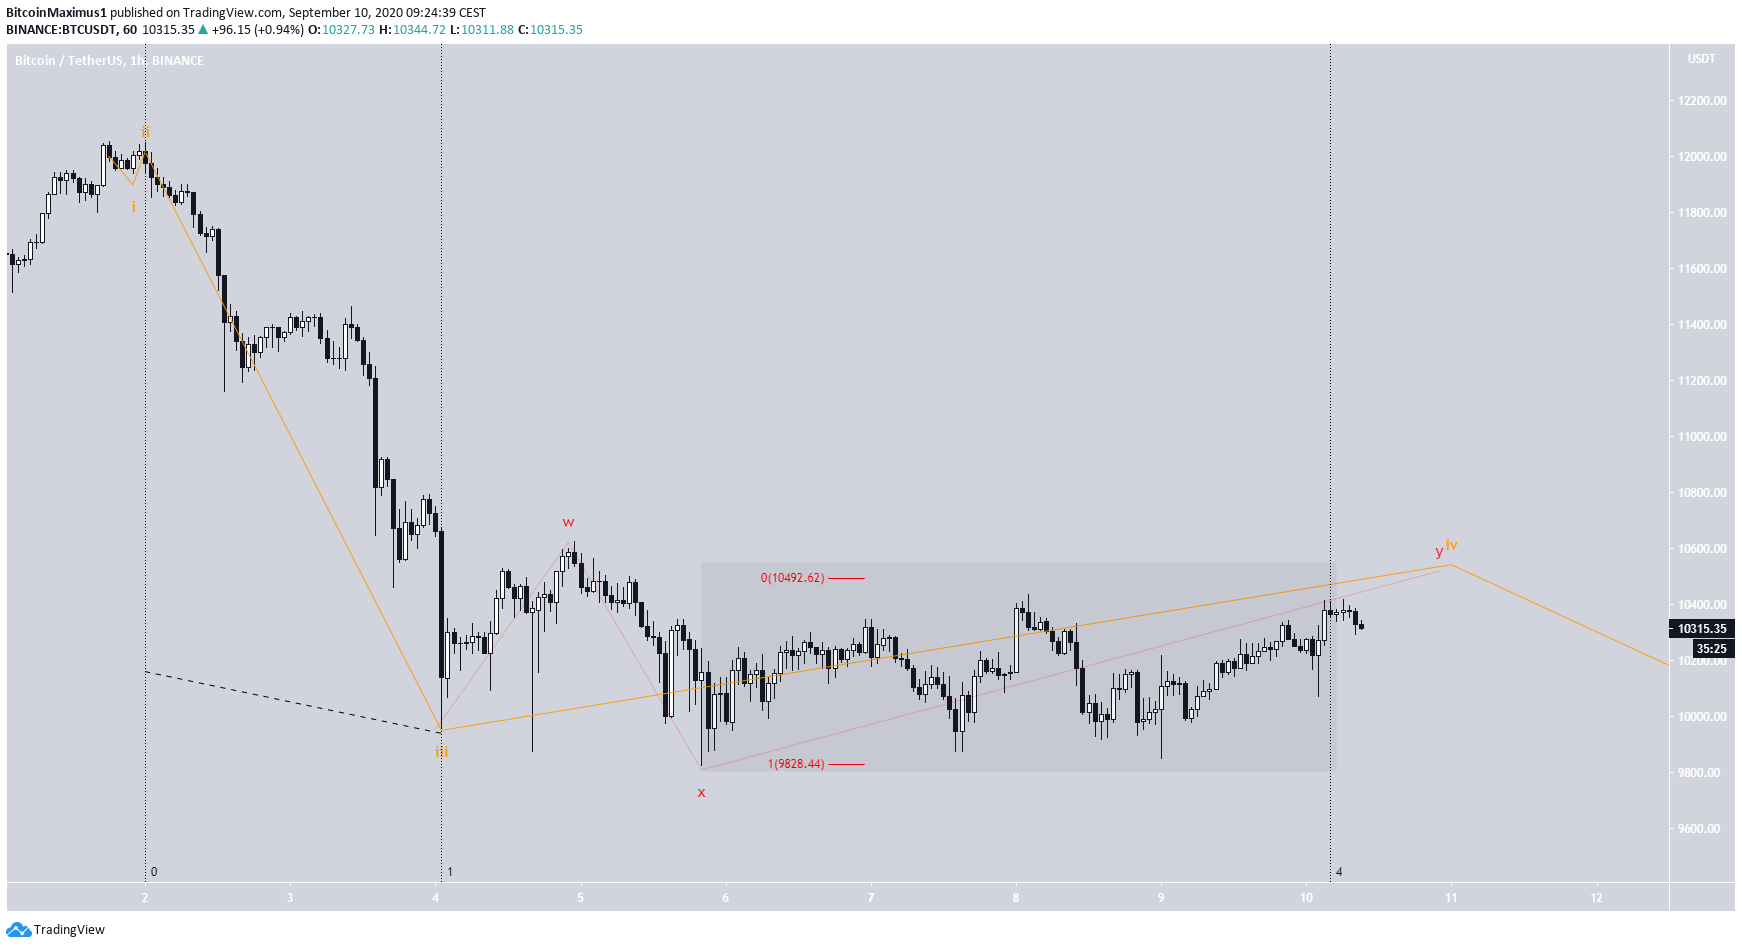
The most likely wave count is that BTC began a bearish impulsive five-wave formation on Sept 2, and is currently in wave 4 (in orange below).
Due to the time of wave 4 relative to the preceding wave 3, it is likely that the price is correcting in a complex W-X-Y structure (in red). The target for this wave to end would be near $10,490, based on the length of wave X.
A closer look at wave Y gives a very similar target, indicating that the price will soon reach a top. A breakdown from the ascending support line outlined in the first section would confirm that the price has begun its downward movement.
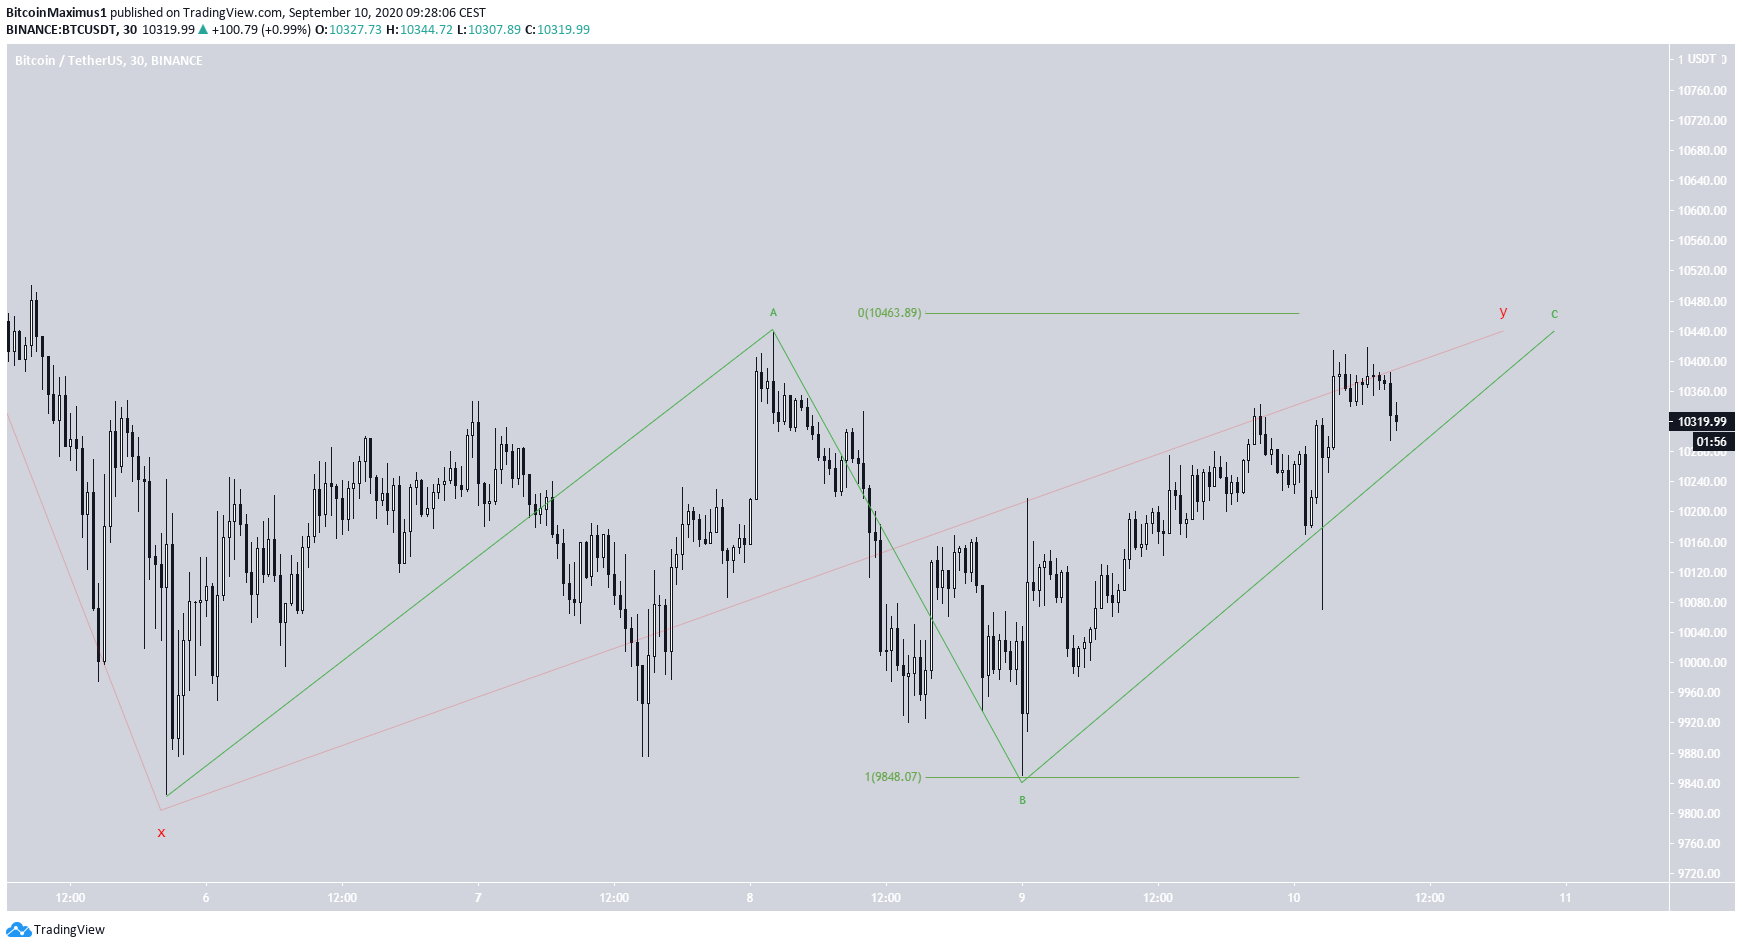
To conclude, the Bitcoin price is expected to increase towards $10,500 before breaking down to the $9,500 region.
For BeInCrypto’s previous Bitcoin analysis, click here!


