
After a decisive move in any direction, the price of an asset either creates a continuation or a reversal pattern. As stated by the name, a continuation pattern leads to a movement in the same direction as the prior trend, while a reversal pattern does the opposite.
Neutral patterns, such as symmetrical triangles are usually considered continuation patterns.
On October 7, the Bitcoin price made a rapid upward move from $7700 to $8300.
On October 9, cryptocurrency analyst @D4rkEnergYYY identified a bull flag in the BTC price, which is a bullish pattern.
https://twitter.com/D4rkEnergYYY/status/1181673925983510529?s=09
Furthermore, since this pattern followed the upward move from October 7, it is very likely to act as a continuation pattern.
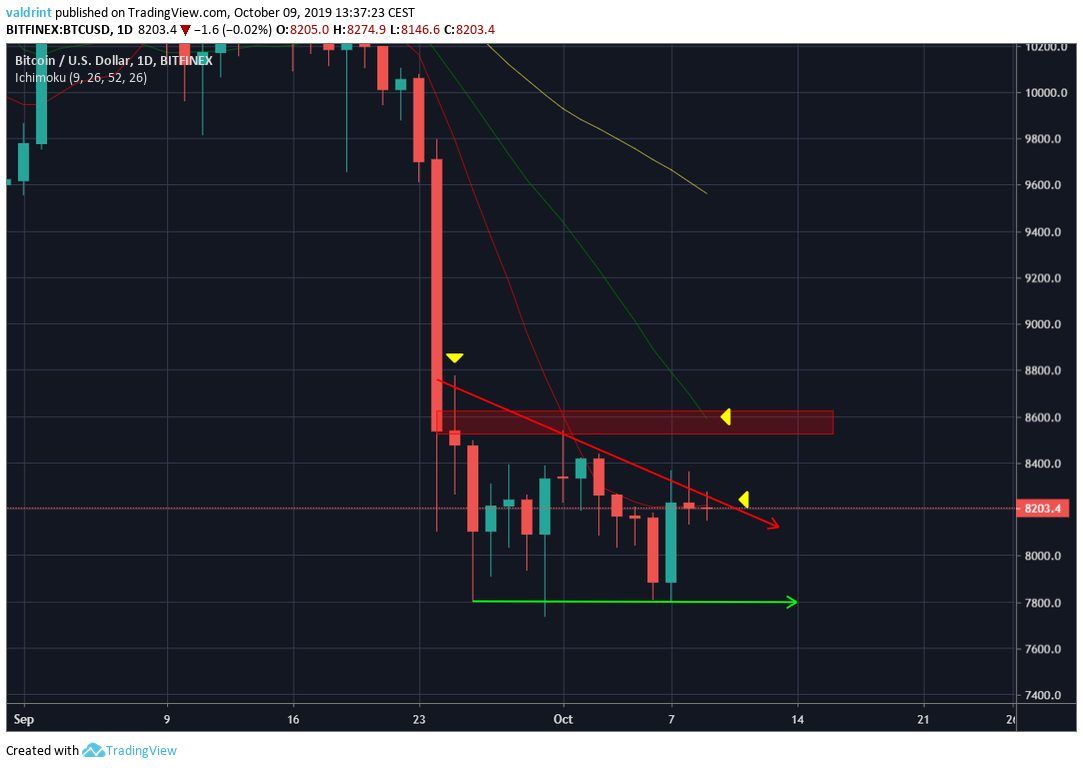
The potential target following a breakout from this move is found at $8600.
Let’s analyze the possibility of the price getting there.
Pattern Within a Pattern
Since the tweet was made, the price indeed broke out from the bull flag, reaching a high of $8274 before decreasing slightly.
The breakout transpired with very low volume, reducing its significance.
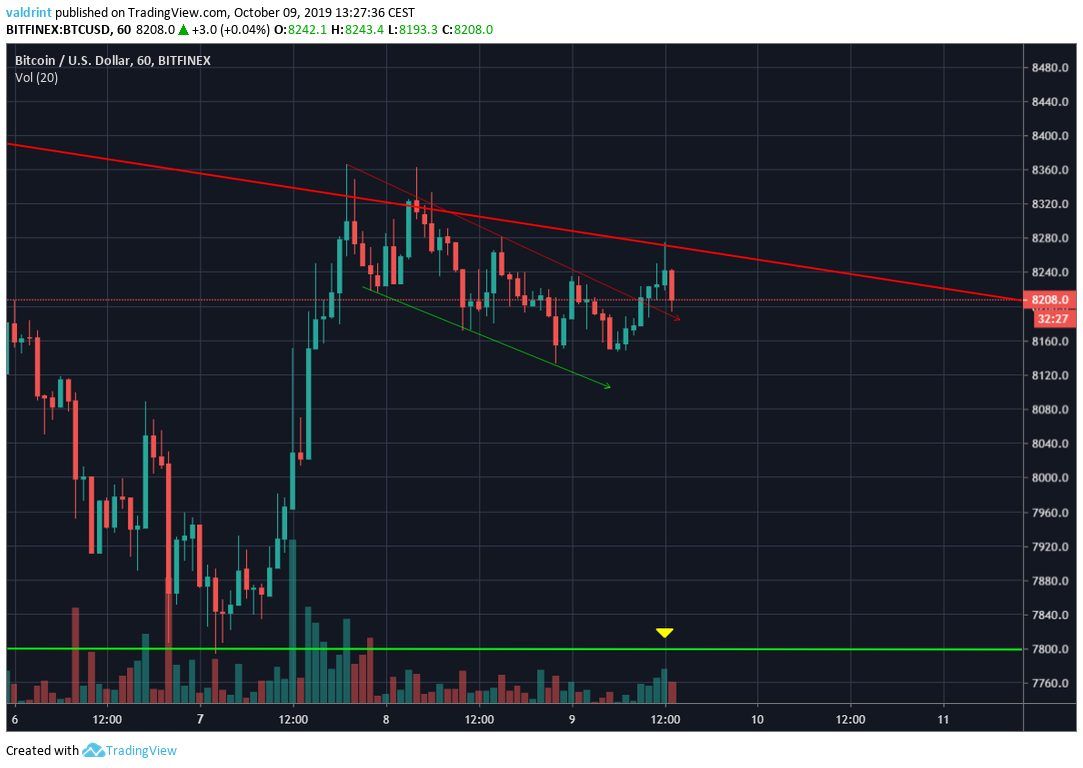
The upward movement stopped as soon as the price reached the descending resistance line of the longer-term triangle.
At the current time, the price has decreased and touched the previous resistance line.
In order to understand this movement, it is vital to analyze the descending triangle, which has been in place since September 24.
The descending triangle is a bearish pattern which created following a rapid downward movement.
Therefore, it would be customary for the price to eventually break down from it.
While this directly contradicts the bull flag breakout, I believe this movement is very plausible.
The reasoning behind it is that the triangle is a much longer-term pattern that followed a downtrend of several months.
The long-term pattern always takes priority over the short-term one, which in this case is the bull flag following a daily increase.
Additionally, this view is strengthened by the fact that the breakout ended once the price reached the resistance line of the triangle.
This further validated its significance.
Finally, the 10-day MA is offering close resistance to the price, confiding with the descending resistance line.
Therefore, while the price broke out from the bull flag, we do not believe it is likely to reach the resistance area of $8600.
Do you think the Bitcoin price will break out above the descending triangle? If it does, how high do you think it will go? Let us know in the comments below.
Disclaimer: This article is not trading advice and should not be construed as such. Always consult a trained financial professional before investing in cryptocurrencies, as the market is particularly volatile.
Images are courtesy of Shutterstock, TradingView.
