
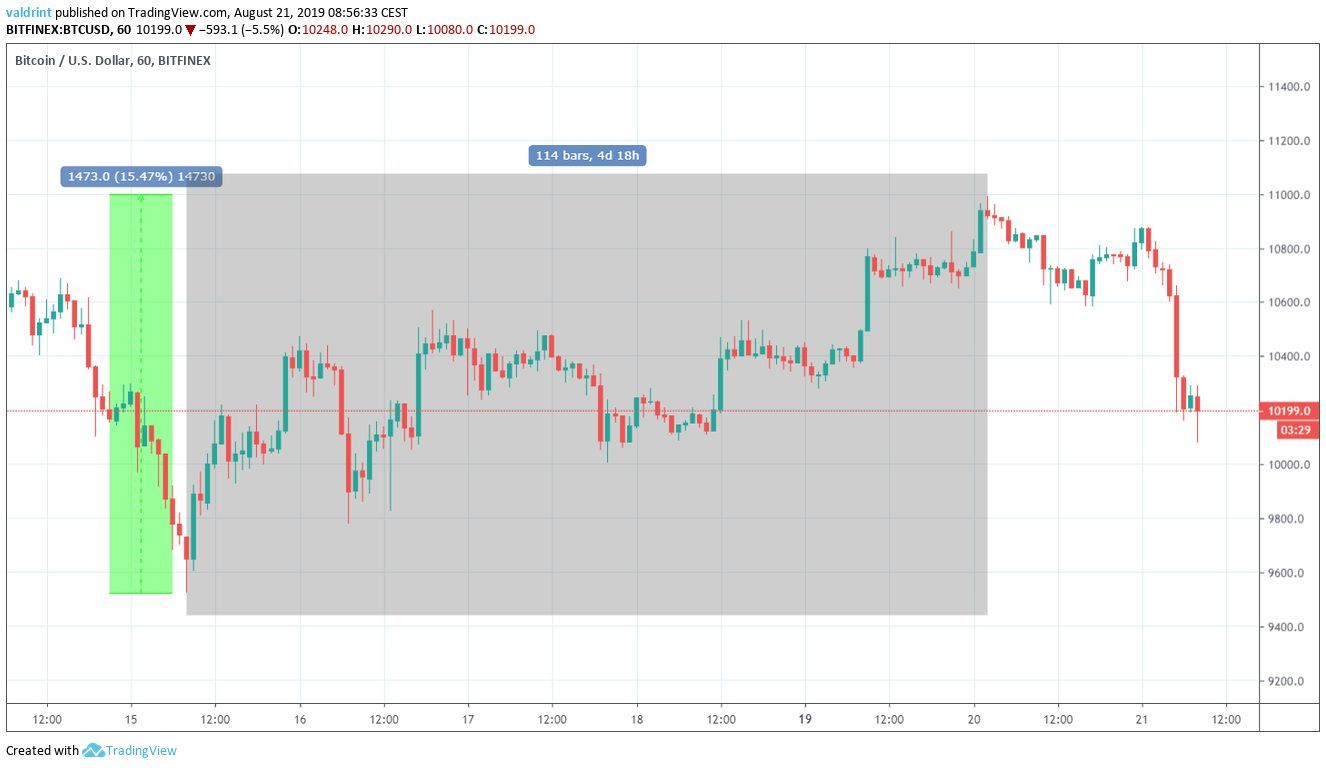
On August 15, 2019, the Bitcoin price reached a low of $9522. A gradual upward move ensued. On August 20, it reached a high of $10,993 — an increase of roughly 15 percent in slightly less than five days. It has been decreasing since.
How long will the decrease continue for the Bitcoin price? Continue reading if you are interested in finding out.
For our previous analysis, click here.
For those of you that are more interested in a video analysis, please click below:
https://www.youtube.com/watch?v=OCUMD7NWEtM
If you are interested in trading Bitcoin (BTC) and other cryptocurrencies with a multiplier of up to 100x on our new partner exchange with the lowest fees, follow this link to get a free StormGain account!

Bitcoin Price: Trends and Highlights for August 21
- BTC/USD broke down from an ascending channel.
- It is trading inside a long-term descending triangle.
- There is minor support at $10,100 and major support at $9600.
- The 10- and 20-day moving averages rejected a bullish cross.
Previous BTC Price Movement
A look at the hourly time-frame shows that the Bitcoin price just broke down from the ascending channel it had been trading in since August 15.
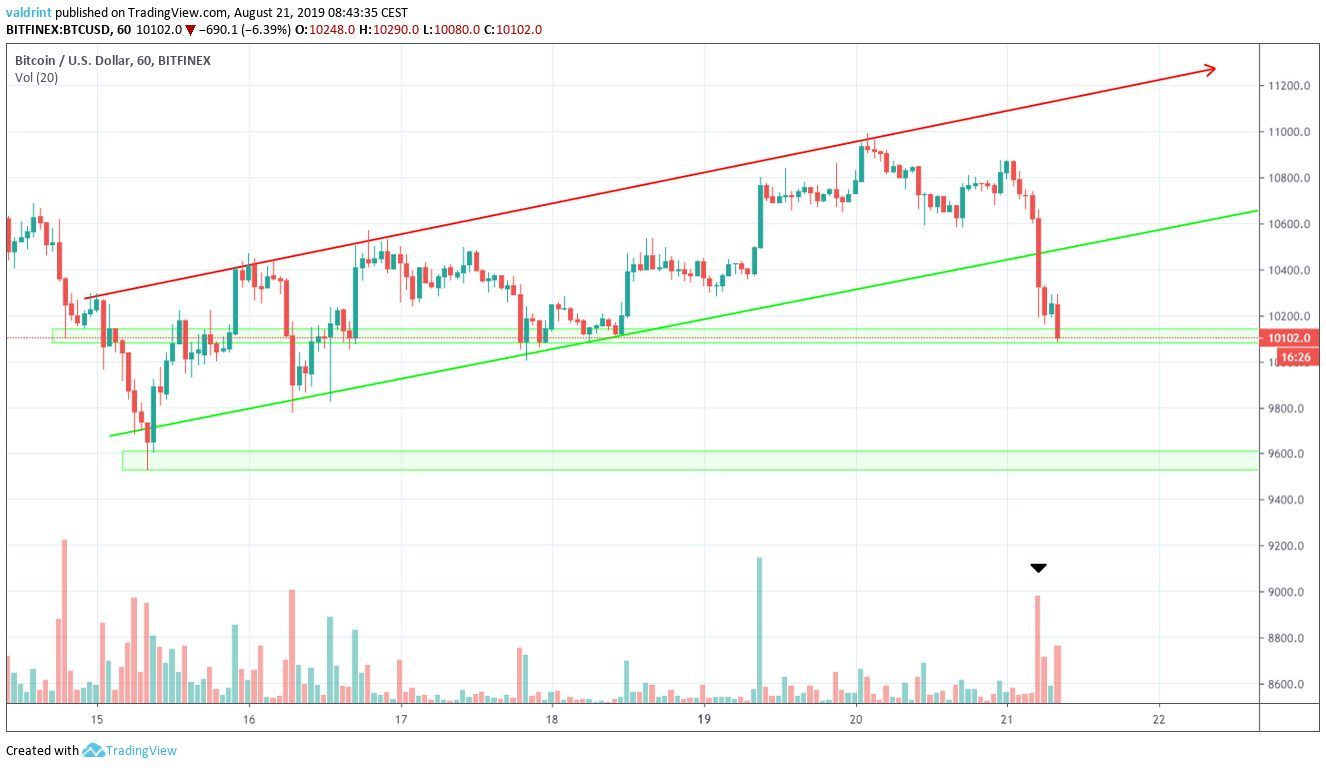
The breakdown occurred with significant volume.
Additionally, we can see two support areas, one minor at $10,100 and one major at $9600.
A drop to the second area would create a double bottom, which is considered a bullish reversal pattern.
Will the BTC price get there?
Descending Triangle
A look at the daily time-frame shows that the Bitcoin has been trading inside a descending triangle since June 26.
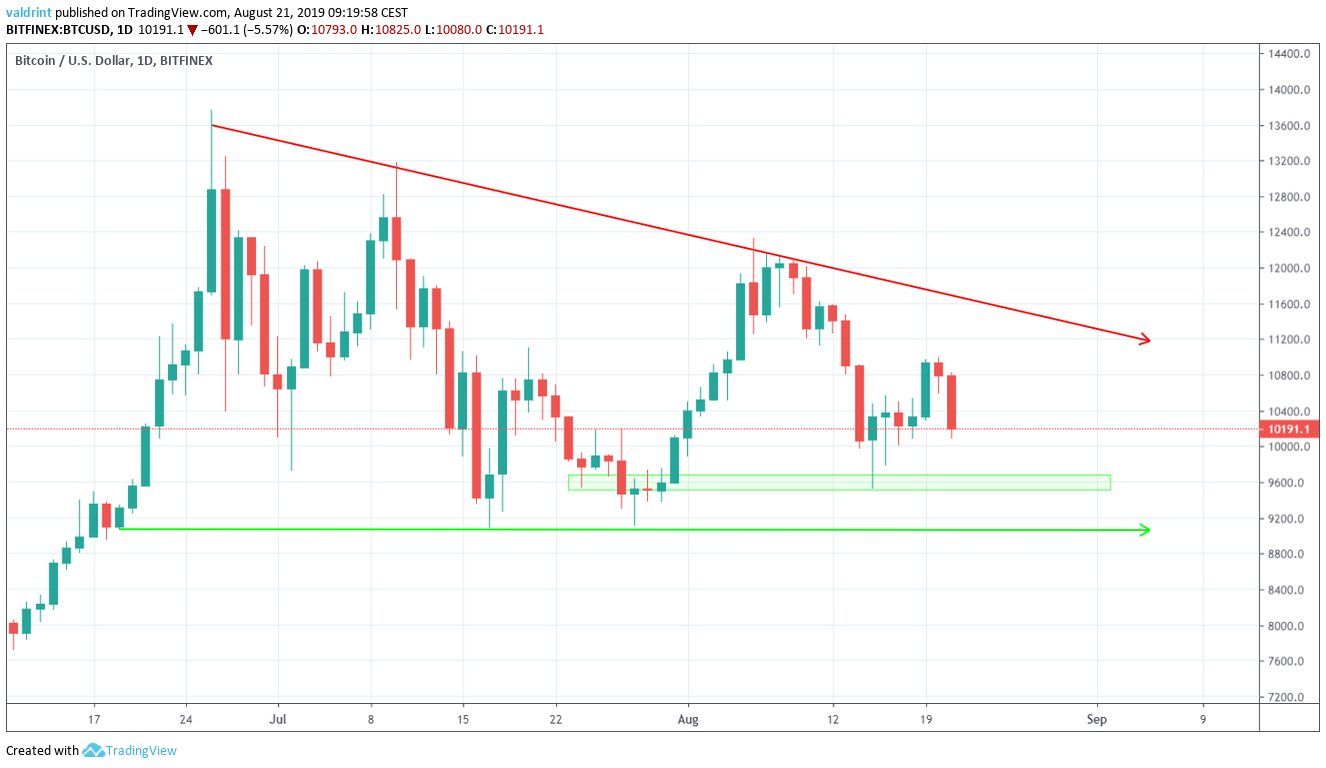
The horizontal support line of the triangle is at $9100.
The current daily candle is shaping up to be bearish engulfing, breaking down below the opening price of the previous bullish candles.
A look at the moving averages (MA) also gives a bearish outlook.
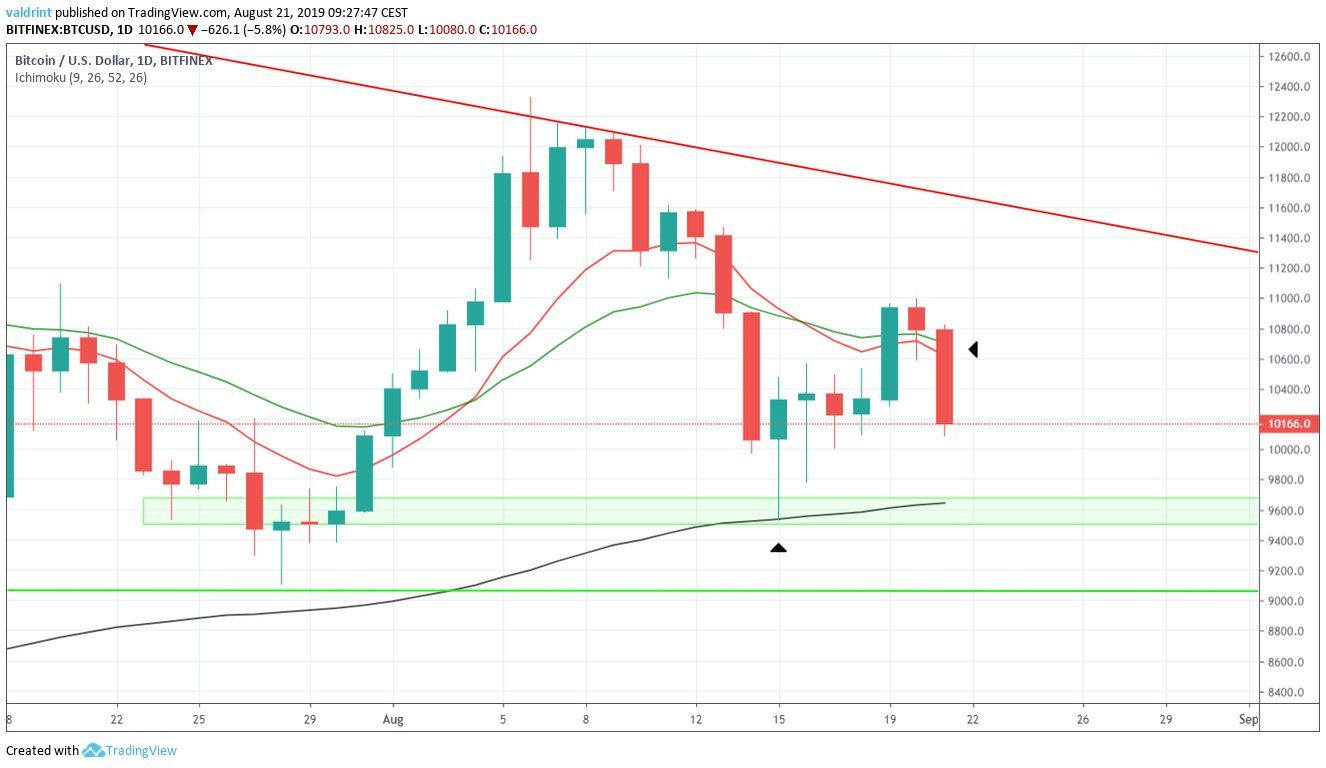
The 10- and 20-day MAs have just rejected a bullish cross, and are both moving downward, providing resistance to the price.
An interesting observation is that the 100-day MA is inside the support area at $9600.
On August 15, the Bitcoin price bounced right on the MA — validating it as significant support.
We believe that BTC is likely to do so again.
However, due to the strength of the current decrease and overall bearish sentiment, the ensuing upward move might not be of a large magnitude.
Bitcoin Price Prediction
The BTC price recently broke down from an ascending channel.
According to our analysis, it is likely to eventually drop to $9600.
For trading purposes, a possible retracement towards $10,500 would offer shorting opportunities. However, we do not believe that is likely to occur
On the other hand, the $9600 support area is a suitable level for the initiation of long scalps.
Do you think the Bitcoin price will reach the support area? Let us know in the comments below.

Disclaimer: This article is not trading advice and should not be construed as such. Always consult a trained financial professional before investing in cryptocurrencies, as the market is particularly volatile.
Images are courtesy of Shutterstock, TradingView.
