


The price of Bitcoin (BTC) is trading between key resistance and support levels at $31,000 and $28,000, respectively. Whichever breaks first could determine the future trend’s direction.
The weekly and daily timeframe readings are both uncertain, failing to confirm if a breakout or breakdown is more likely.
Bitcoin Price Approaches Key Level
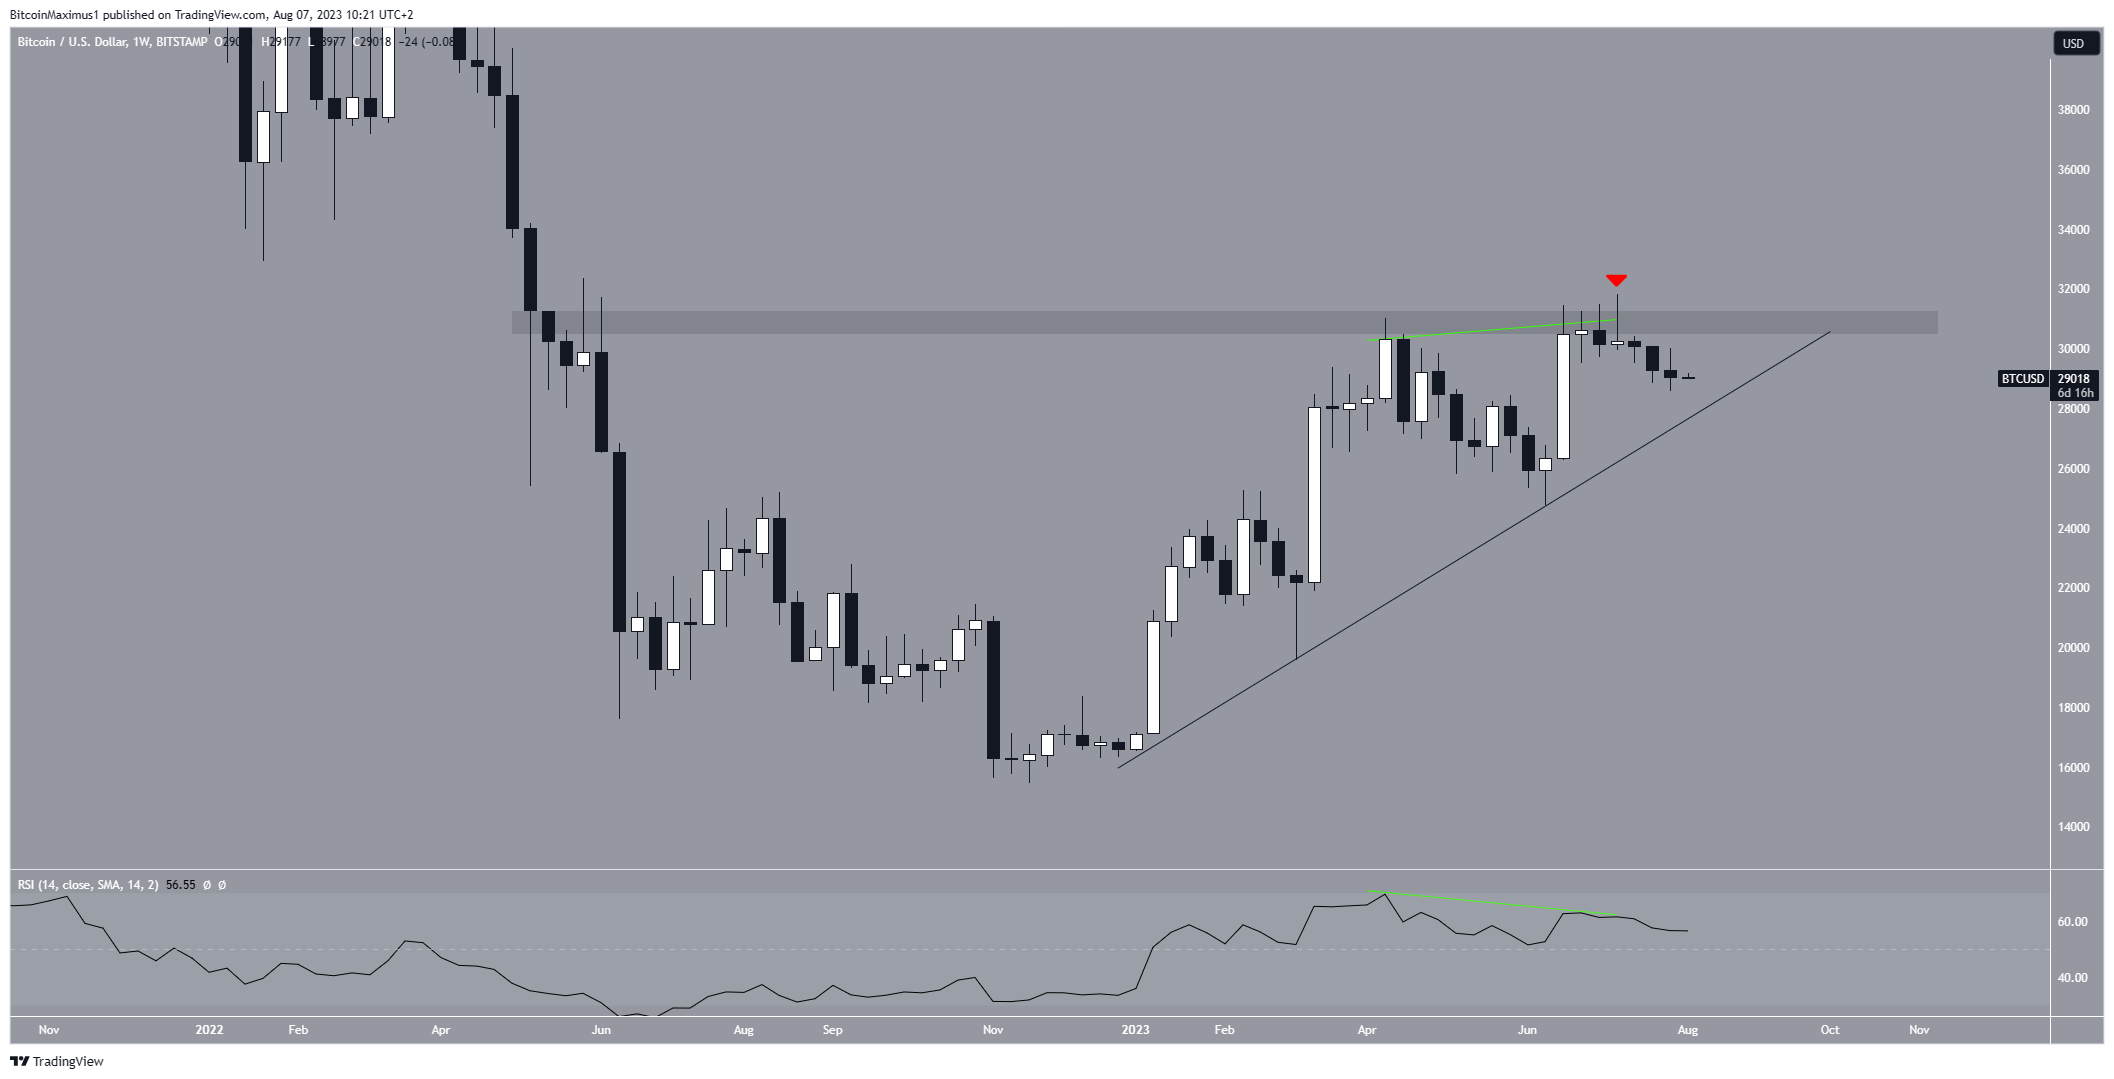
The technical analysis from the weekly timeframe provides mixed readings for BTC. On the bullish side, the price has increased alongside an ascending support line since the beginning of the year.
During this time, it has created two lower highs (green icons), which had long lower wicks and validated the ascending support line. These are both considered strong bullish signs. The support line is currently at $28,000.
Decode tomorrow’s crypto prices today:
However, the price also created a bearish candlestick with a long upper wick (red icon) in July. This validated the $31,000 horizontal area as resistance.
Moreover, the weekly RSI generated a significant bearish divergence (green line) during this high. The divergence is a bearish sign that is created when a momentum decrease accompanies a price increase. It often leads to downward movements.
The RSI is a momentum indicator traders use to assess market conditions and the sentiment surrounding an asset, indicating whether it’s overbought or oversold.
Typically, an RSI reading above 50, along with an upward trend, suggests that buyers have an advantage. On the other hand, a reading below 50 indicates the opposite. Currently, the RSI is in a declining trend and headed below 50, both of which are signs of a bearish trend. Since the RSI is still not below 50, it has not confirmed that the trend is bearish yet.
It is worth mentioning that Miami Mayor Francis Suarez announced that he is accepting BTC as a donation for his 2024 presidential campaign. This aligns with his vision of Miami as a crypto capital.
Unveil your crypto’s future! Predict now: Bitcoin (BTC) Price Prediction
BTC Price Prediction: Will Breakout or Breakdown Occur?
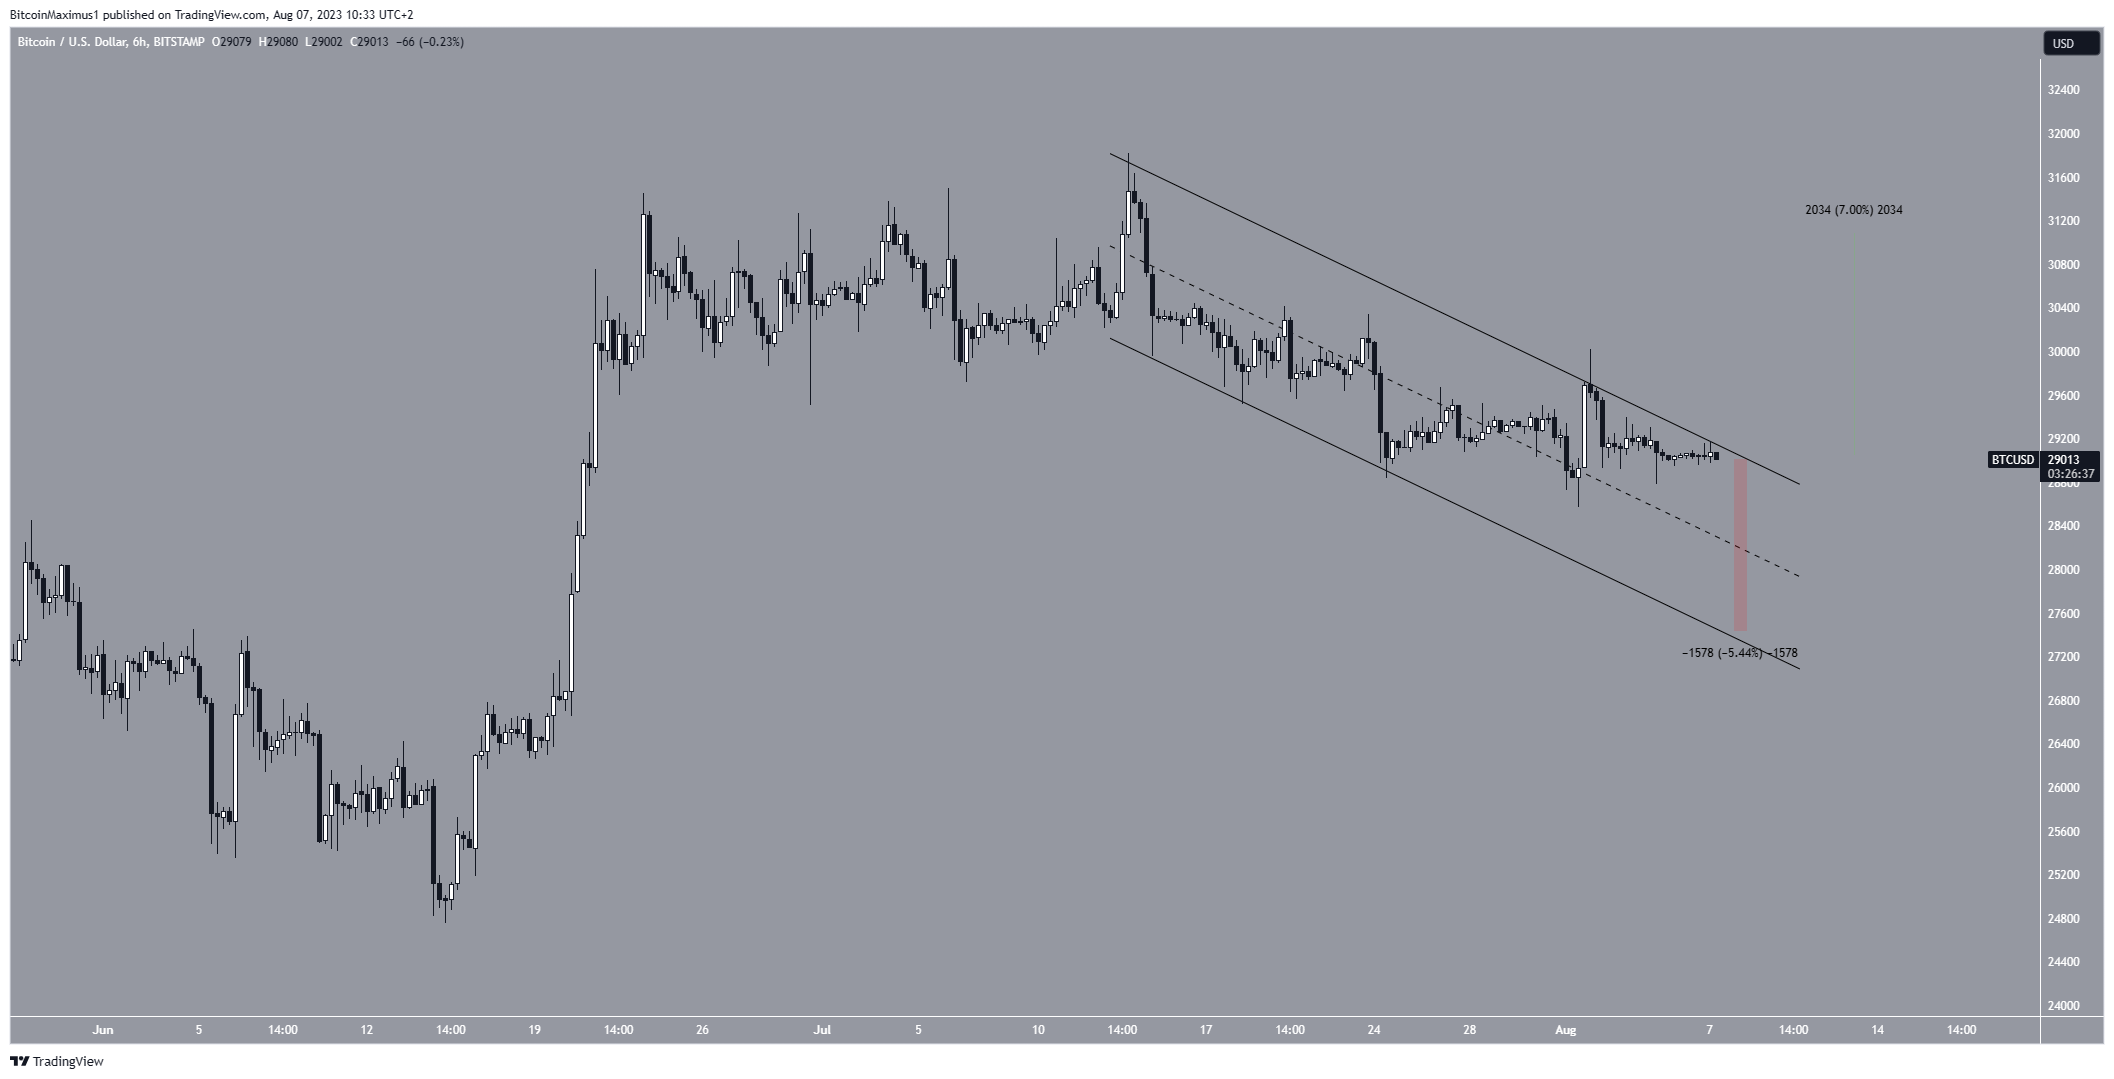
Similarly to the weekly timeframe, the six-hour one also provides an undetermined reading. The price of BTC has fallen since July 13, in a movement that has been contained inside a descending parallel channel. Such channels usually contain corrective movements, meaning that an eventual breakout from the channel is likely.
The fact that the price is trading in the channel’s upper portion makes an increase more likely. If that occurs, an upward movement of 7% to the $31,000 resistance area will likely occur.
However, the channel’s resistance line rejected the BTC price yesterday (red icon). If this begins a downward movement, a drop to the channel’s support line at $27,500 will be expected. This will amount to a decrease of 5.50% and will take the price close to the long-term ascending support line.
Therefore, the future BTC price prediction will be determined by whether the price breaks out above the long-term $31,000 resistance area or falls below the long-term ascending support line.
The BTC price could increase to $35,000 if the former occurs, while it could decline to $25,000 in case of the latter.
Read More: How To Make Money in a Bear Market


