


Bitcoin price has rebounded slightly after recent selling pressure, yet broader technical signals remain cautious. The crypto king recently broke down from a triangle pattern, raising concerns of further downside.
While the move may appear to be stabilizing, underlying metrics suggest potential prolonged weakness.
Bitcoin’s Past Might Dictate Hints At Its Future
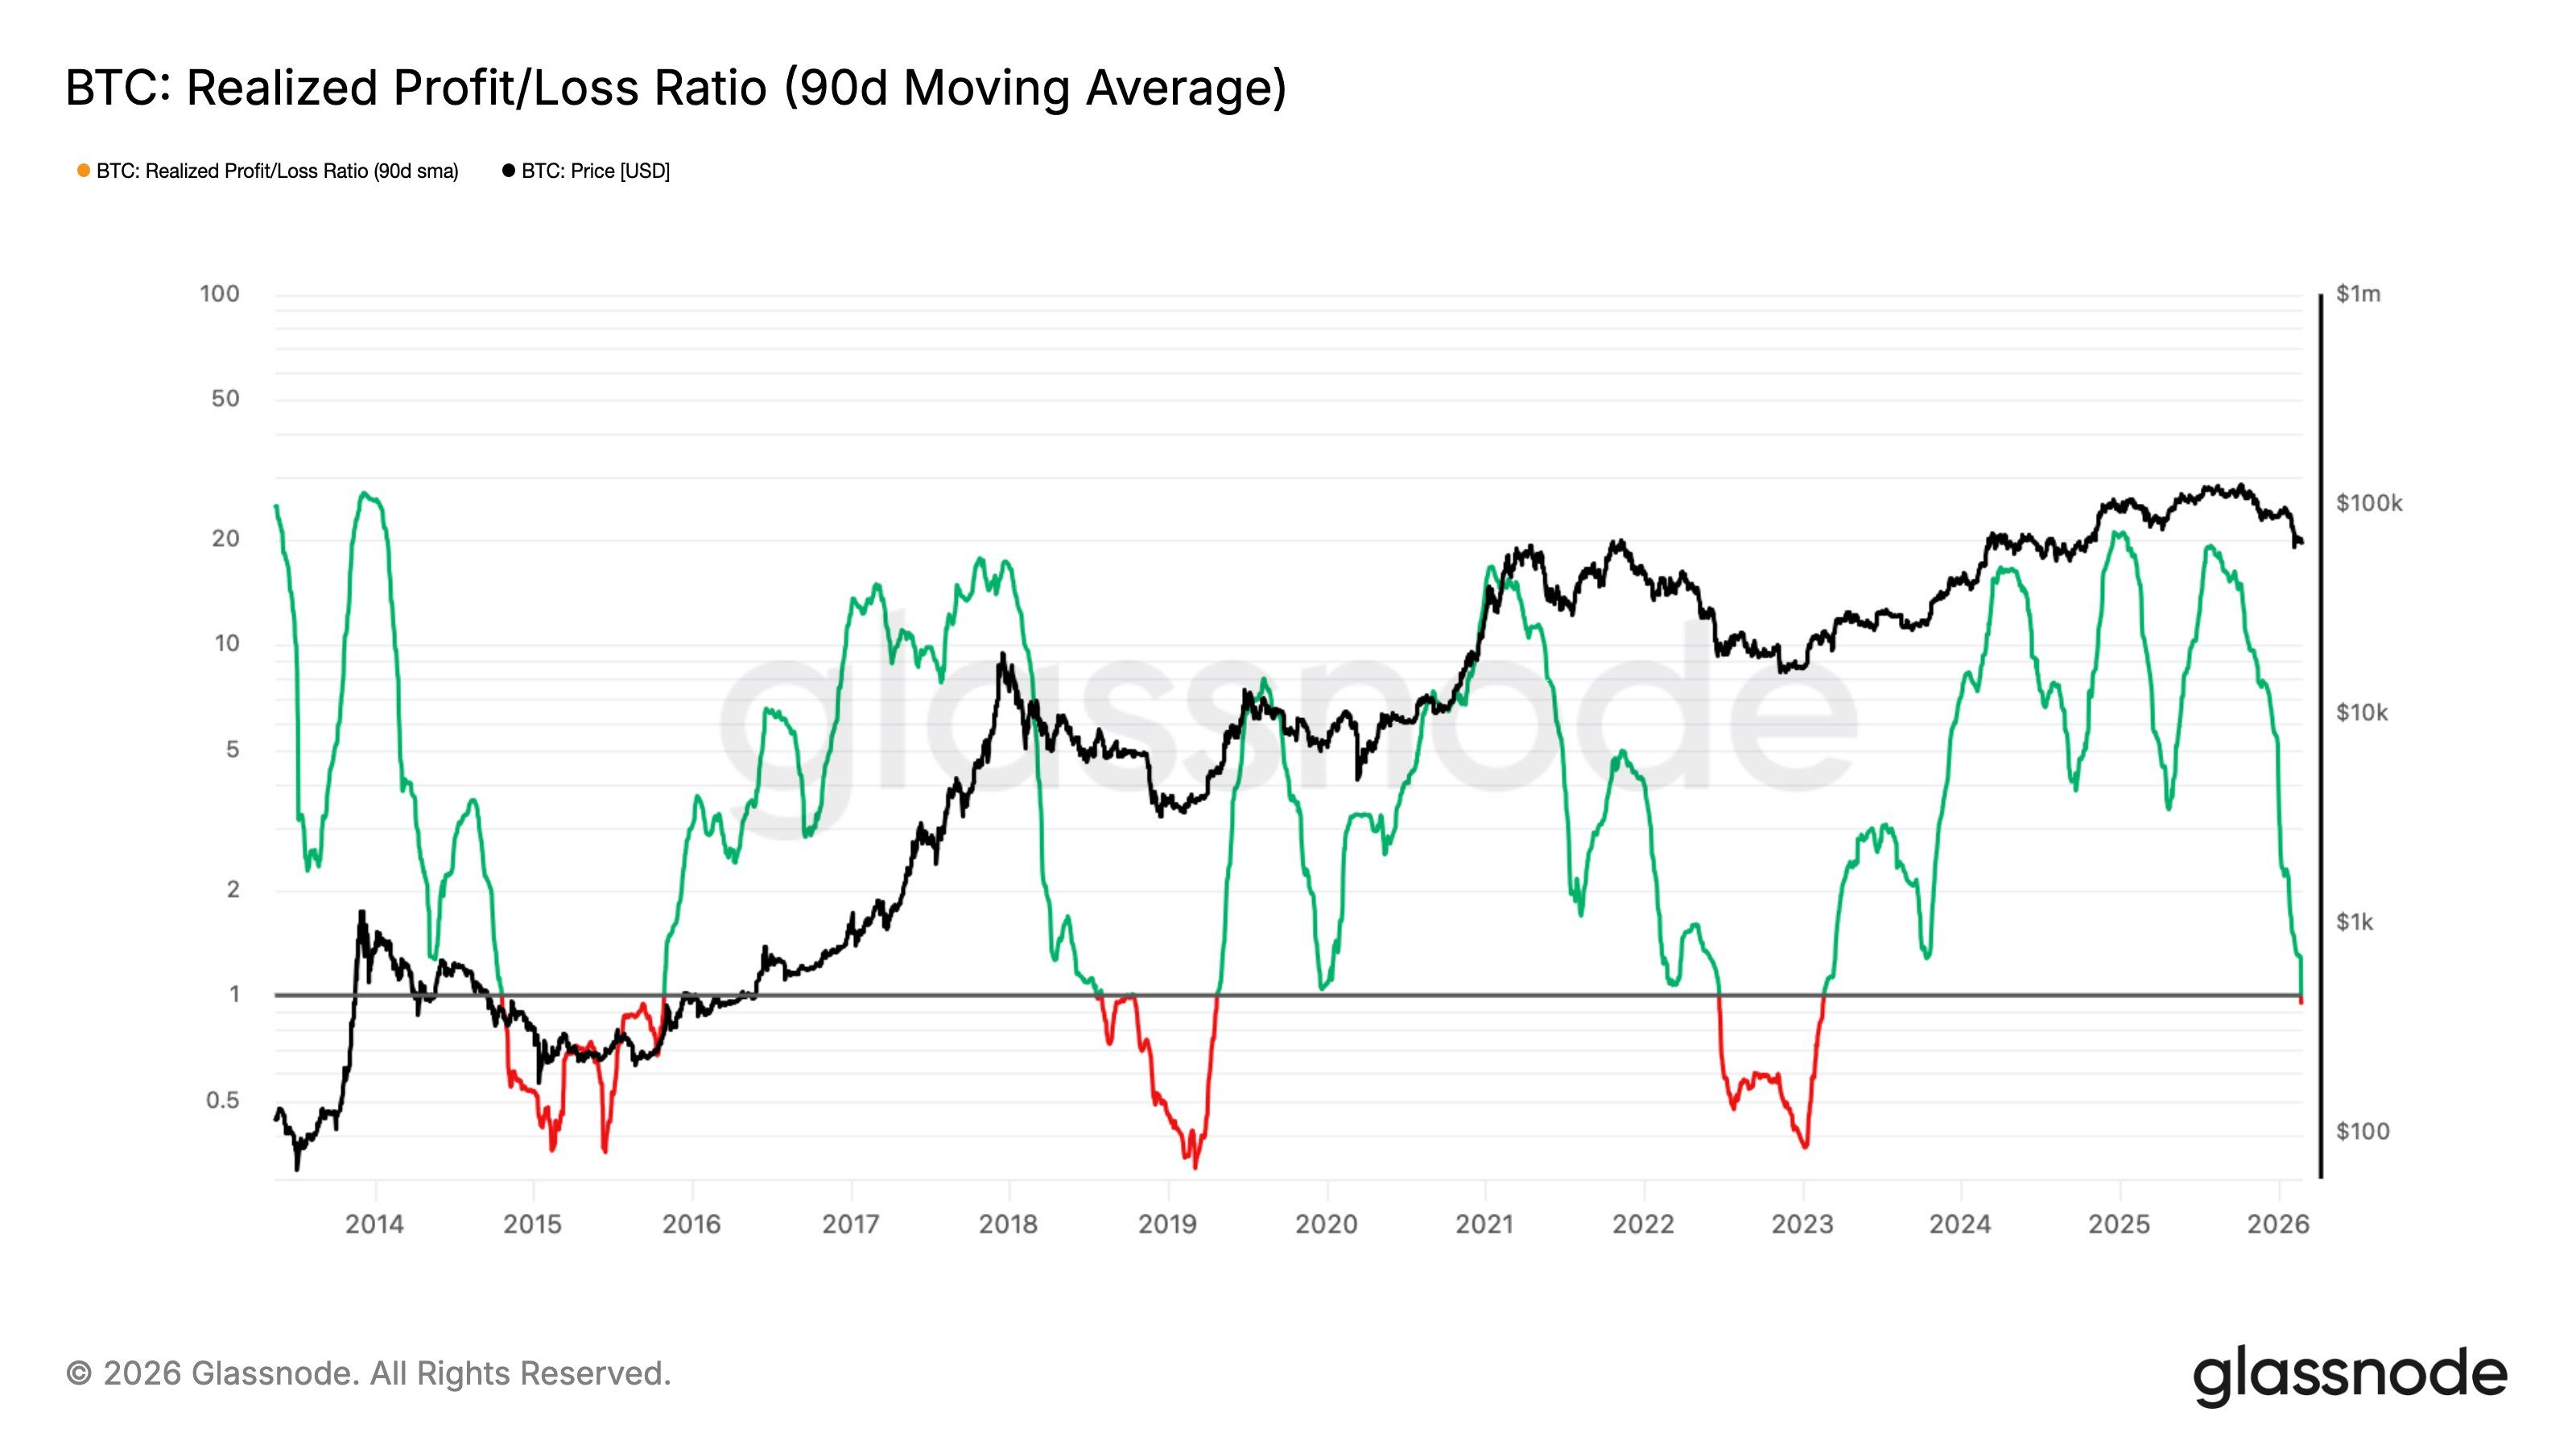
The Realized Profit/Loss Ratio (90D-SMA) has fallen below 1, signaling Bitcoin’s transition into an excess loss-realization regime. This metric measures whether investors are realizing more profits or losses over a rolling 90-day period. A reading below 1 confirms that losses dominate.
Historically, breaks below this threshold have persisted for six months or longer before recovering. Reclaiming levels above 1 has typically aligned with constructive liquidity returning to the crypto market. Until that shift occurs, sentiment may remain defensive and capital inflows limited.
Want more token insights like this? Sign up for Editor Harsh Notariya’s Daily Crypto Newsletter here.
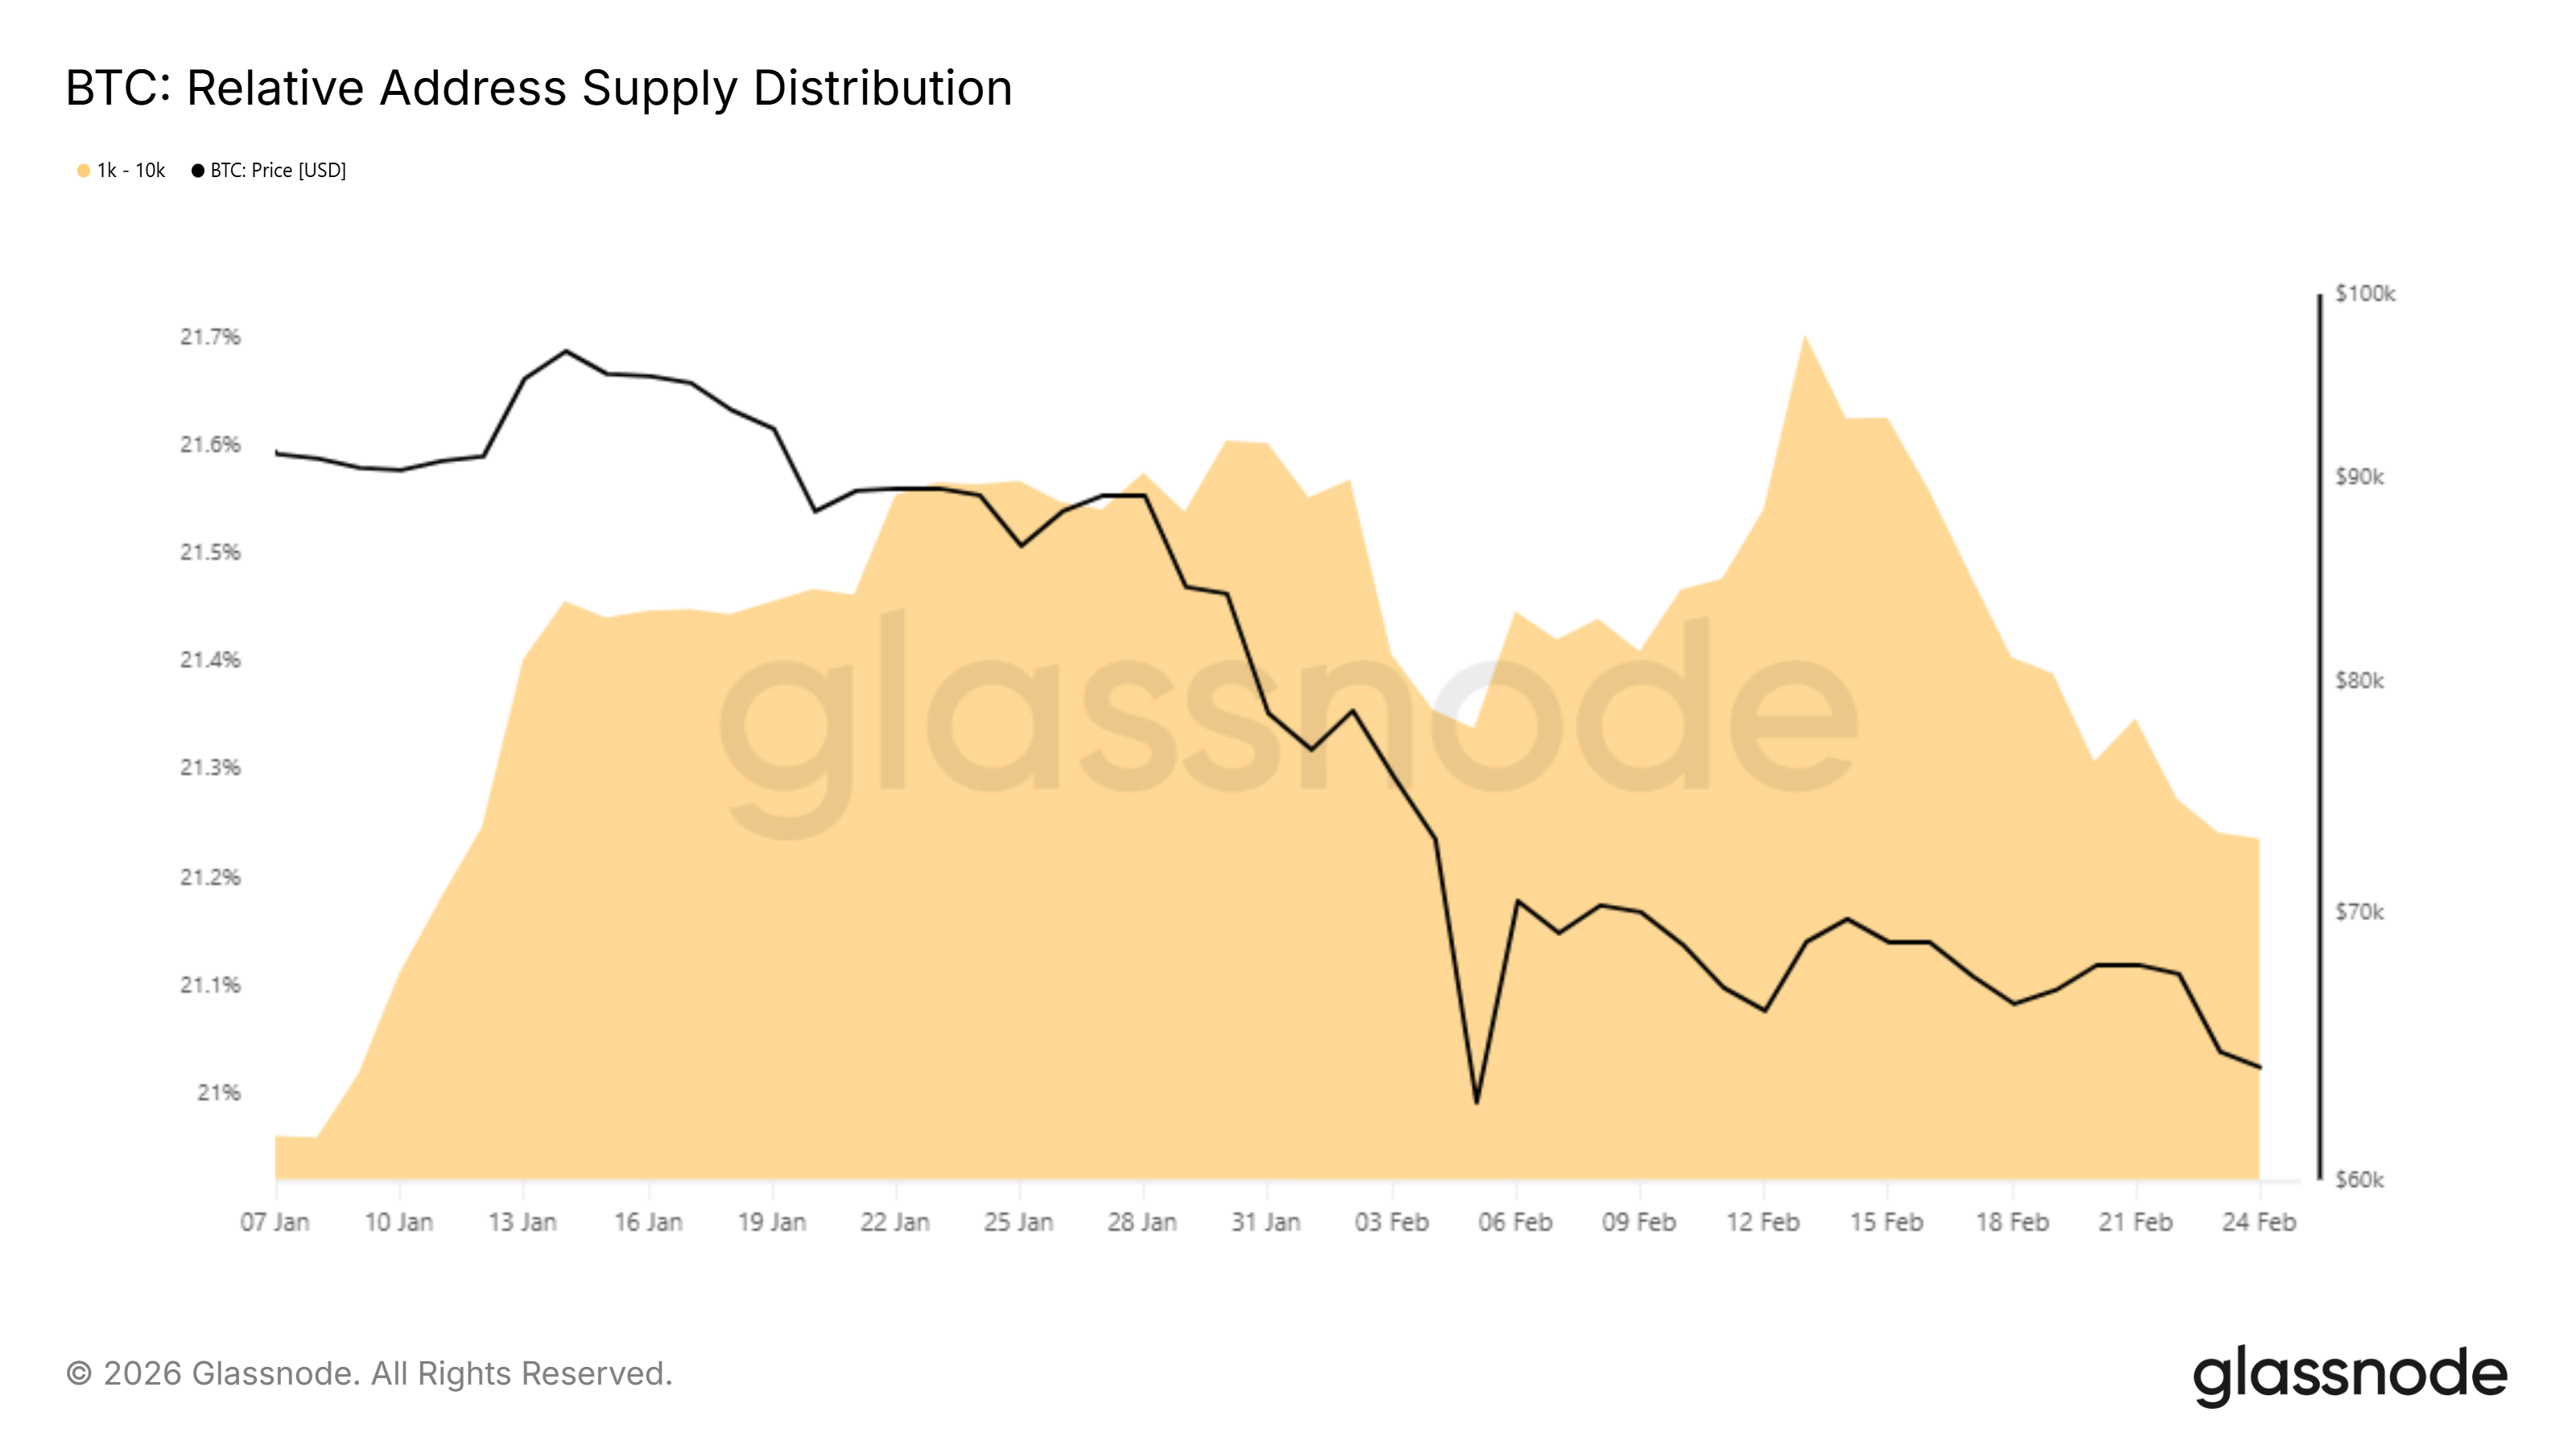
Supply distribution data reveals notable changes among large Bitcoin holders. Addresses holding between 1,000 and 10,000 BTC have gradually reduced exposure. Over the past 12 days, their share of total supply declined from 21.7% to 21.2%.
This shift represents a reduction of nearly 90,000 BTC, valued at approximately $5.8 billion. Although the pace of selling appears measured, distribution by large holders can weigh on price stability. Persistent offloading may limit upside attempts in the near term.
BTC Price Recovery Unlikely
Bitcoin is trading at $65,475 at the time of writing after bouncing from the $62,525 support level over the past 24 hours. The earlier triangle breakdown projected a potential 14% decline. However, immediate downside momentum appears to be slowing.
If macro bearish signals continue to dominate, Bitcoin could retest the $62,525 support. A decisive break below that level may expose BTC to the psychological $60,000 threshold. Losing this support could intensify panic selling and deepen the correction.
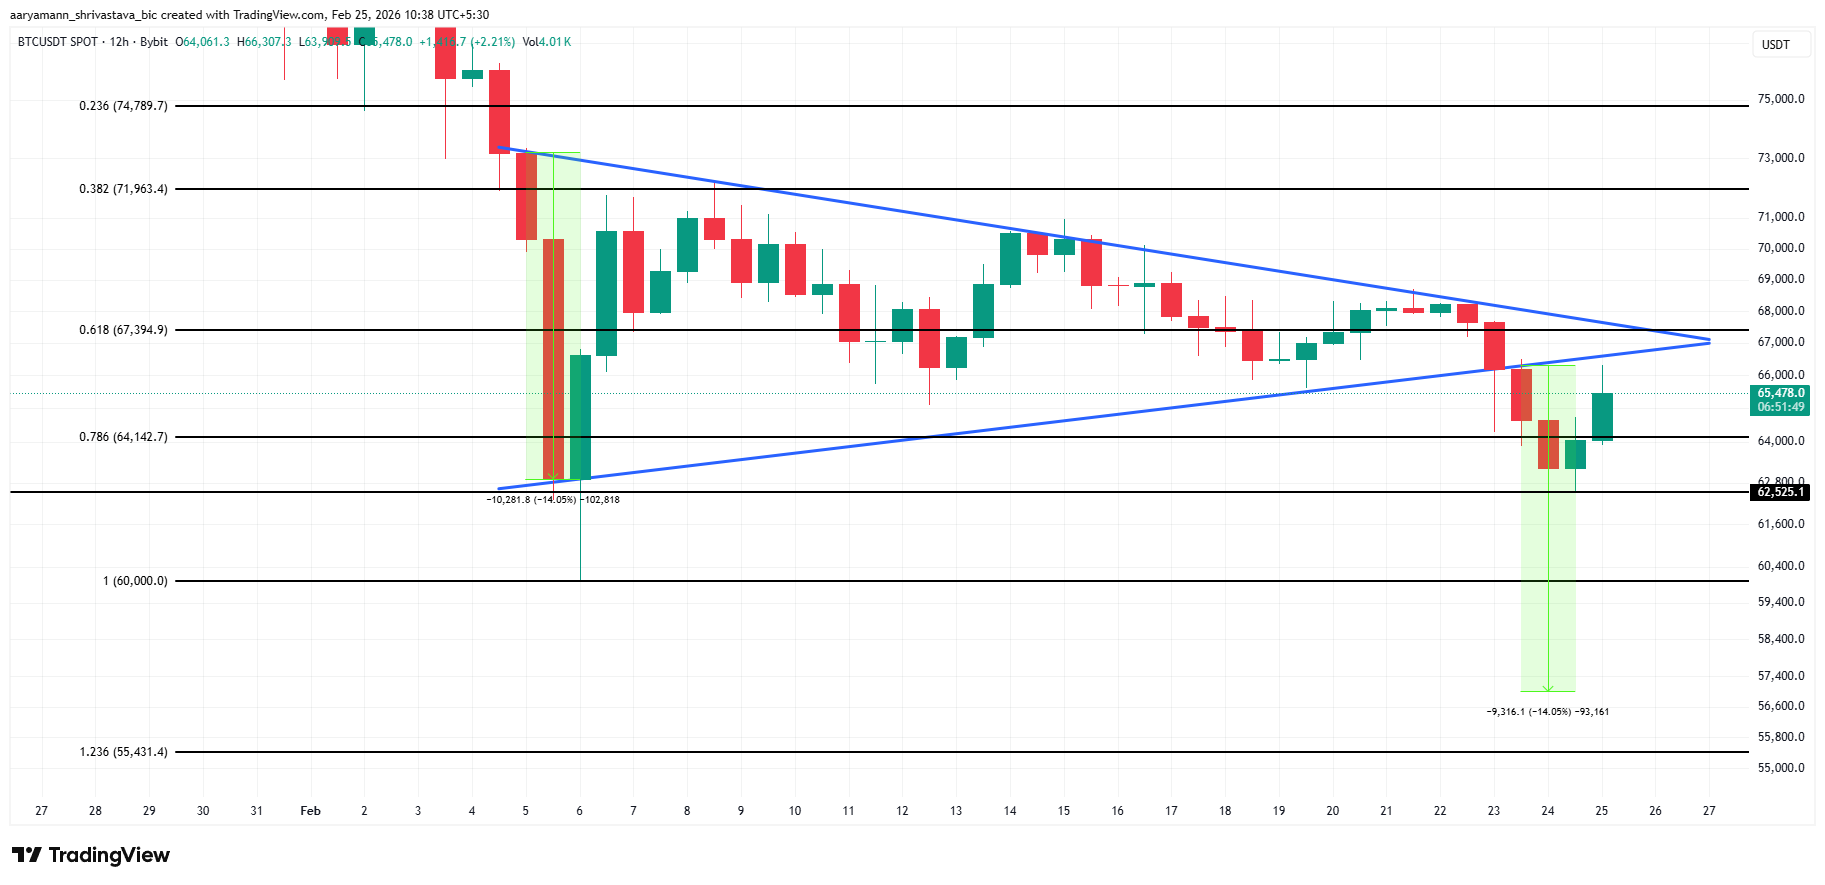
Conversely, renewed buying interest at current levels may shift short-term momentum. A breakout above the $67,394 resistance would invalidate the triangle pattern. Sustained strength beyond that point would signal improving structure for BTC and suggest a temporary bullish recovery despite broader liquidity concerns.


