

The retracement occurred in February 2016 and the price continued to make new highs afterward.$BTC #BITCOIN
— Michaël van de Poppe (@CryptoMichNL) November 21, 2019
Market is fragile.
But this is funny.
In 2016 a similar push occurred with a deep retrace after to the 0.786-0.886 fib level.
Would be nice to see a similar thing occurring now through which $7,800-7,900 would be important. pic.twitter.com/t7KIs0013D
Bitcoin Price Similarities
The similarities between the two movements begin with the low. After the 2013/2017 highs, it took the Bitcoin price roughly 400 days to reach a bottom. This was combined with an oversold weekly RSI value both times, suggesting that the price is at similar points in the market cycle. Afterward, a very steep upward move ensued, followed by a correction. However, instead of correcting further, the price reversed and continued to make higher highs. The tweet makes the assumption that the current price movement might follow a pattern similar to that after February 2016, outlined by the second arrow in the top graph.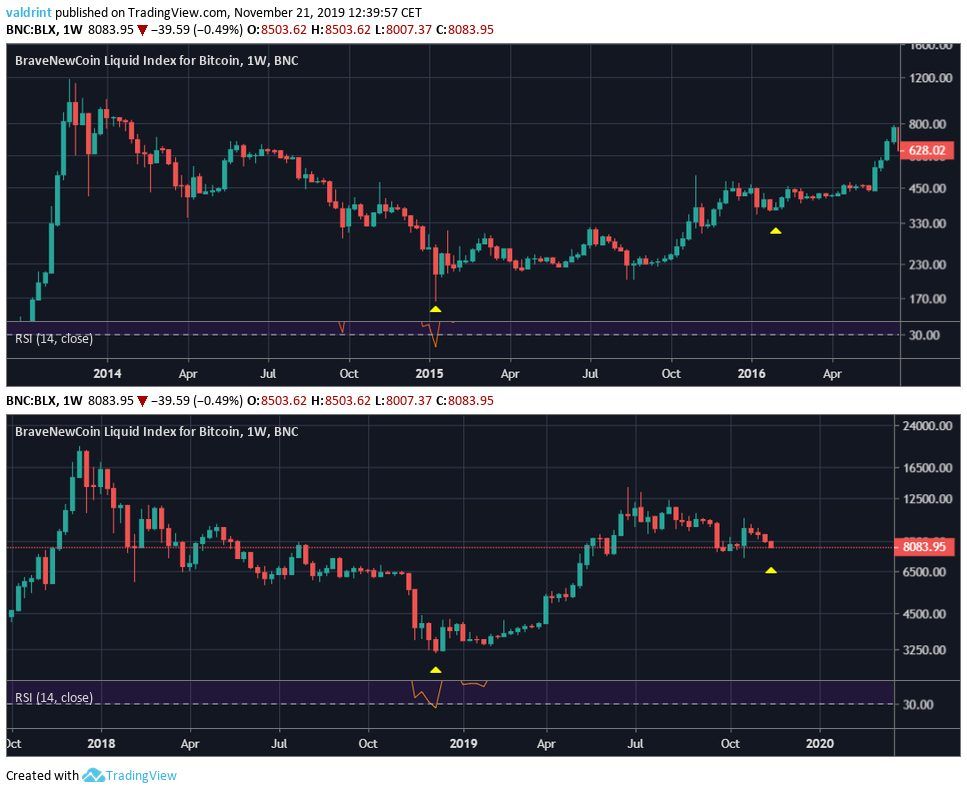 Looking at lower time-frames, we can see that the corrections followed different patterns. The 2016 movement was an ascending triangle, while in 2019 we broke down from a symmetrical triangle before validating it as resistance.
However, the tweet does not state that the corrections are identical. Rather, it states that the likely reversal point (yellow arrow) which came after a sharp decrease and its ensuing retracement was almost identical.
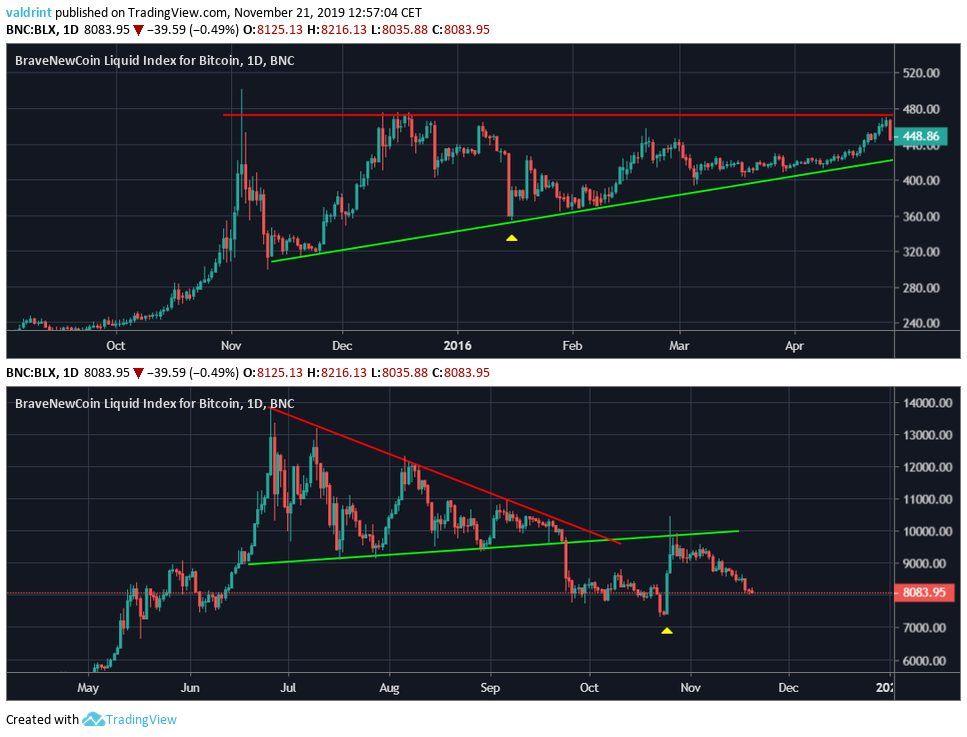
Looking at lower time-frames, we can see that the corrections followed different patterns. The 2016 movement was an ascending triangle, while in 2019 we broke down from a symmetrical triangle before validating it as resistance.
However, the tweet does not state that the corrections are identical. Rather, it states that the likely reversal point (yellow arrow) which came after a sharp decrease and its ensuing retracement was almost identical.
 Let’s isolate these movements and see if we can reach a verdict.
2016
The 2016 spike transpired through two daily candlesticks, separated by three days without significant movement. The volume was average throughout. After the move, the Bitcoin price retraced to the 0.88 fib level before resuming its increase. Additionally, while the RSI was oversold, there was no bullish divergence preceding the spike.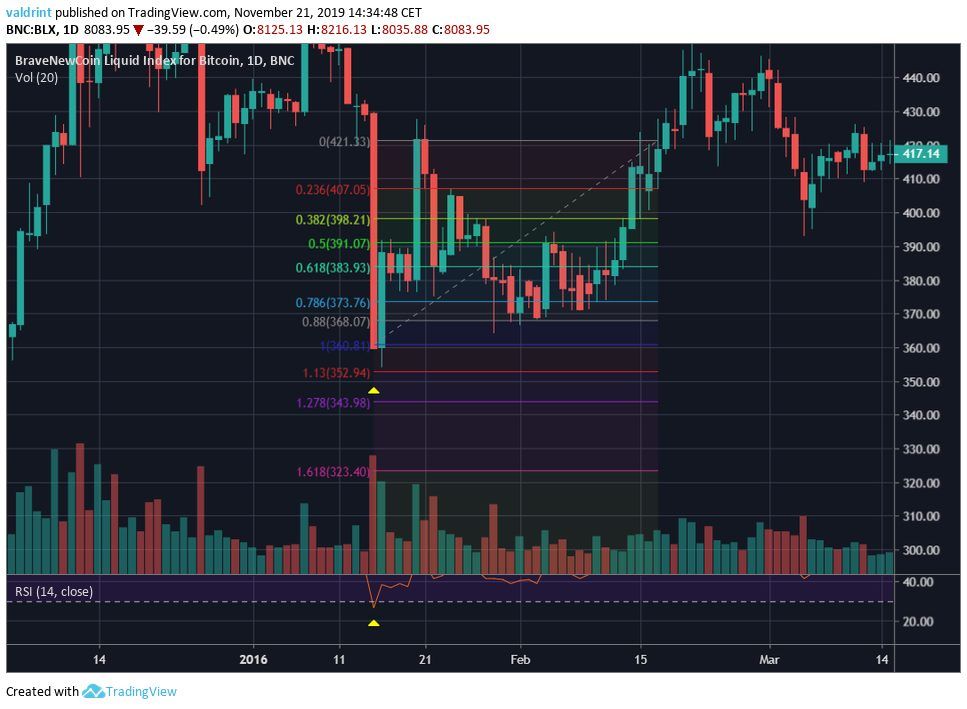
2019
In 2019, the spike occurred with significant volume, larger than that of the preceding decrease. It transpired over two successive daily candlesticks. But, the second one had a very long upper wick — a bearish development. The Bitcoin price is currently at the 0.786 fib level. The 0.88 level is slightly below $7800. A breakdown below this level would invalidate the possibility of the fractal. Finally, the movement was preceded by significant bullish divergence in the RSI.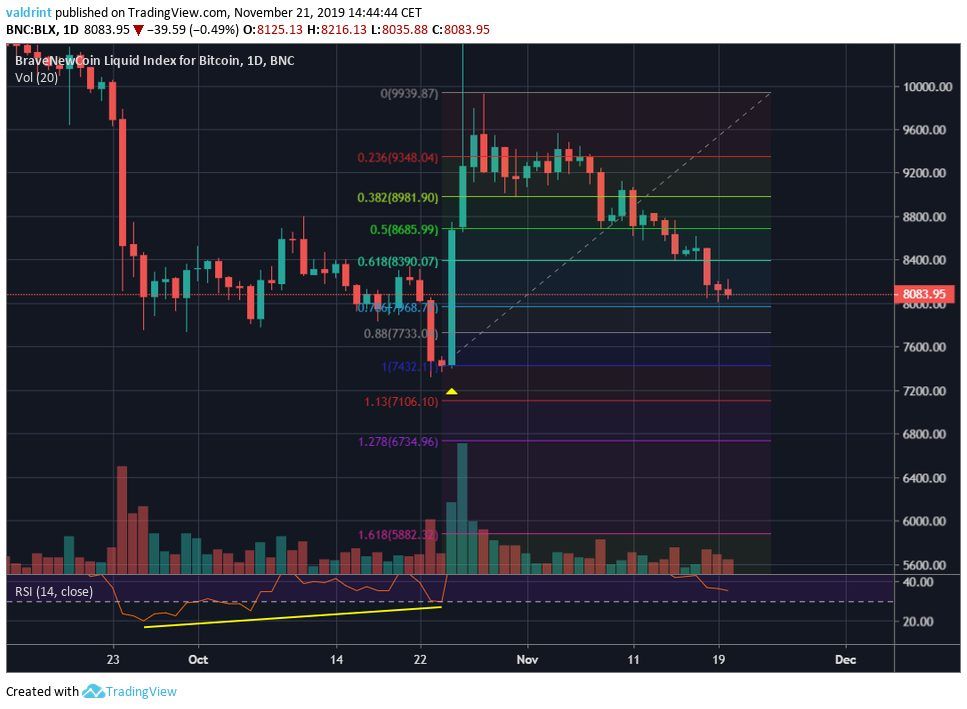 To conclude, the two movements have several similarities, mostly visible in higher time-frames, which show that the current price should be at a similar point after the 2017 high as the price in 2016 was after the 2013 high.
However, they are very different when analyzed individually. While the technical indicators are bullish in the 2019 movement, the market structure is bearish. On the other hand, the opposite is true in 2016. Therefore, considering them as fractals seems like a bit of a stretch.
A breakdown below the 0.88 fib level at $7800 would confirm the fractal invalidation.
To conclude, the two movements have several similarities, mostly visible in higher time-frames, which show that the current price should be at a similar point after the 2017 high as the price in 2016 was after the 2013 high.
However, they are very different when analyzed individually. While the technical indicators are bullish in the 2019 movement, the market structure is bearish. On the other hand, the opposite is true in 2016. Therefore, considering them as fractals seems like a bit of a stretch.
A breakdown below the 0.88 fib level at $7800 would confirm the fractal invalidation.
Disclaimer: This article is not trading advice and should not be construed as such. Always consult a trained financial professional before investing in cryptocurrencies, as the market is particularly volatile.
Did you know you can trade sign-up to trade Bitcoin and many leading altcoins with a multiplier of up to 100x on a safe and secure exchange with the lowest fees — with only an email address? Well, now you do! Click here to get started on StormGain!
Disclaimer
In line with the Trust Project guidelines, this price analysis article is for informational purposes only and should not be considered financial or investment advice. BeInCrypto is committed to accurate, unbiased reporting, but market conditions are subject to change without notice. Always conduct your own research and consult with a professional before making any financial decisions. Please note that our Terms and Conditions, Privacy Policy, and Disclaimers have been updated.
