
Bitcoin is facing a rough patch. The BTC price has dropped about 6% from its all-time high of around $123,000.
While retail traders hope for a bounce, on-chain signals suggest deeper trouble. Both whales and institutions seem to be stepping back, and charts aren’t looking great either.
Whale Activity Paints a Bearish Picture
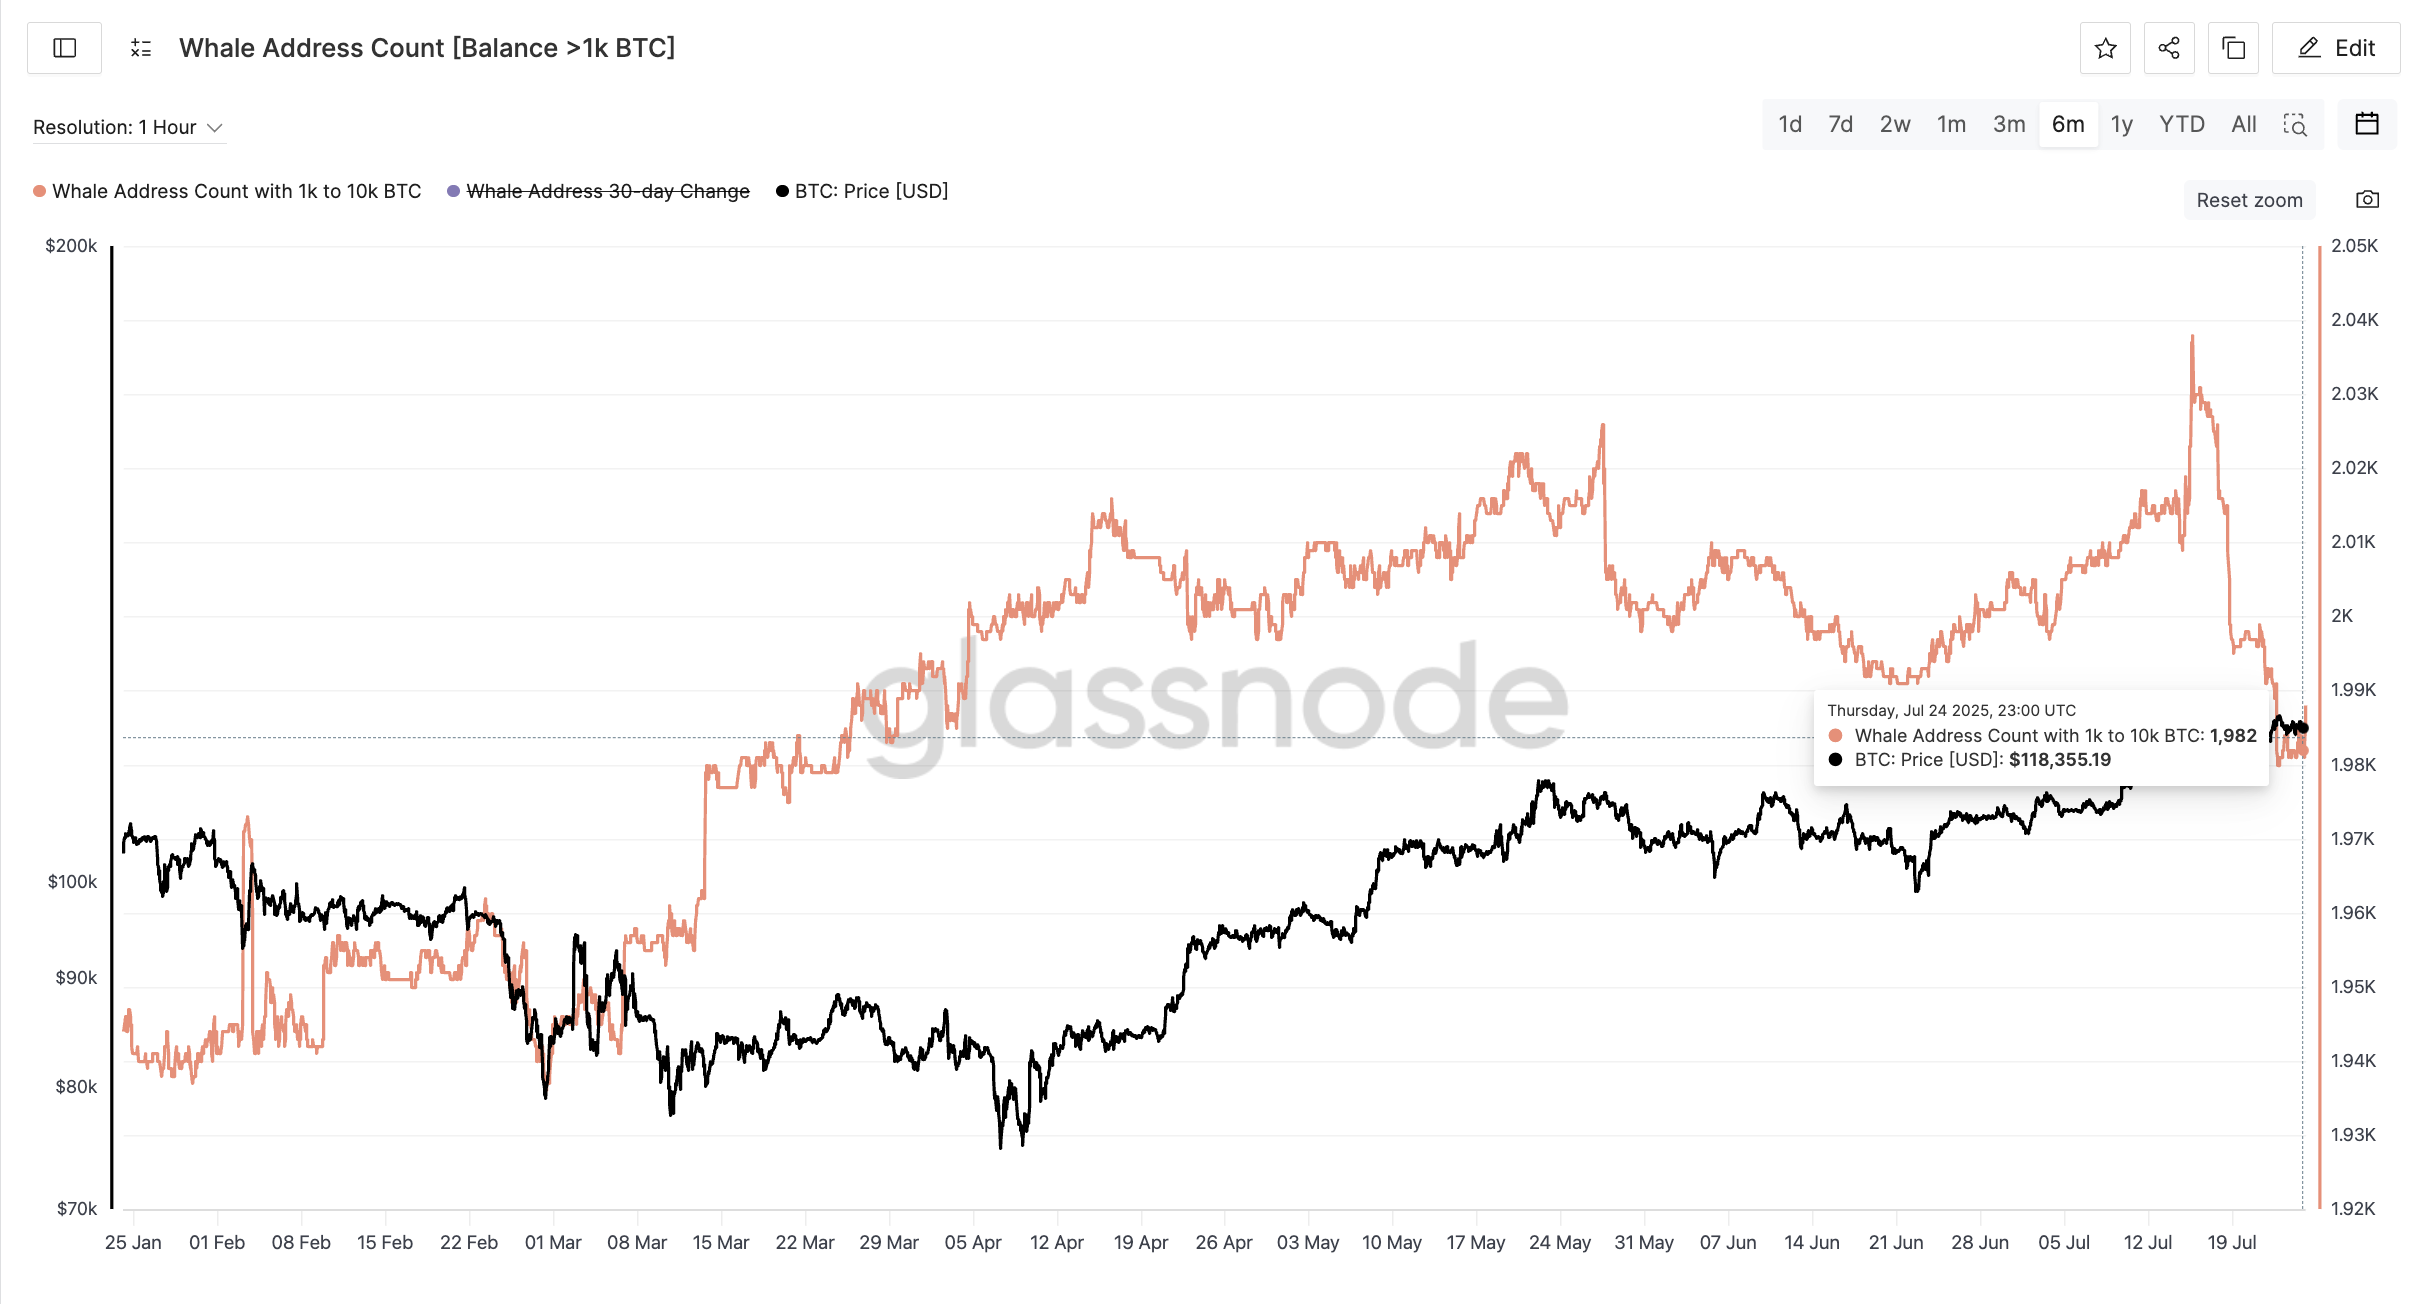
BTC price is now 6% down from its all-time high of $122,838. The decline may not be random.
Over the last 10 days, the number of whale addresses holding 1,000 to 10,000 BTC has dropped from 2,037 to 1,982 — a 2.7% slide. This is the steepest drop in whale participation in over six months.
It’s not just the shrinking wallet count that matters. The exchange whale ratio, a metric showing how much of exchange inflows come from whales, is also rising.
Historically, this ratio made three straight lower highs on July 4, 8, and 13. This aligned with BTC price rising to its all-time high. Now, we’re seeing higher highs again. The ratio was 0.5 on July 22, rising to 0.52 by July 24, just as the BTC price started dipping.
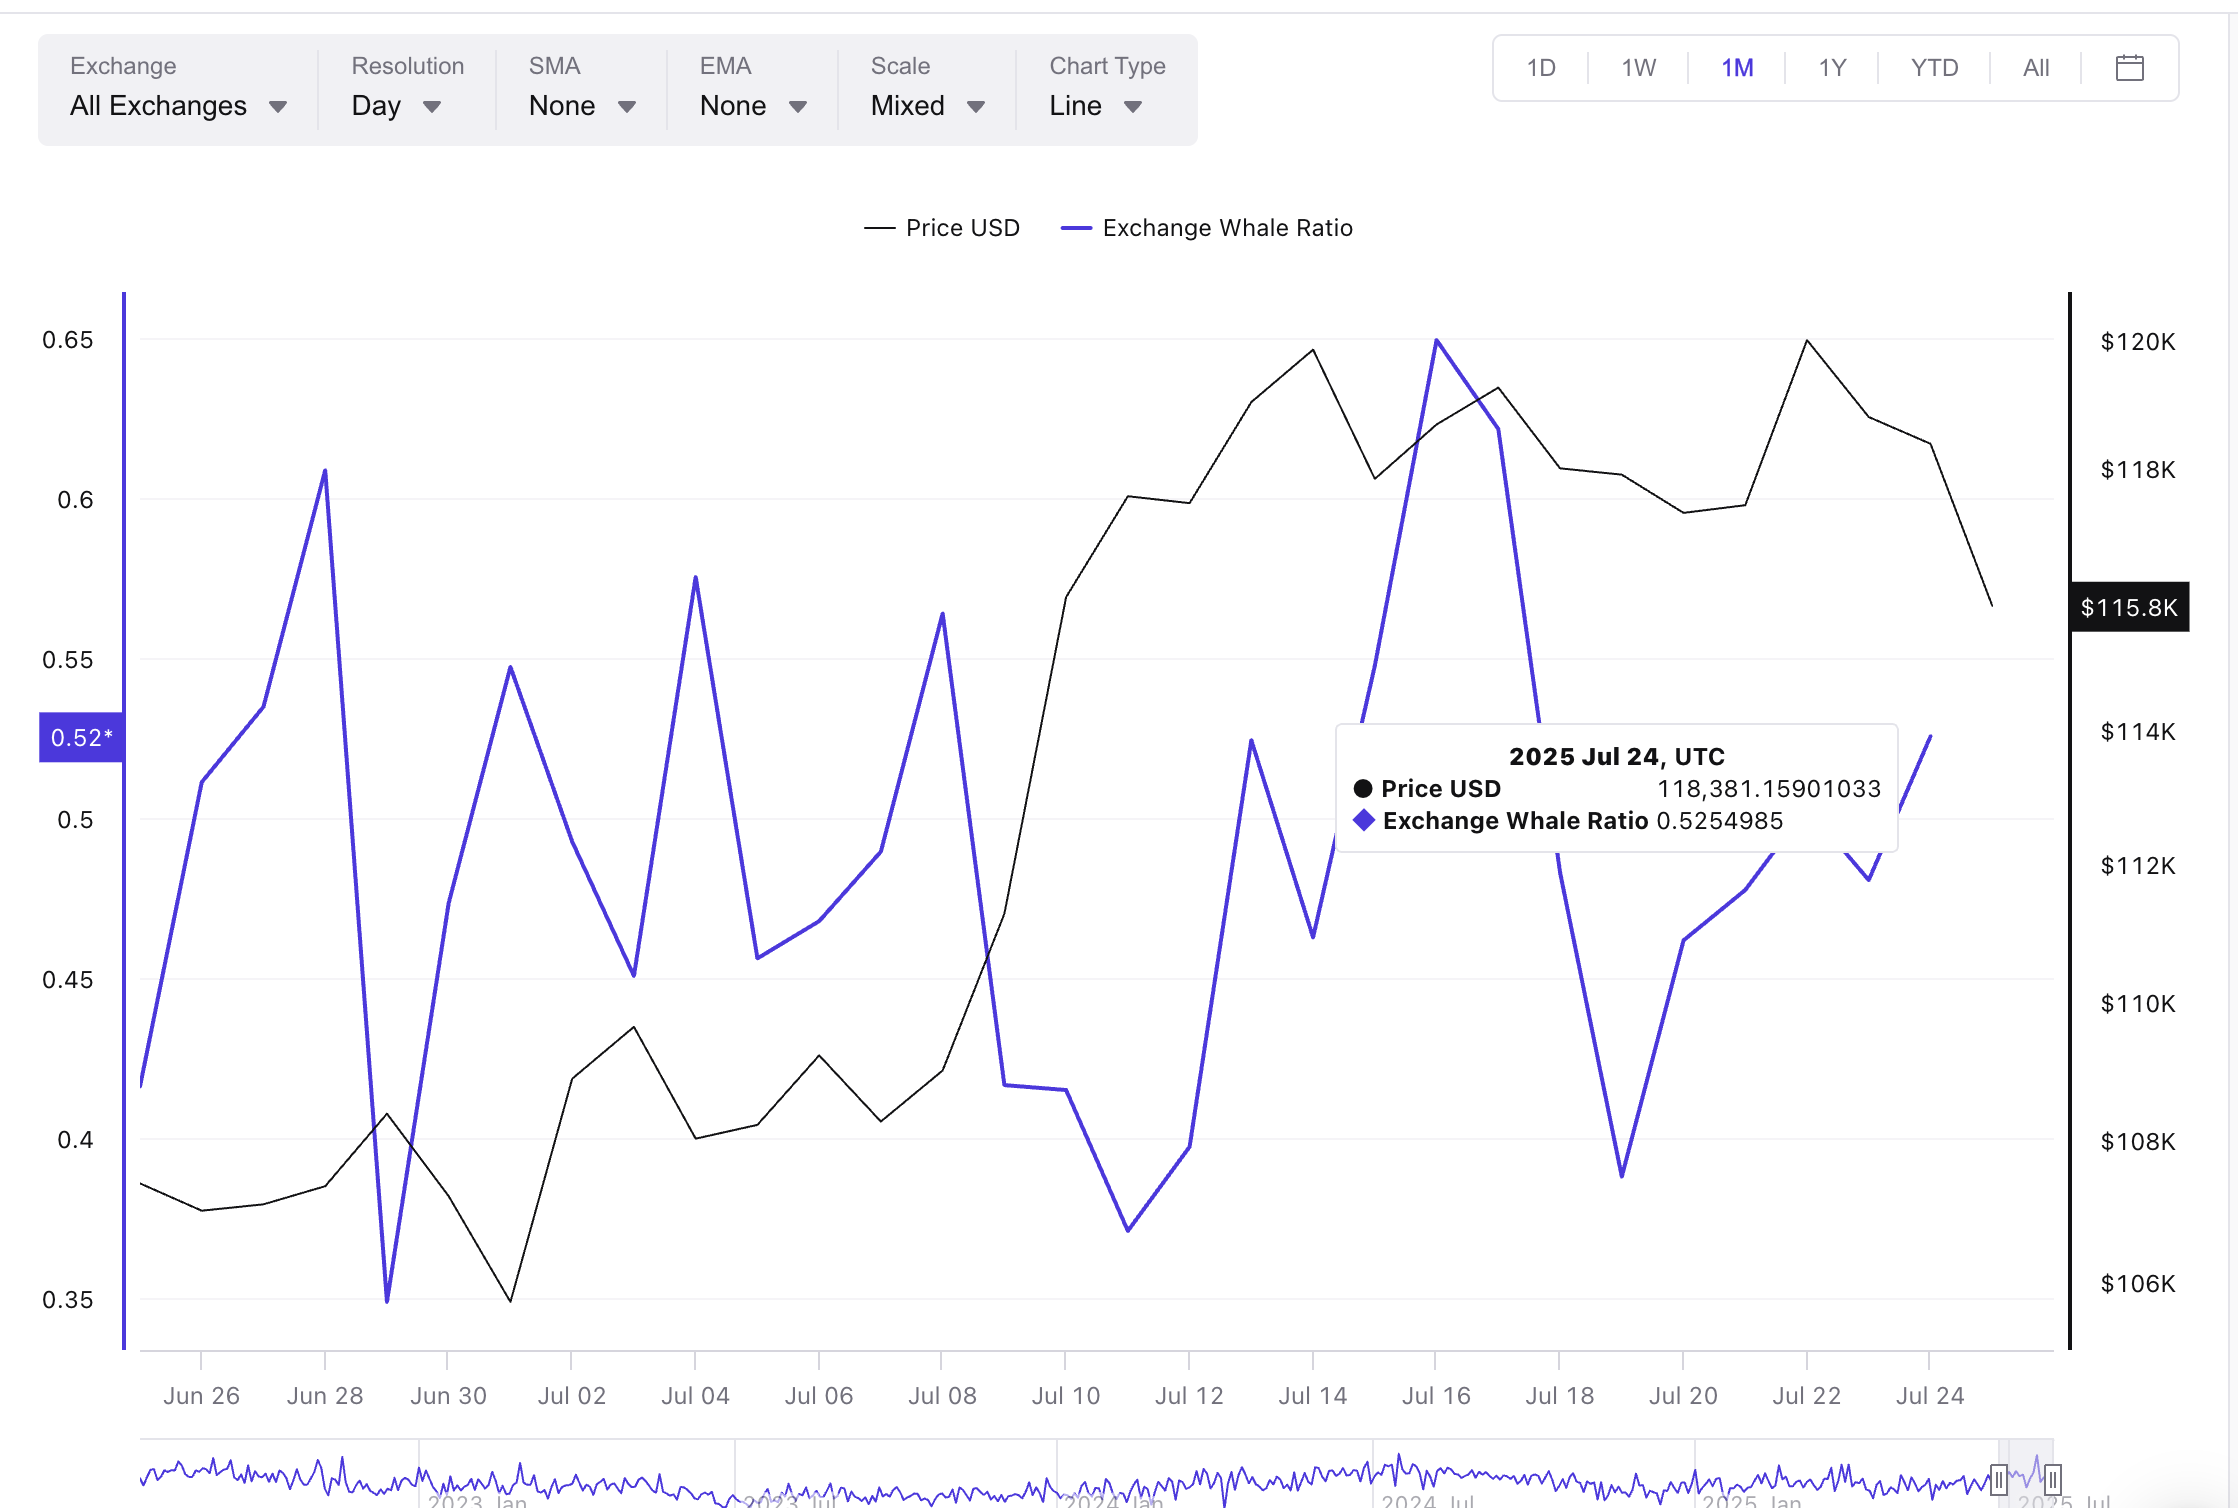
This pattern hints that whales aren’t just exiting — they’re sending coins to exchanges. If history repeats, more selling pressure could follow. Galaxy Digital reportedly deposited 10,000 BTC to exchanges a while back, adding to institutional unease.
Bearish EMA Setup Signals a Breakdown
This whale-driven weakness is now showing up on the 4-hour chart. Smaller timeframes are often used to perceive trends early.
BTC price just broke below the 100-period EMA (exponential moving average), a key short-term support. What’s worse, the 20-period EMA (red line) is on the verge of crossing below the 50-period EMA (orange line), hinting at a bearish “death” crossover.
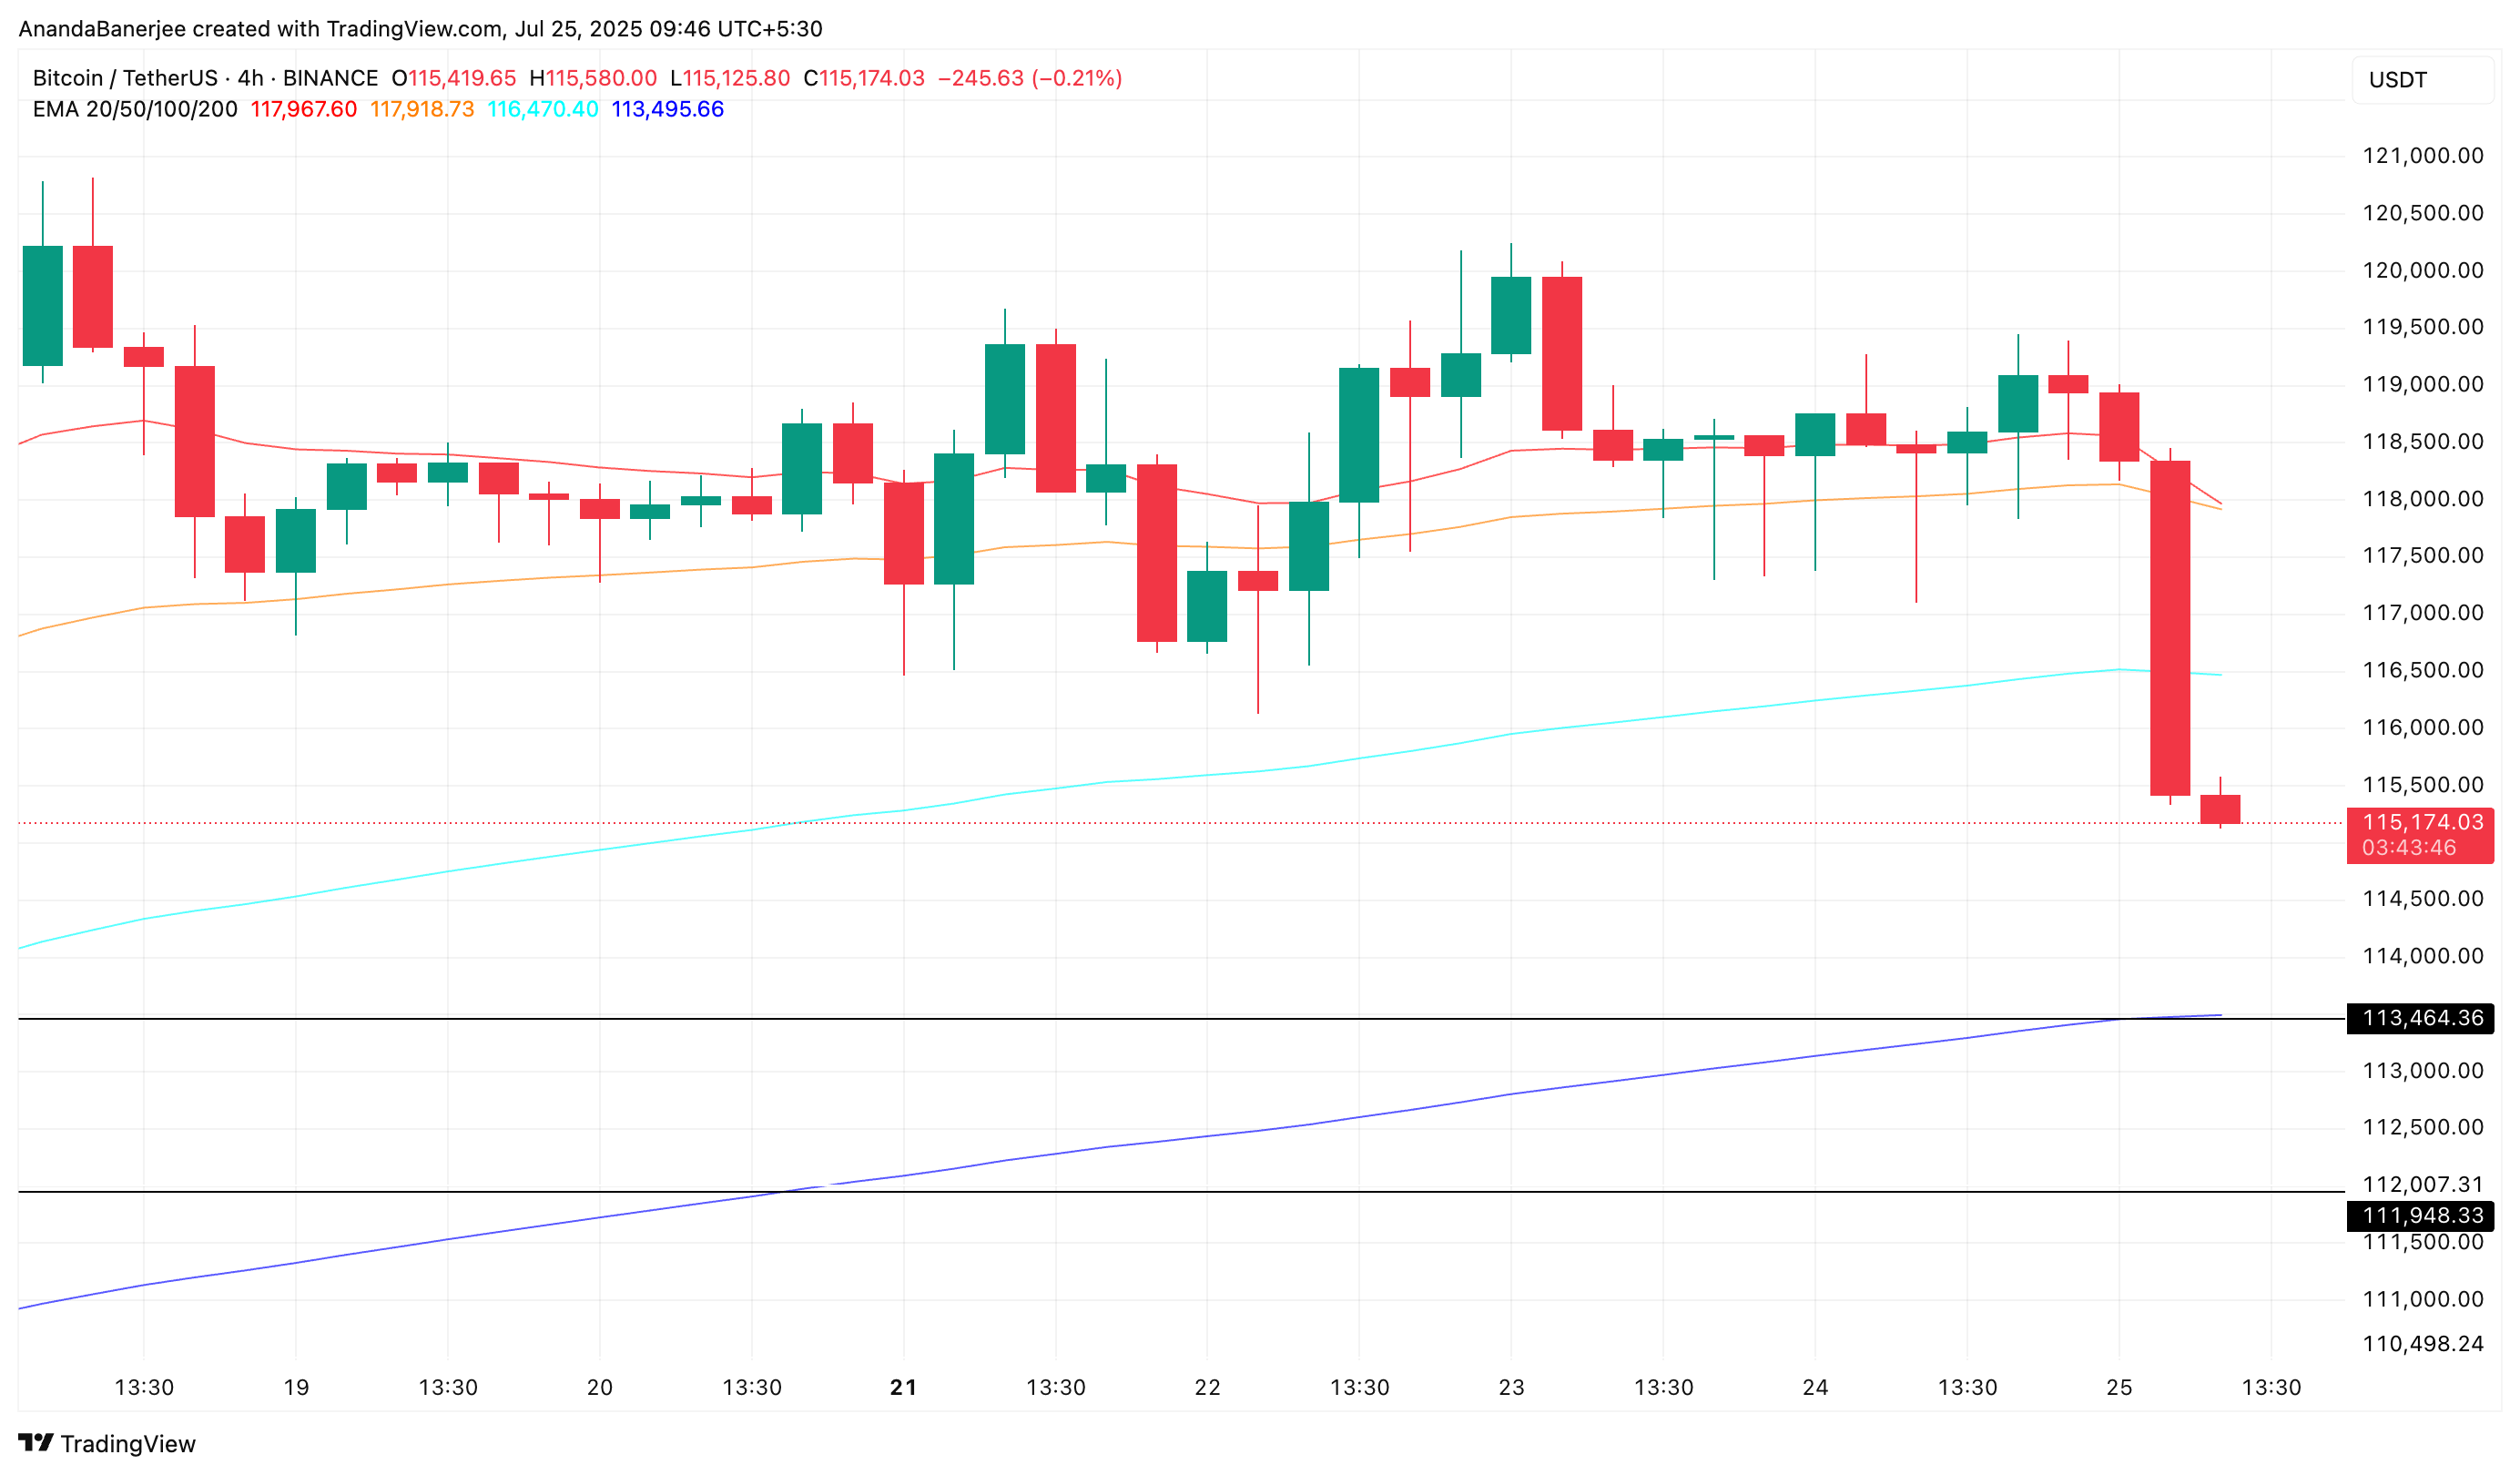
Why does this matter? These EMA levels often act as momentum signals for traders. A bearish crossover between the 20 and 50 EMAs typically confirms that short-term sellers have taken control.
That aligns with whale outflows and big players, such as Galaxy, quietly reducing their exposure.
The next key support is the 200-period EMA (blue line) on the 4-hour chart, currently near $113,000. This EMA line is also in sync with a key support level, to be revealed in the next section.
For token TA and market updates: Want more token insights like this? Sign up for Editor Harsh Notariya’s Daily Crypto Newsletter here.
Bitcoin Price Chart Points to $113,000 As Key Defense
The daily Bitcoin price chart tells a similar story. After holding near $117,000 for nearly a week, BTC has dropped sharply and is now hovering near $115K. If $113,000 doesn’t hold, the next supports lie at $110,000 and $107,000: levels marked by the 0.5 and 0.618 Fibonacci retracements.
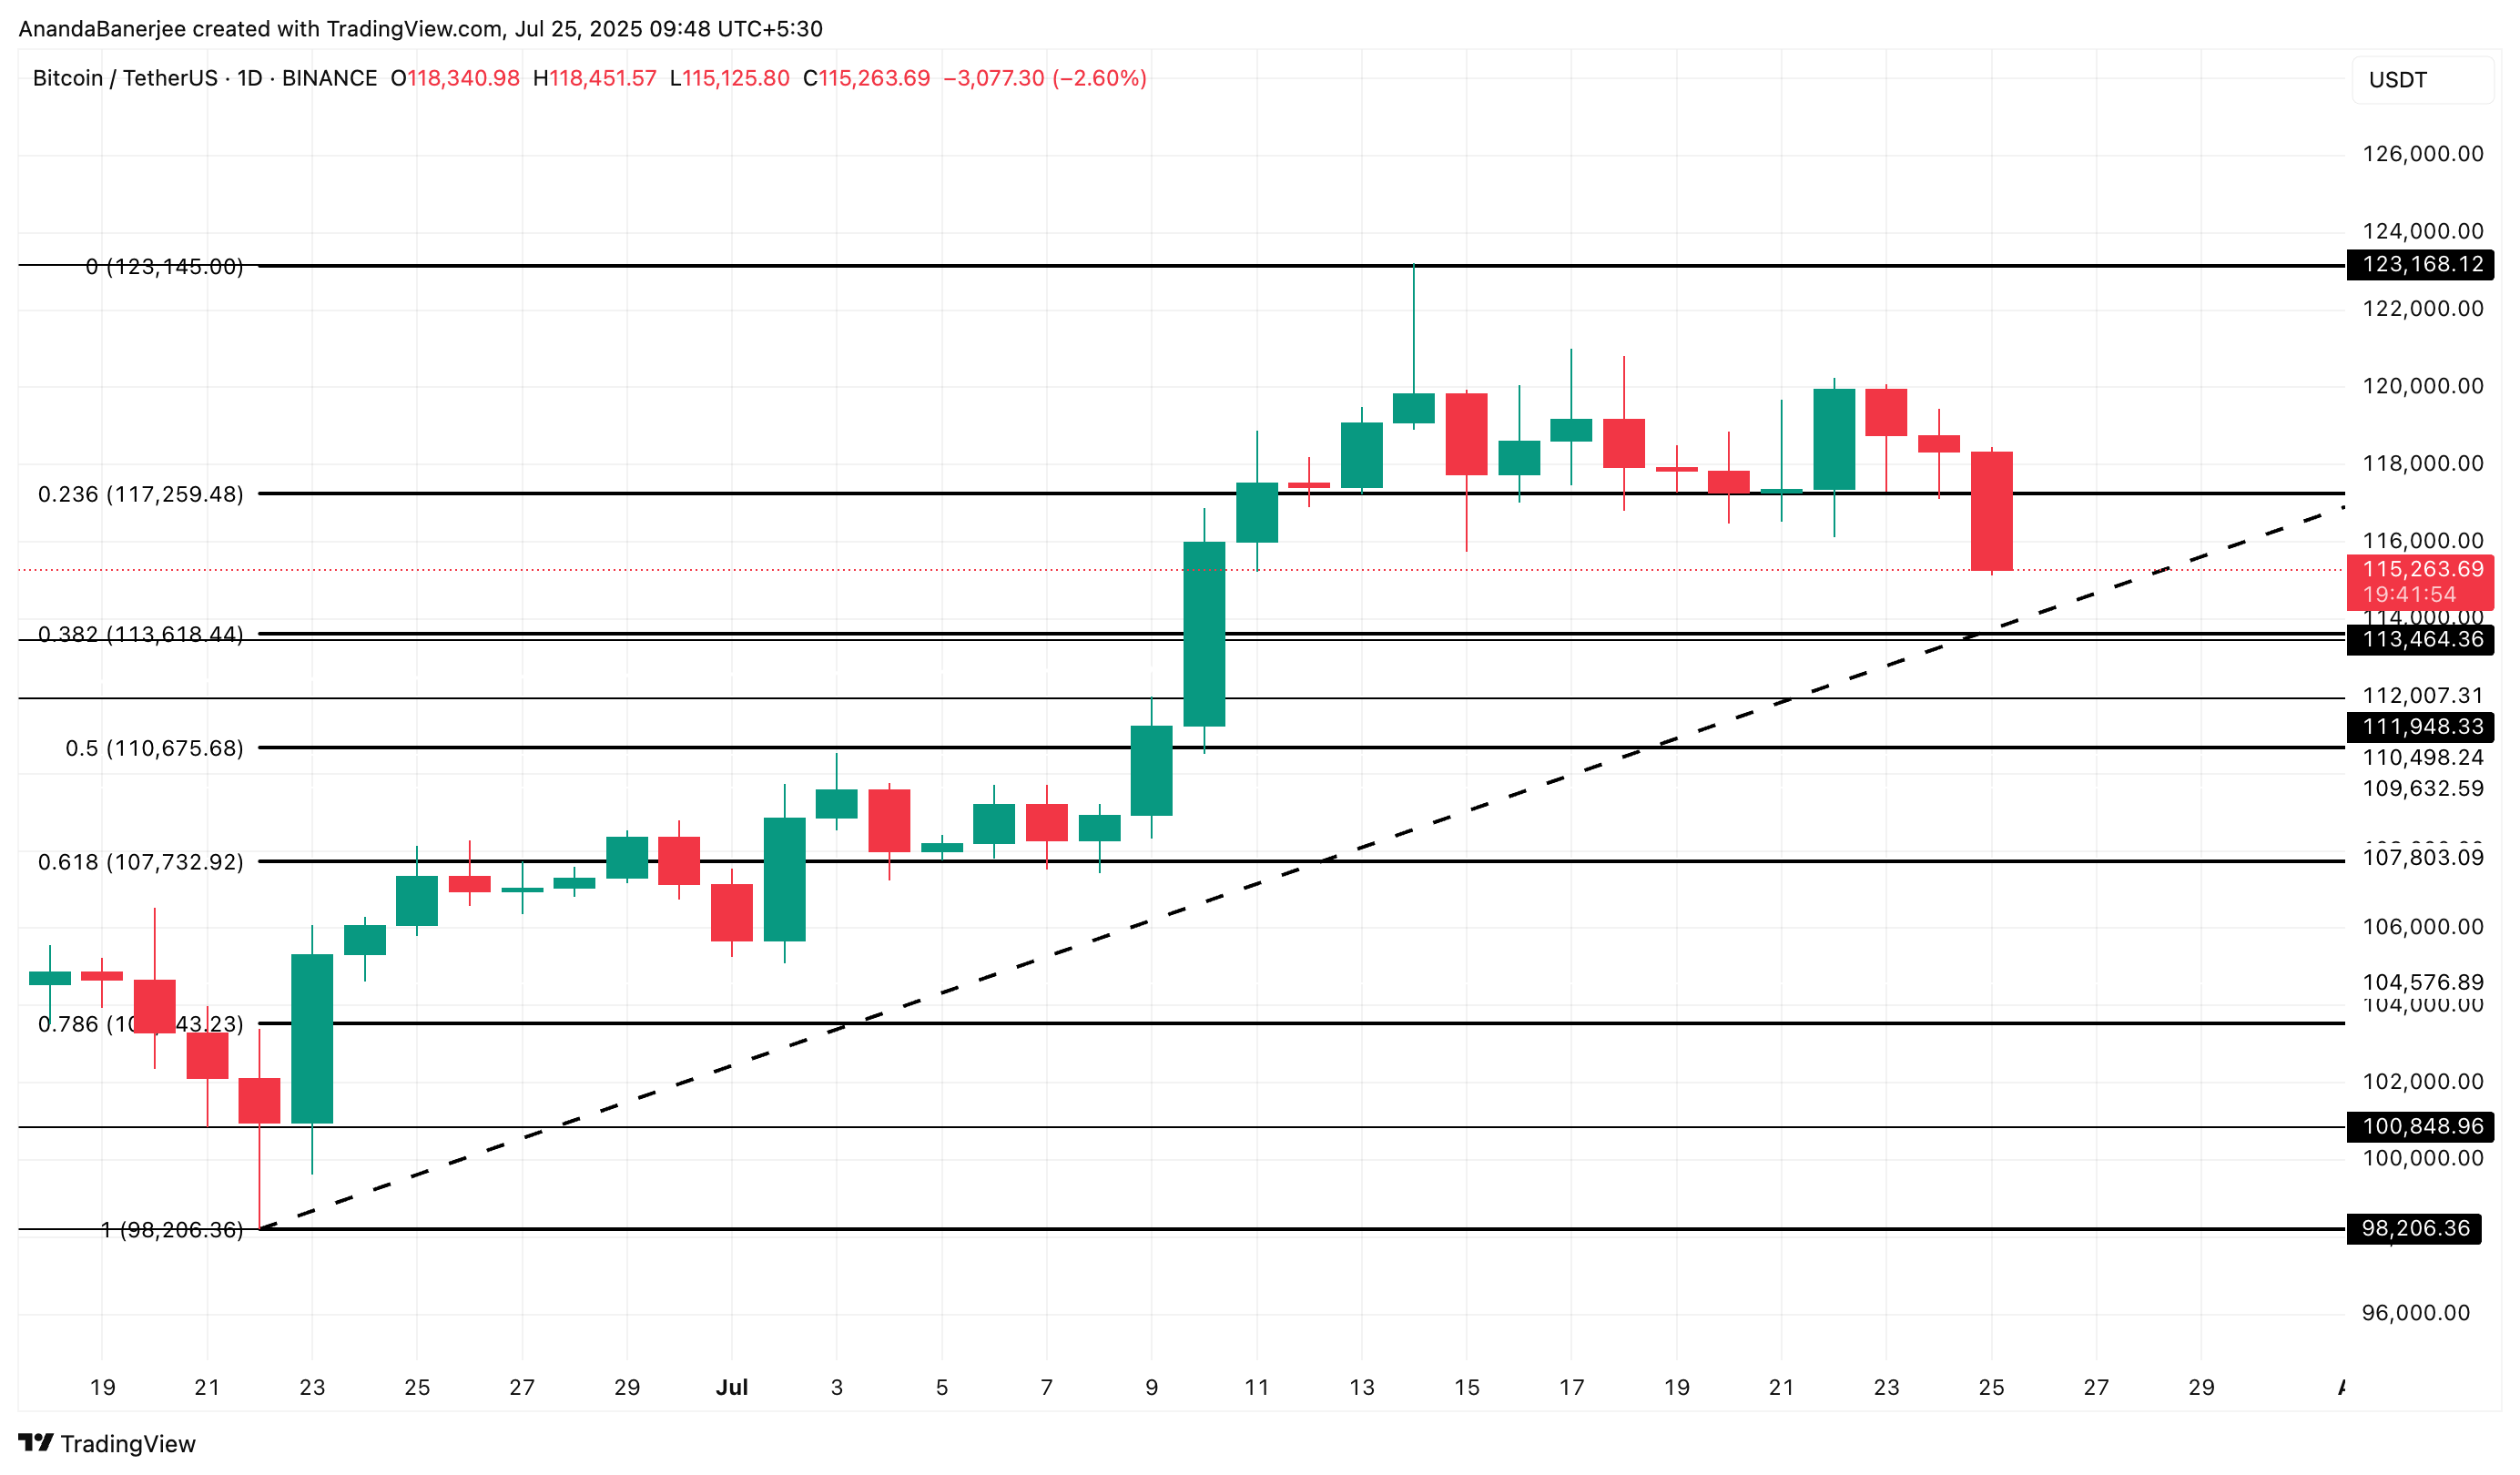
These aren’t just random lines. They reflect the broader trader psychology around pullbacks. If prices break below $113,000, the BTC price could face a deeper correction. Combined with bearish EMA patterns and rising whale-to-exchange activity, the risk of a Bitcoin crash remains elevated.
However, if the Bitcoin price manages to reclaim $117,00 and the previously made all-time high of almost $123,000, the bearish structure could break down, real soon. However, for that, big names in the Bitcoin space might need to come back to the party.
