On July 29, 2019, the Bitcoin price reached a low of $9101. An upward move ensued. BTC reached a high of $12,325 on August 6. It has been decreasing since, trading between $11,400 and $12,200.
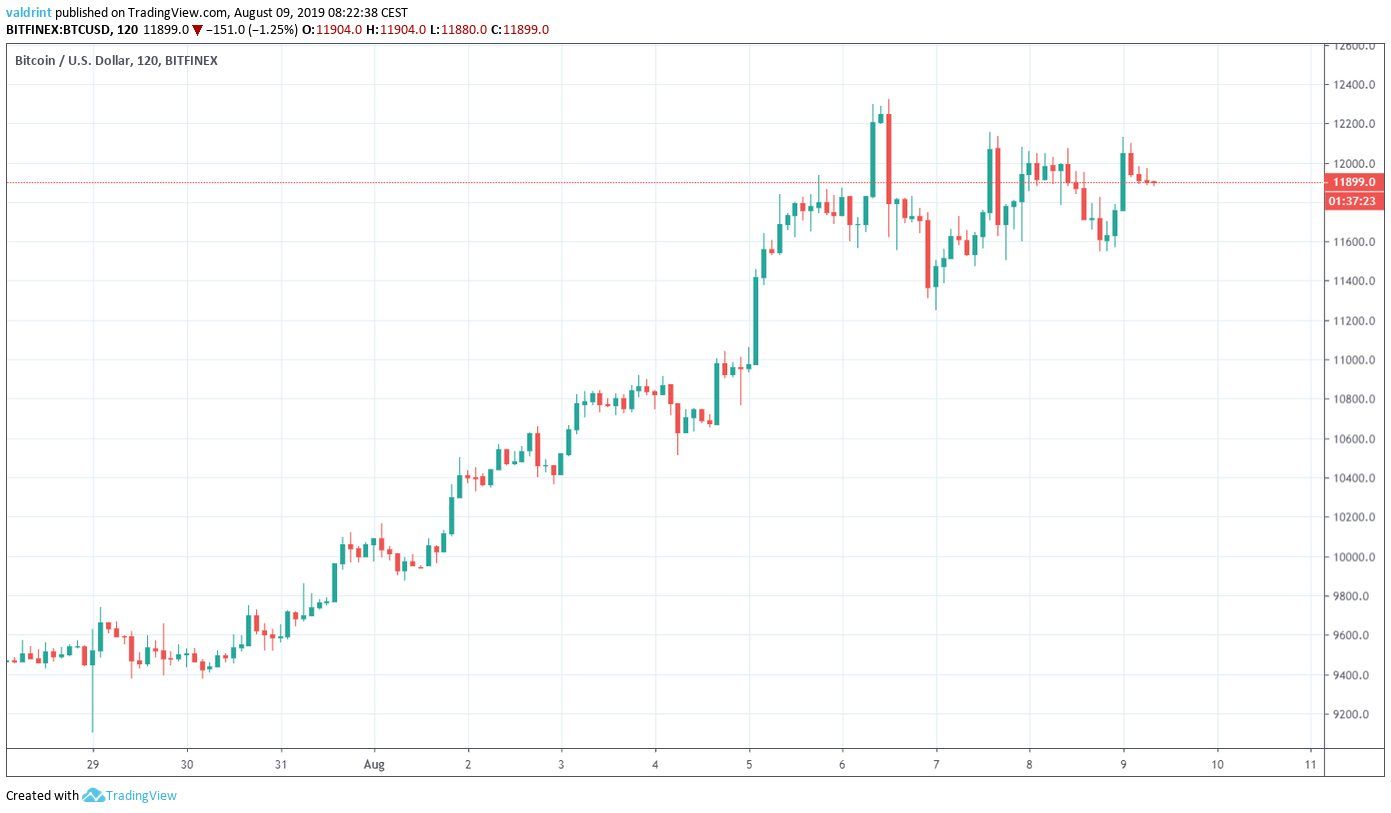
Will Bitcoin target $13,000 or are further decreases in store? Continue reading below if you are interested in finding out.
For our previous analysis, click here.
If you are interested in margin trading Bitcoin (BTC) and other cryptocurrencies with a multiplier of up to 100x on our new partner exchange with the lowest fees, follow this link to get a free StormGain account!
Bitcoin Price: Trends and Highlights for August 9
- BTC/USD is trading inside a descending channel.
- It is following a short-term ascending support line.
- There is bearish divergence both in the long- and in the short-term.
- There is support at $10,800.
Current Pattern
A look at the daily chart shows that BTC has been trading inside a descending channel since June 26.
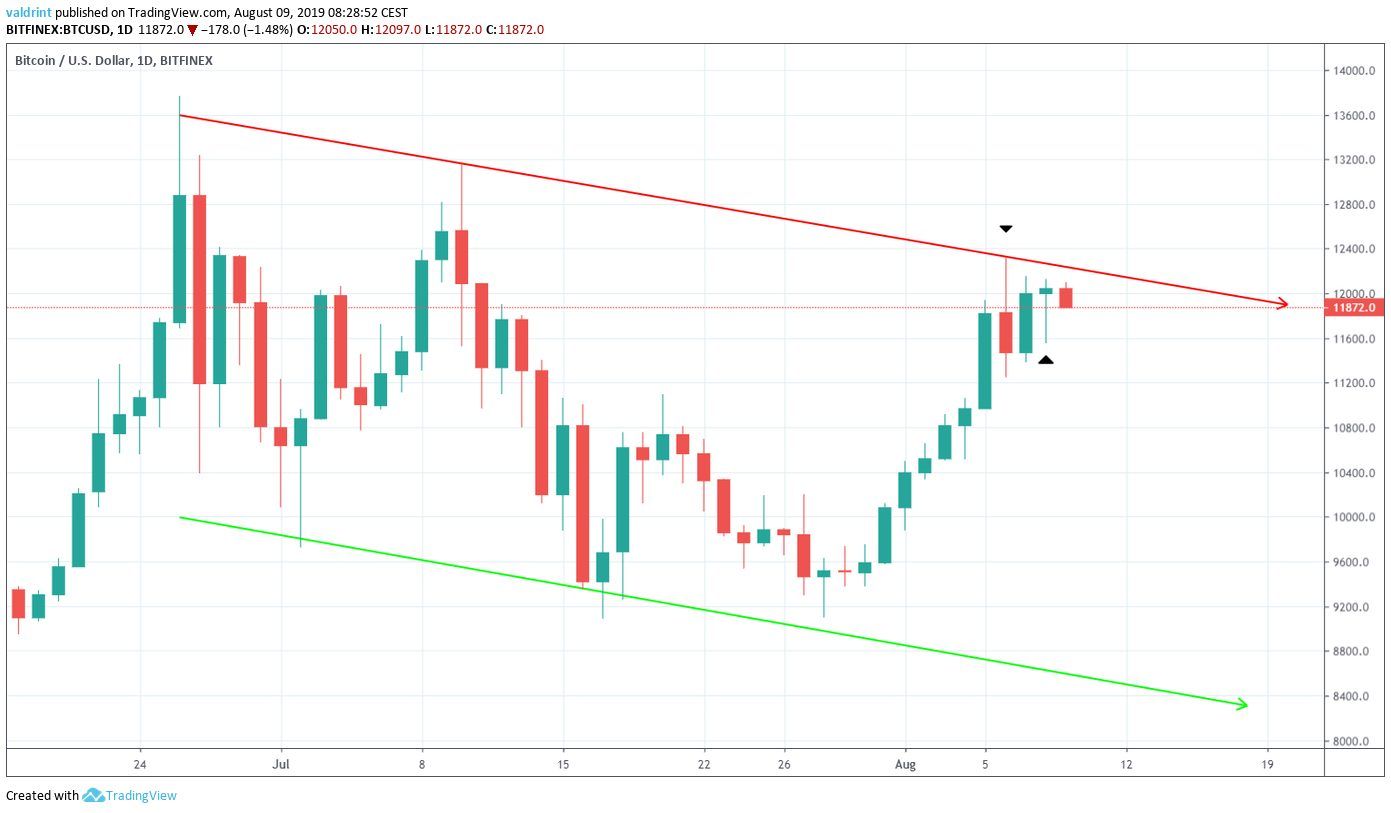
At the time of writing, it was very close to the resistance line.
It reached this line on August 6, before decreasing sharply.
It generated a bearish harami, which is often considered a sign of reversal.
However, it continued to increase. It showed significant strength on August 7, rebounding very well from the inter-day decrease to create a bullish hammer.
Will the Bitcoin price break out? Let’s take a look at technical indicators to see if that is likely.
Sign up at the world’s largest exchange, Binance, to trade Bitcoin and other cryptocurrencies with ease.
Signs of Weakness
A look at the RSI shows that while the price rebounded nicely from the decrease on August 5, the RSI did not.
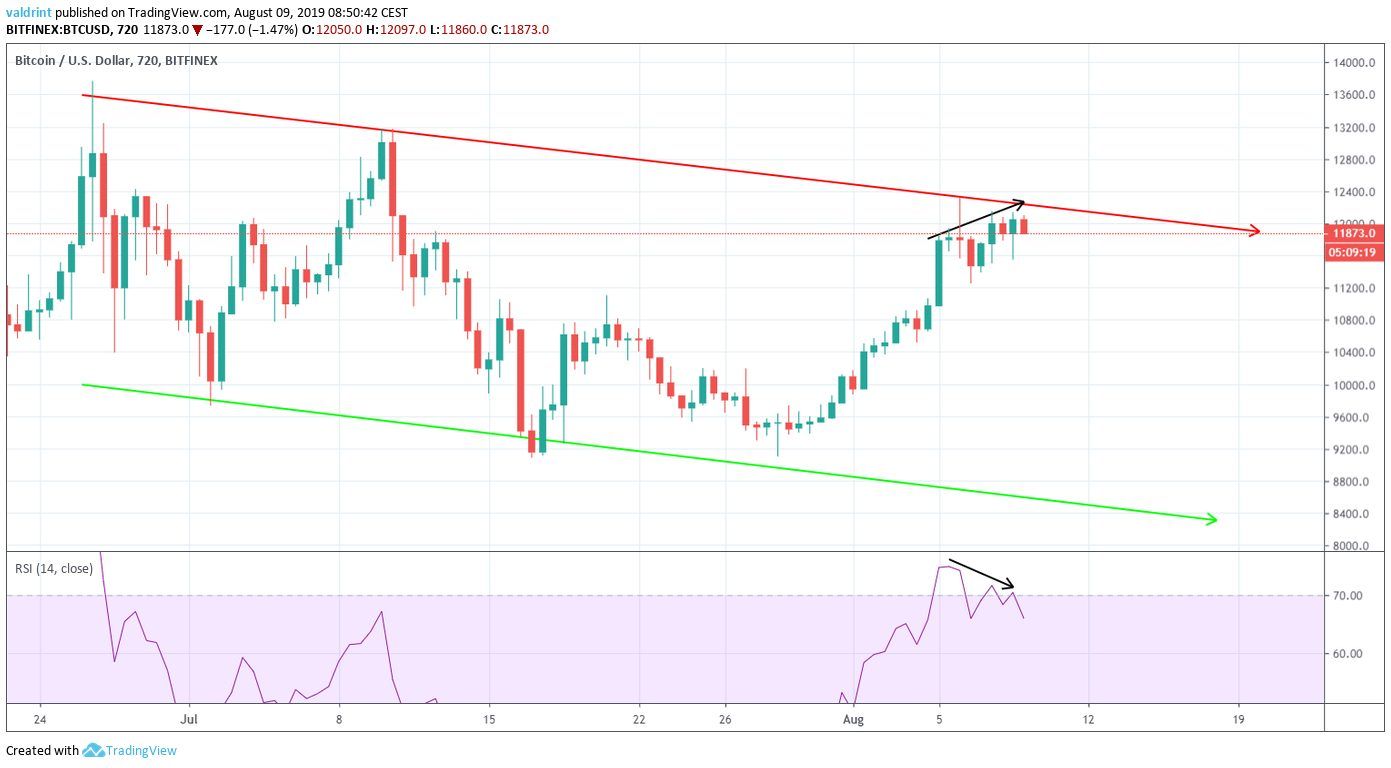
It has been generating bearish divergence.
While the divergence is also present in the daily time-frame, it is much more clearly visible in the 12-hour one.
The fact that it is occurring right on the resistance line increases its validity and makes a breakout unlikely.
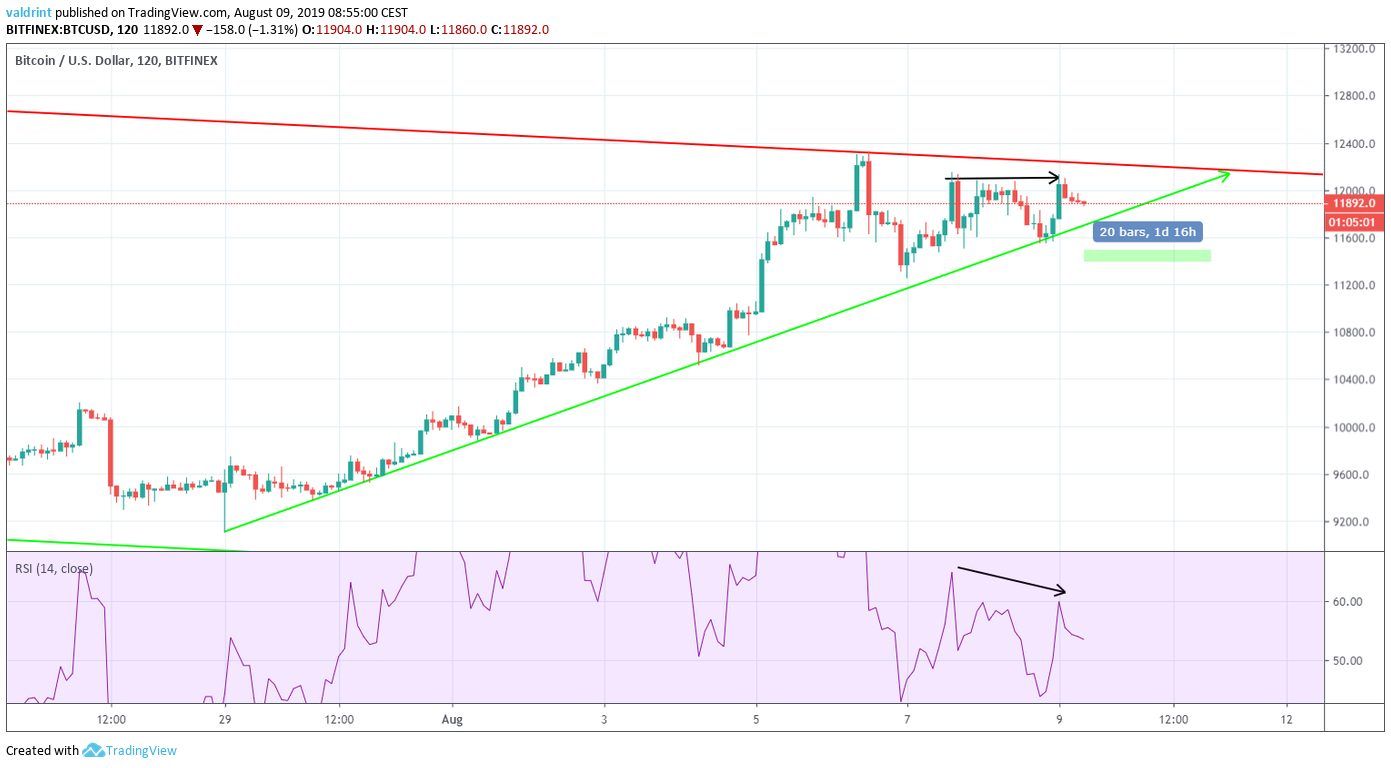
A look at the two-hour time-frame shows that the Bitcoin price has been following an ascending support line, which when combined with the resistance from the channel, creates a symmetrical triangle.
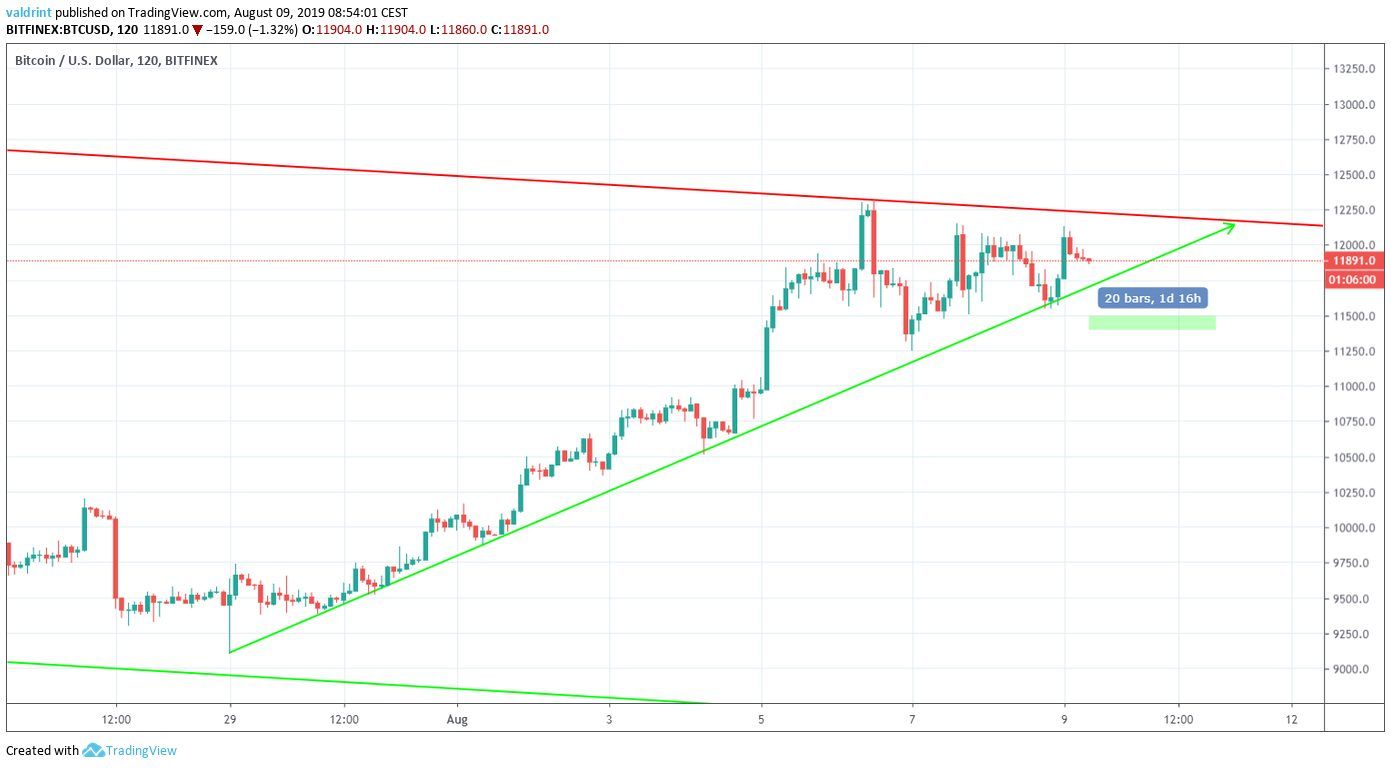
Additionally, BTC is approaching the end of the triangle, projected to be in less than two days.
Similar to the 12-hour time-frame, there is short-term bearish divergence developing in the RSI.
The divergence is especially visible during the two highs near $12,000 reached on August 7.
The Bitcoin price has been trying to break out of this resistance for the past four days.
Combining this with the bearish divergence in multiple time-frames makes us believe that BTC will eventually break down from the support line.
If that happens, let’s try and predict where the price will go next.
Future Movement
One outline for possible future Bitcoin price movement is given below:

We can see that there is a support area near $10,800.
According to our analysis, BTC is likely to break down from the support line and reach it.
Bitcoin Price Summary
The Bitcoin price is trading very close to the resistance line of a descending channel.
According to our analysis, it will soon begin a downward move and reach the support area outlined below.
Do you think BTC will continue decreasing? Let us know in the comments below.
Disclaimer: This article is not trading advice and should not be construed as such. Always consult a trained financial professional before investing in cryptocurrencies, as the market is particularly volatile.
Images are courtesy of TradingView and Shutterstock.