
On August 29, 2019, the Bitcoin price reached a low of $9387. An upward move followed that lasted until September 6, culminating with a high of $10,900. The price has been decreasing since. At the time of writing, it was trading below $10,300.
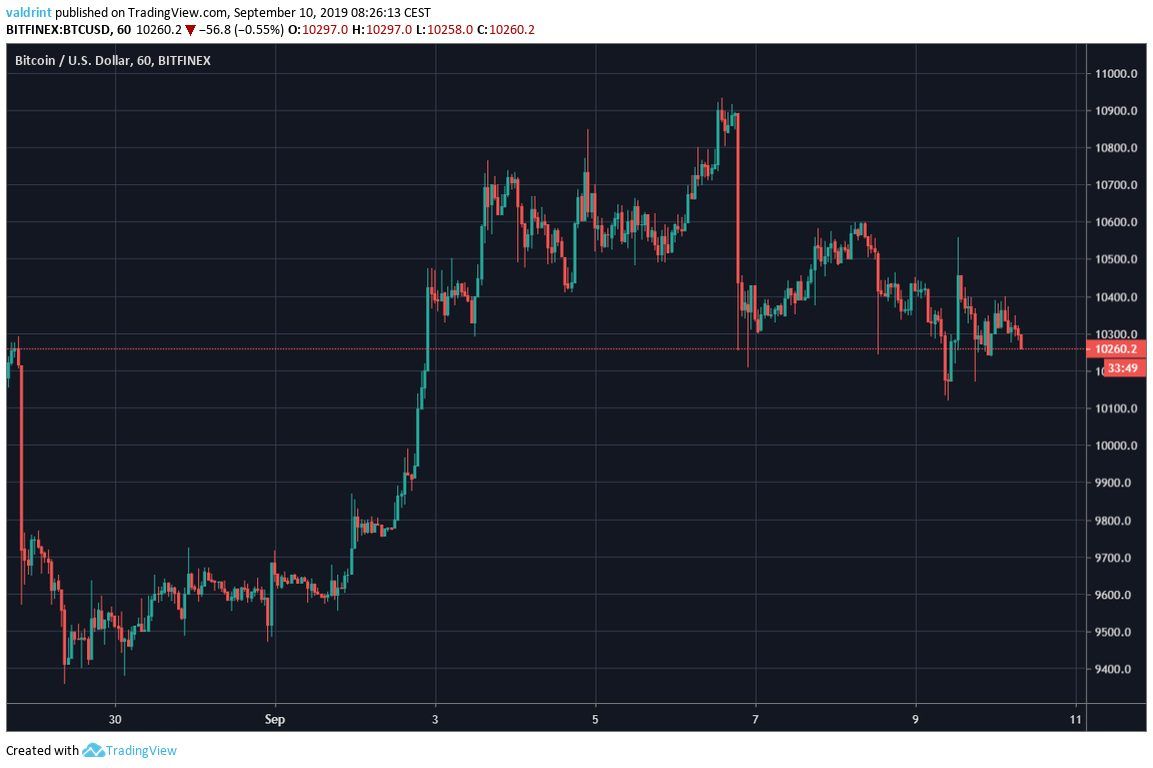
Where will BTC go next? Continue reading if you want to find out.
For our previous analysis, click here.
Bitcoin Price: Trends and Highlights for September 10
- BTC/USD is trading inside a short-term descending wedge.
- There is support between $10,000-$10,100.
- Daily moving averages have made a bearish cross.
- BTC has created a bearish shooting star.
Descending Wedge
A look at the hourly time-frame shows that the BTC price is likely trading inside a descending wedge.
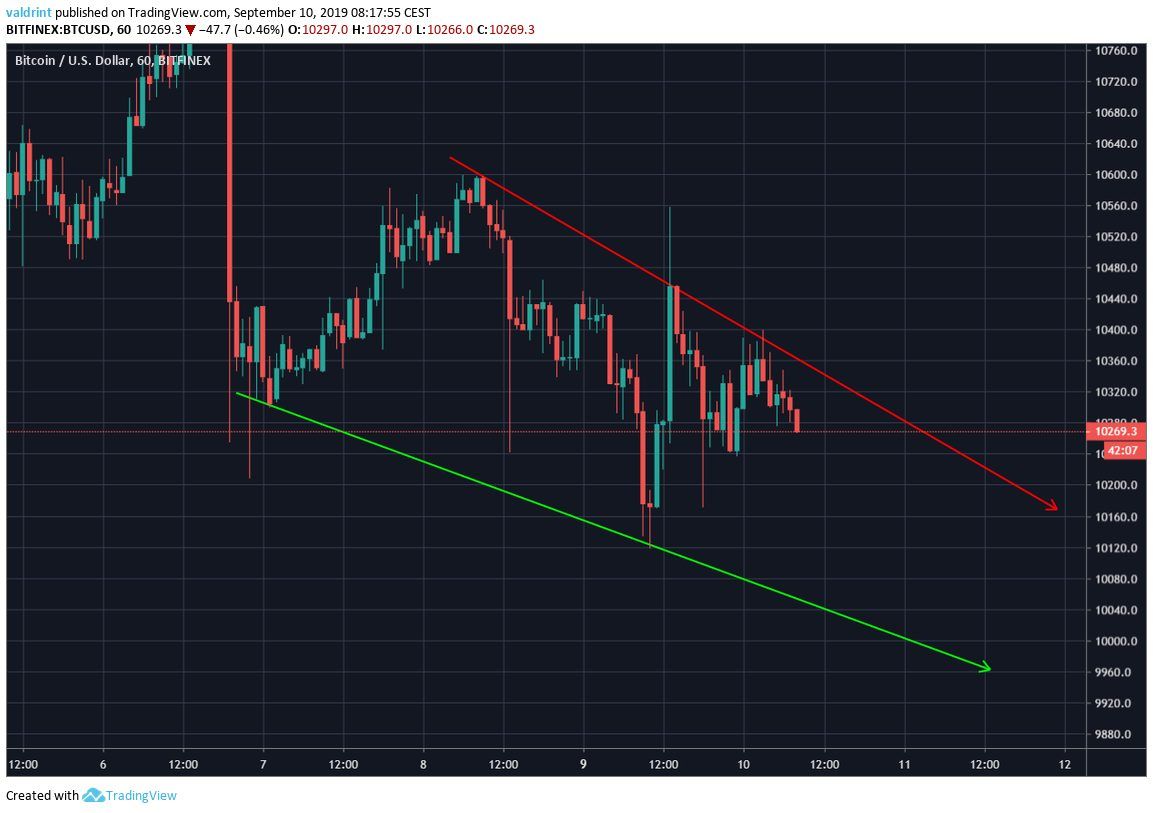
The descending wedge is considered a bullish pattern, making a Bitcoin price breakout more likely.
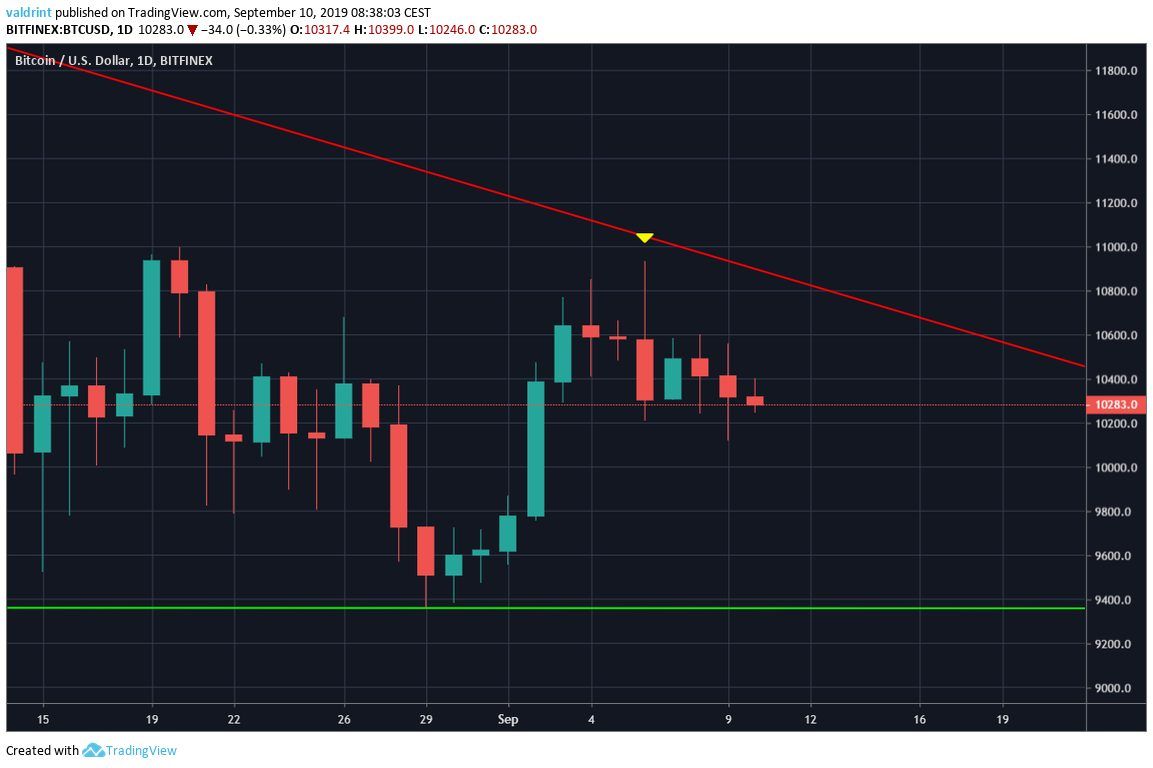
Support
Looking at a longer-term time-frame, we can see two minor support areas, one at $10,100 and the other at $10,000.
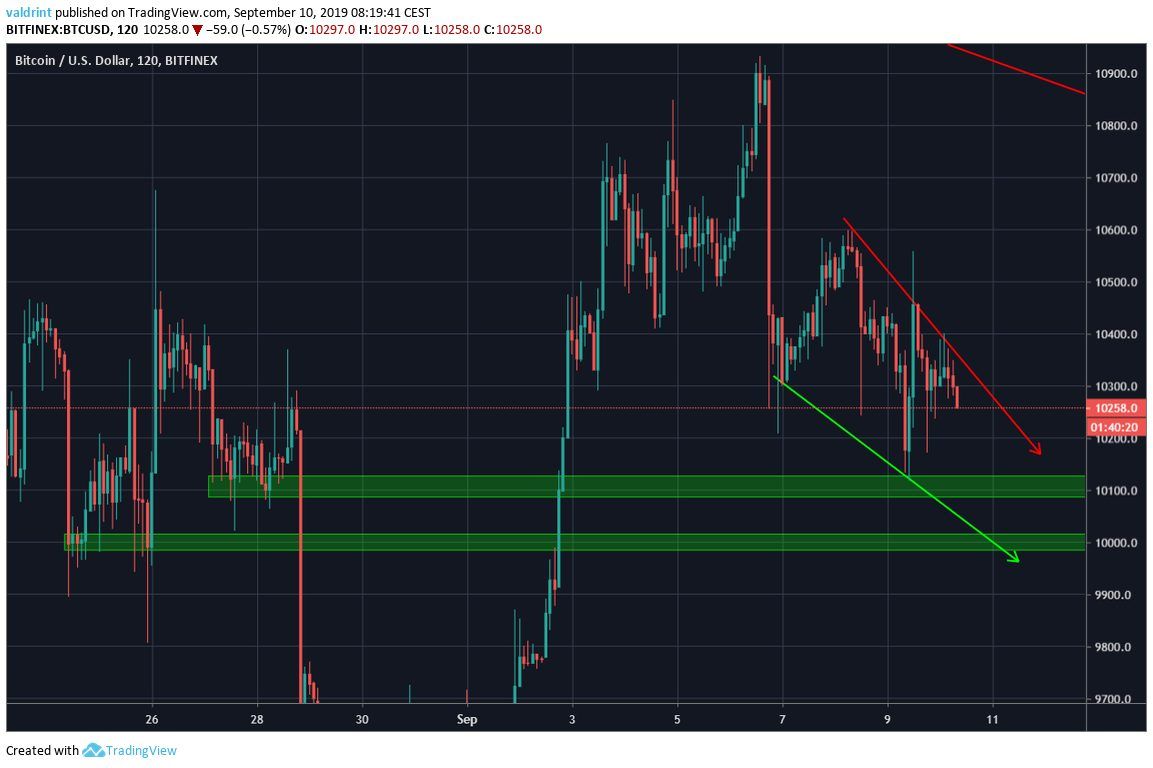
Since the descending wedge is considered a bullish pattern, a drop towards the second, validating the support line followed by a breakout could be likely.
Furthermore, connecting the lows beginning on August 29, the low discussed in the introduction, gives us an ascending support line that is currently right below our support areas.
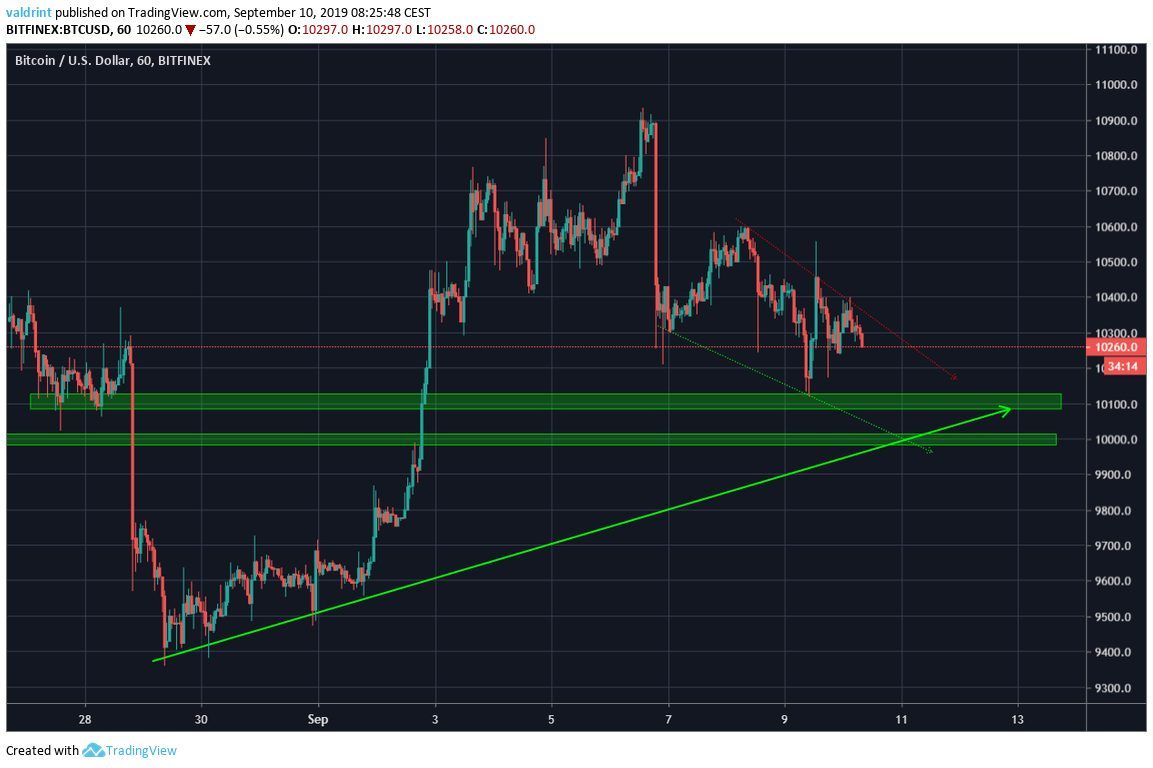
This further increases the significance of the $10,000 support and makes it a likely place for the initiation of a reversal.
Bitcoin Price Moving Averages
A look at the daily moving averages indicates that further price decreases could be in store.
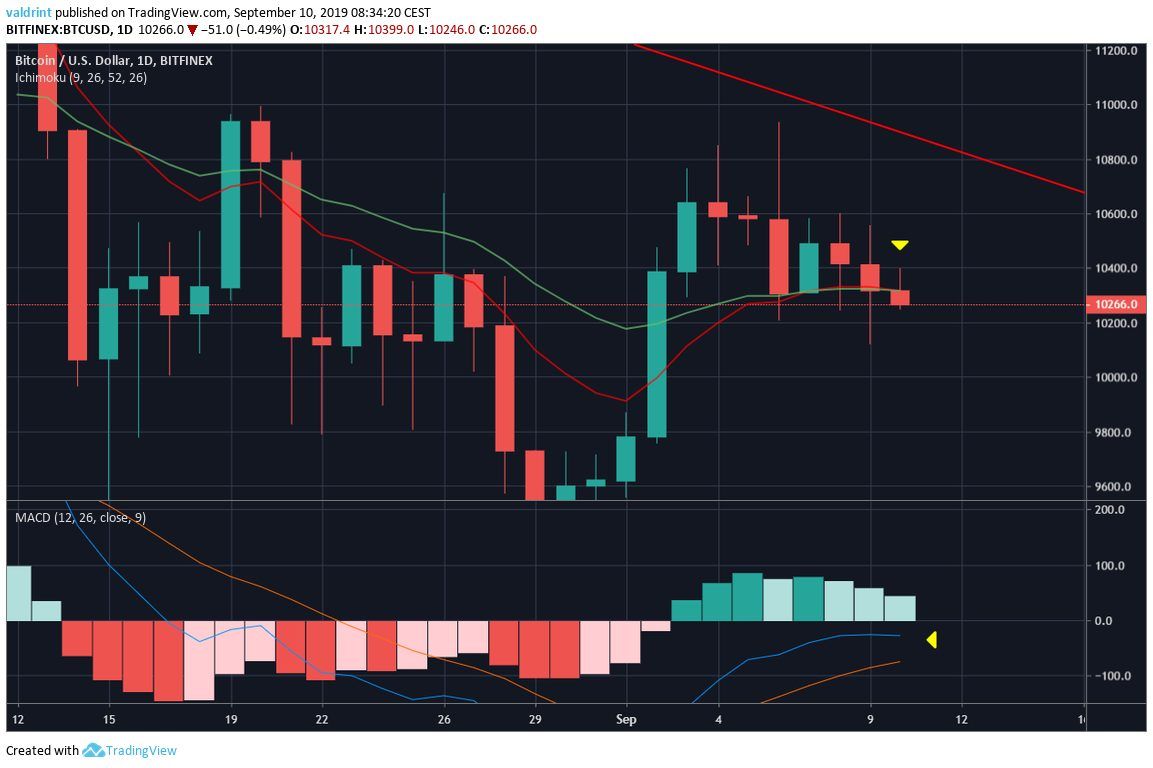
The 10- and 20-day MAs have just made a bearish cross.
The Bitcoin price is trading below them, facing very close resistance from both.
Additionally, the MACD has been rejected by the “0” line and looks ready to fall, possibly making a bearish cross.
Another sign of reversal is found by looking at the daily candlesticks:
The price made a bearish candle resembling a shooting star on September 6.
This followed a period of rapid increase.
Combining these readings makes us confident that BTC will decrease and reach our support area.
Future Movement
An outline of possible future Bitcoin price movement is given below:
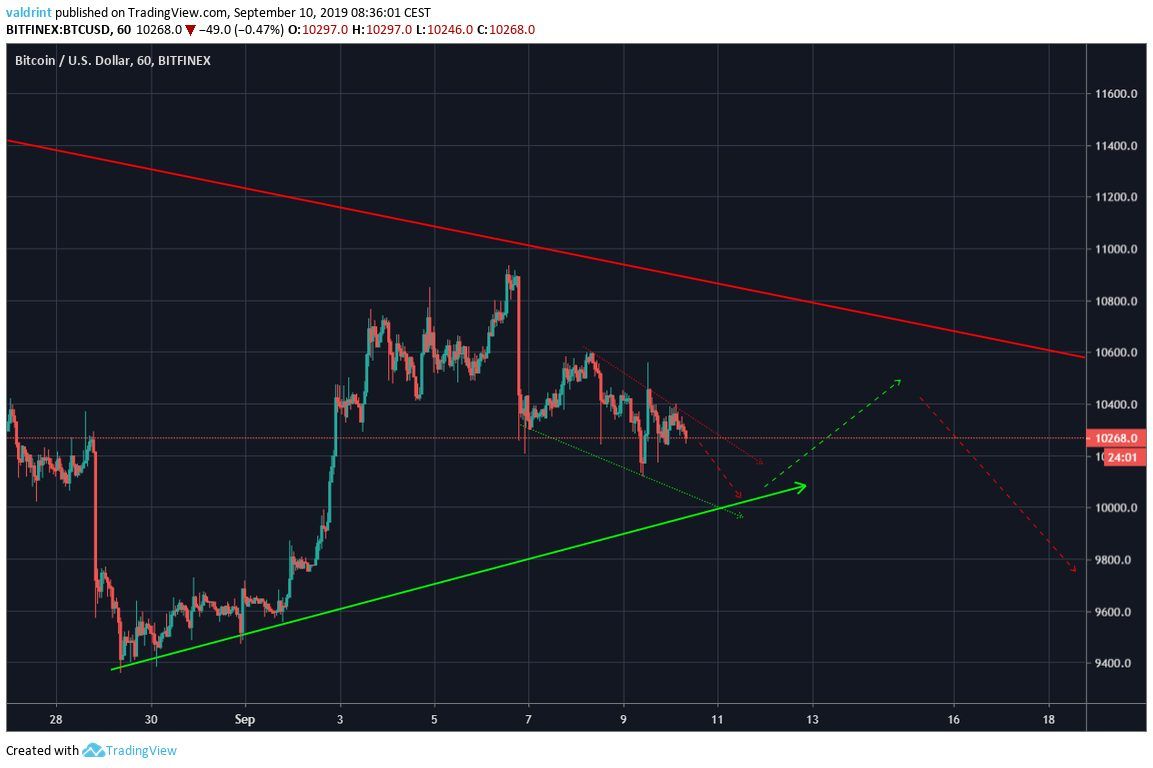
BTC is likely to decrease until it reaches the ascending support line, before breaking out towards the long-term descending resistance line.
Afterward, it should continue its downward movement.
Bitcoin Price Summary
The Bitcoin price is trading inside a descending wedge
According to our analysis, it is likely to break out from the wedge, after a short-term decrease.
For trading purposes, we believe the proper move would be to stay out of the market until a decisive move occurs.
Do you think the Bitcoin price will break out from the wedge? Let us know in the comments below.

Disclaimer: This article is not trading advice and should not be construed as such. Always consult a trained financial professional before investing in cryptocurrencies, as the market is particularly volatile.
Images are courtesy of Shutterstock, TradingView.
