


On September 19, 2019, the Bitcoin price reached a low of $9810. An upward move ensued shortly after and BTC reached a high of $10,487 during the same day. It has been decreasing since. On September 22, it reached a low of $9880.
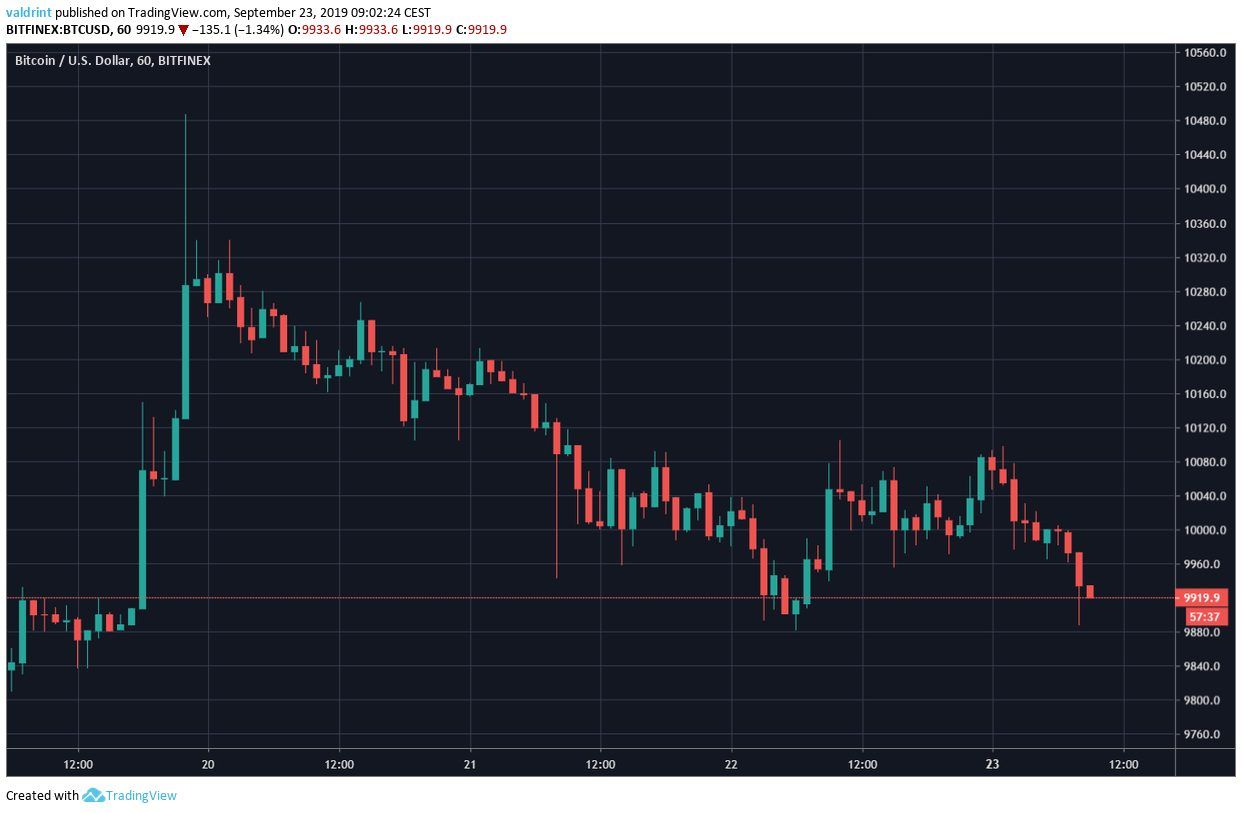
Will the Bitcoin price continue trading below $10,000 or will it begin a reversal? Keep reading below if you want to find out.
For our previous analysis, click here.
Bitcoin Price: Trends and Highlights for September 23
- BTC/USD is trading inside a descending triangle.
- It has found support above the 100-day moving average.
- There is support at $9900.
- There is resistance at $10,100.
- BTC is trading inside a short-term horizontal channel.
- There is short-term bullish divergence developing in the RSI & MACD.
Long-Term Bitcoin Price Pattern
A look at the daily chart shows that the Bitcoin price has been trading inside a descending triangle since June 26.
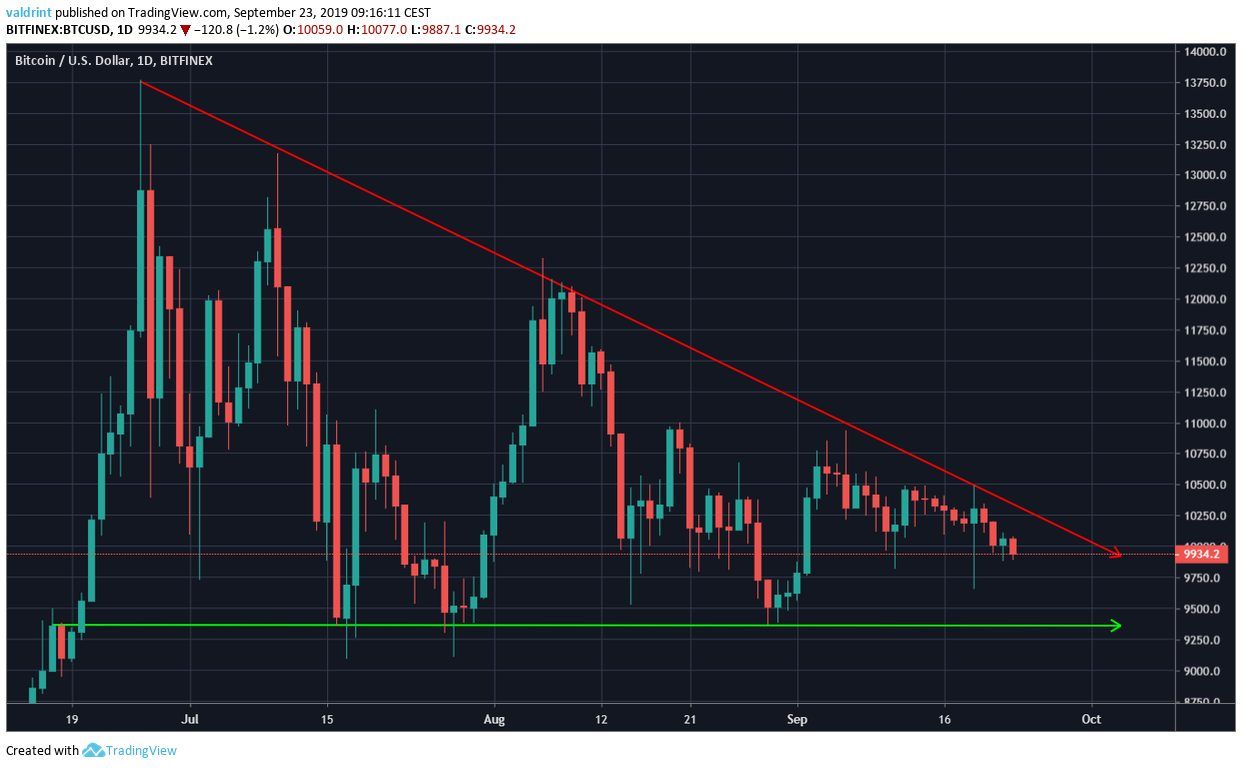
It reached the resistance line on September 19 and has been gradually decreasing since.
When we look at the moving averages (MA) we can see that the Bitcoin price is attempting to move lower towards the support line.
The 10- and 20-day MAs have made a bearish cross on September 16 and have been providing close resistance to the price since.
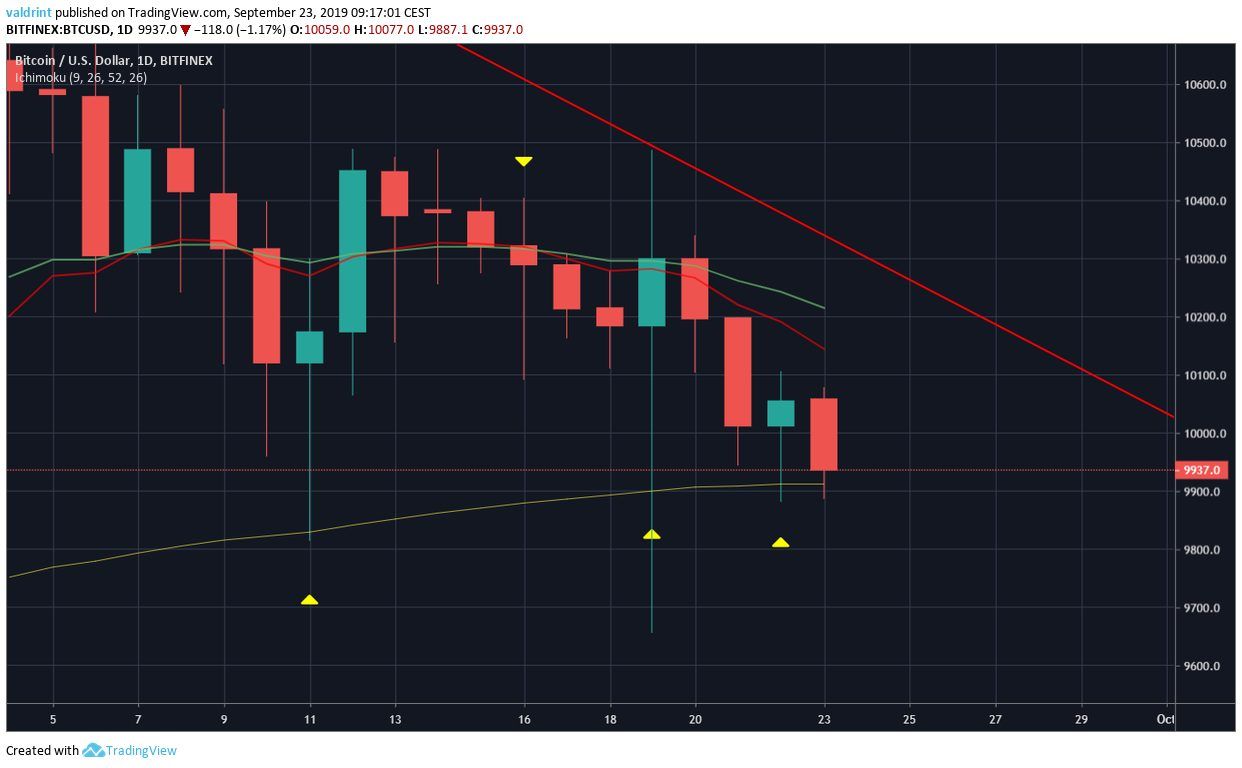
However, Bitcoin is trading above its 100-day MA, which has offered significant support throughout the month.
However, BTC followed the bullish doji on September 22 with today’s bearish candle — which looks like it will decrease below the MA.
If it were to do so, it would likely cause a rapid fall towards the support line.
Let’s take a look at a different time-frame and see if that is likely.
Horizontal Channel
Looking back at the upward move discussed in the introduction, we can see that the Bitcoin price has retraced all the way to the significant 0.88 Fibonacci level.
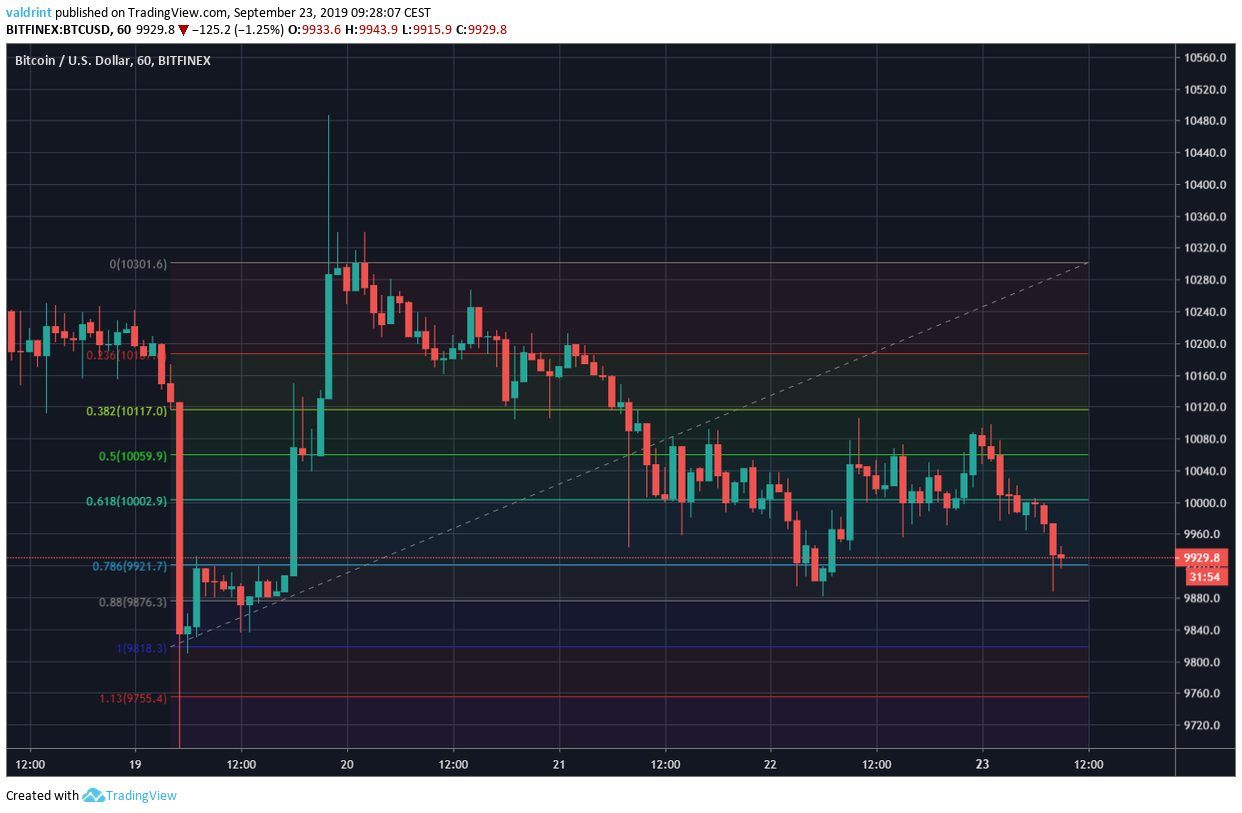
It reached this level on September 22 and again on September 23.
We can also see that the Bitcoin price is likely trading inside a horizontal channel, with support and resistance at $9900 and $10,100 respectively.
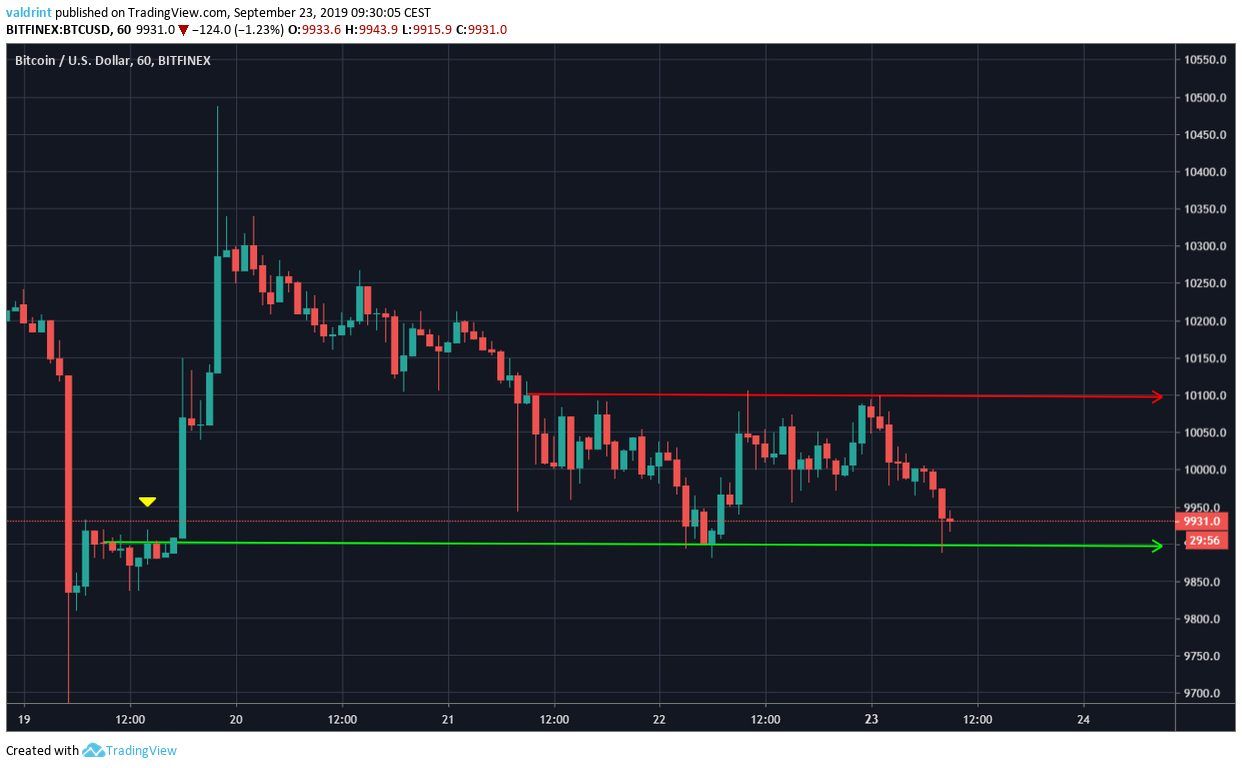
The support line previously acted as resistance on September 19.
At the time of writing, the Bitcoin price was trading very close to the support line.
Possible Upward Move
Incorporating the RSI & MACD, we can see that the Bitcoin price wants to initiate an upward move towards resistance.
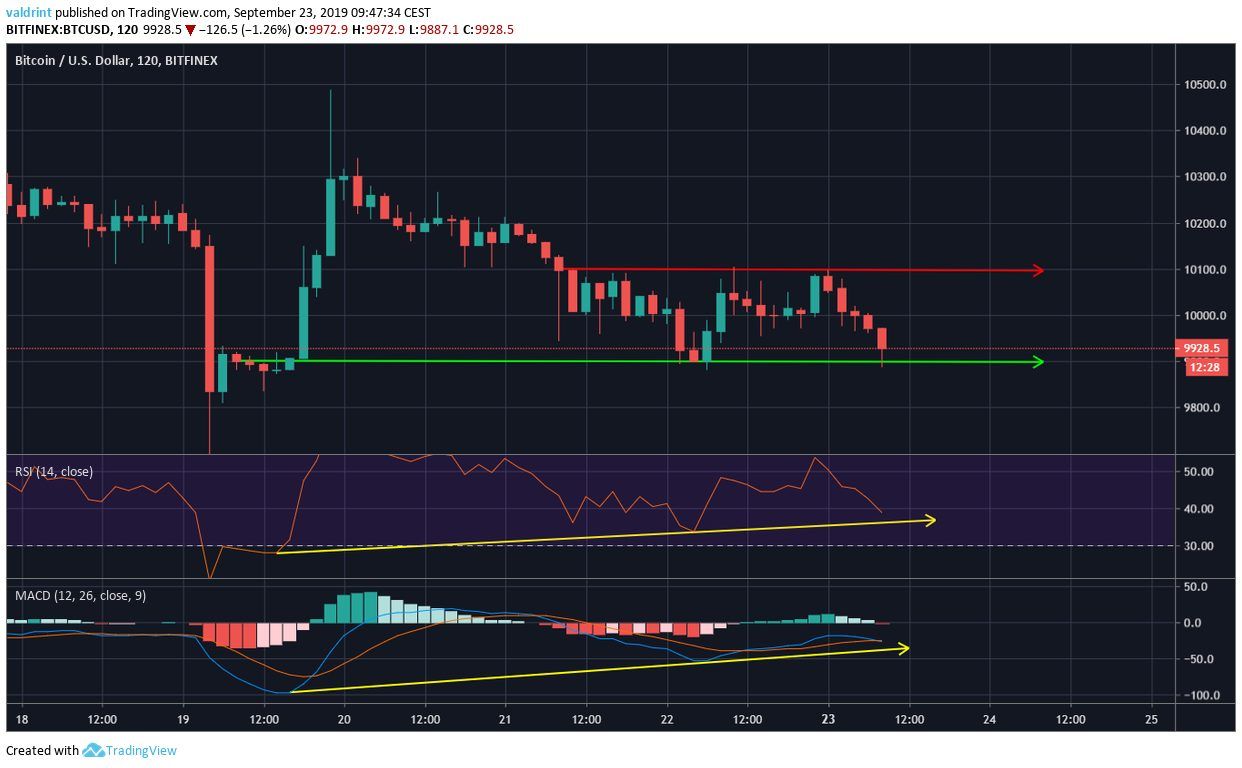
Both of them have generated bullish divergence, which is visible in time-frames for up to six hours.
Combining this with the strong support offered by the 100-day MA makes us believe that BTC will soon begin an upward move towards the resistance line.
Additionally, we do not think that it will decrease below the 100-day MA today. However, we believe it will eventually do so.

Summary
The Bitcoin price is trading inside a short-term horizontal channel and a long-term descending triangle.
According to our analysis, it is likely to move towards the resistance line of this channel.
However, we expect BTC to eventually break down and reach the support line of the triangle at $9400.
Therefore, for hypothetical trading purposes, we consider BTC a sell near the resistance line of the channel at $10,100.
Do you think the Bitcoin price will reach the support line of the triangle? Let us know in the comments below.
Disclaimer: This article is not trading advice and should not be construed as such. Always consult a trained financial professional before investing in cryptocurrencies, as the market is particularly volatile.
Images are courtesy of Shutterstock, TradingView.


