
On July 27, 2019, the Bitcoin price reached a high of $10,222. A rapid decrease ensued. The price traded between $9400-$9600 until July 31, when an upward move began. It has been increasing since.
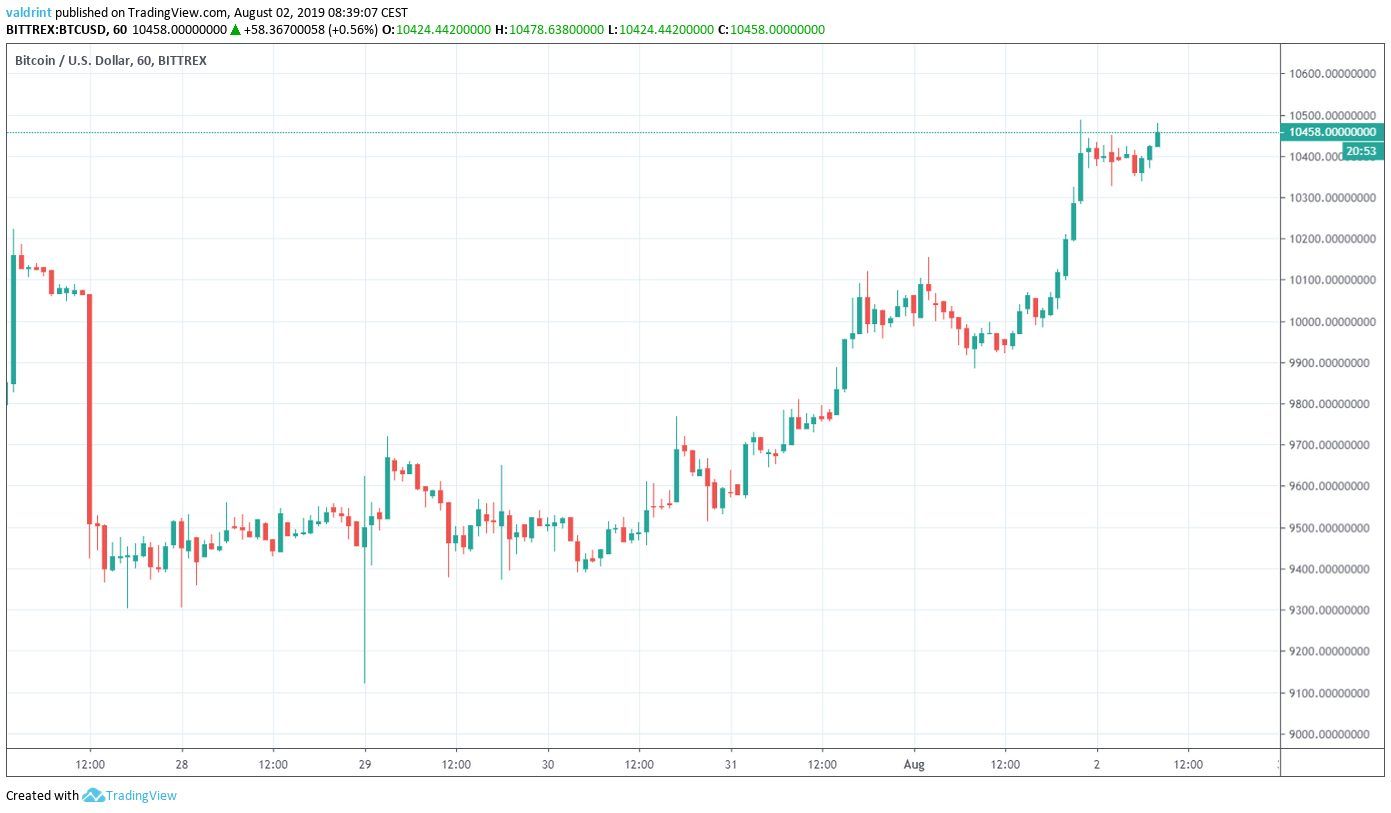
At the time of writing, BTC was trading close to $10,500.
Until when is it going to continue to increase? Continue reading if you want to find out.
For our previous analysis, click here.
Are you looking for the easiest way to purchase Bitcoin (BTC) and other cryptocurrencies? Check out our partner exchange. Follow this link to get a free XCOEX account!
Bitcoin Price: Trends and Highlights for August 2
- BTC/USD is trading inside an ascending broadening wedge.
- There is short-term bearish divergence developing in the RSI.
- Resistance areas can be found at $10,700 and $11,000.
- BTC has moved above the 10- and 20-day moving averages.
Current Pattern
A look at the hourly time-frame shows that since reaching a low on July 29, BTC has been trading an ascending broadening wedge.
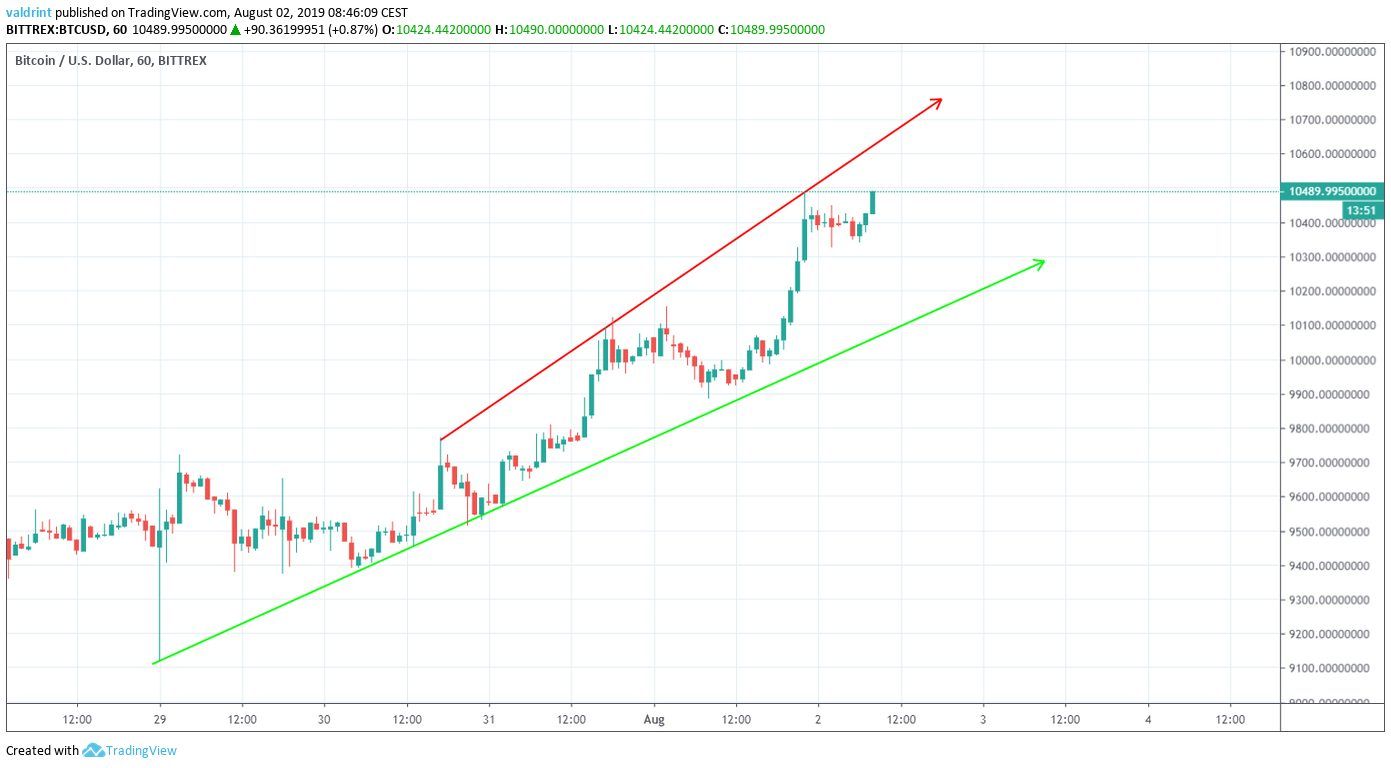
This type of wedge is considered a bearish pattern, making price breakdowns more likely.
At the time of writing, the BTC price was trading close to the resistance line of the wedge.
Possible Reversal
A look at the RSI suggests that BTC has already begun to show signs of weakness.
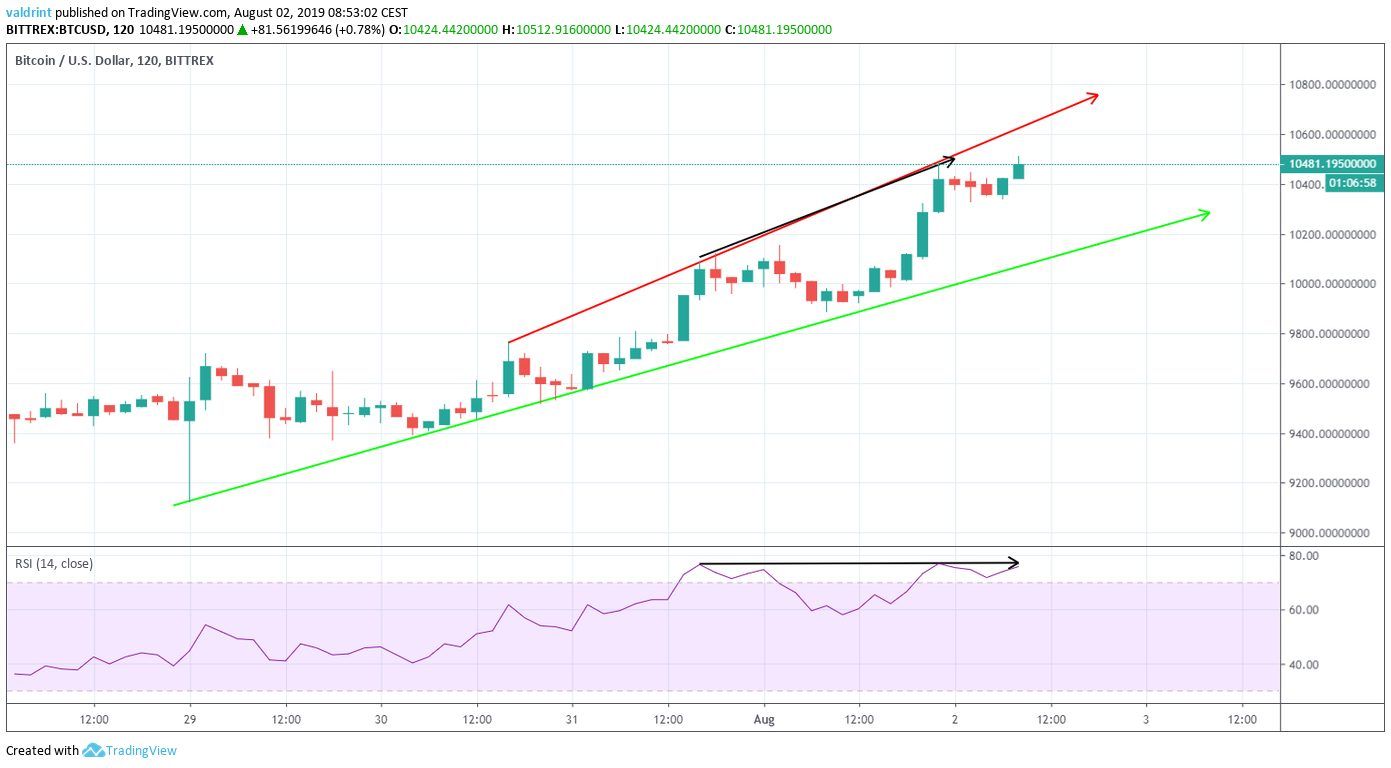
The two-hour RSI has been generating bearish divergence since July 31.
While the divergence is significant, it is only present in time-frames for up to two hours.
However, it is occurring inside a bearish pattern
This makes a drop towards the support line likely.
However, this decrease will not necessarily occur immediately.
Rather, the Bitcoin price is likely to continue increasing for a period of time until it meets resistance.
Two resistance areas which would be optimal places for the initiation of a reversal area outlined below.
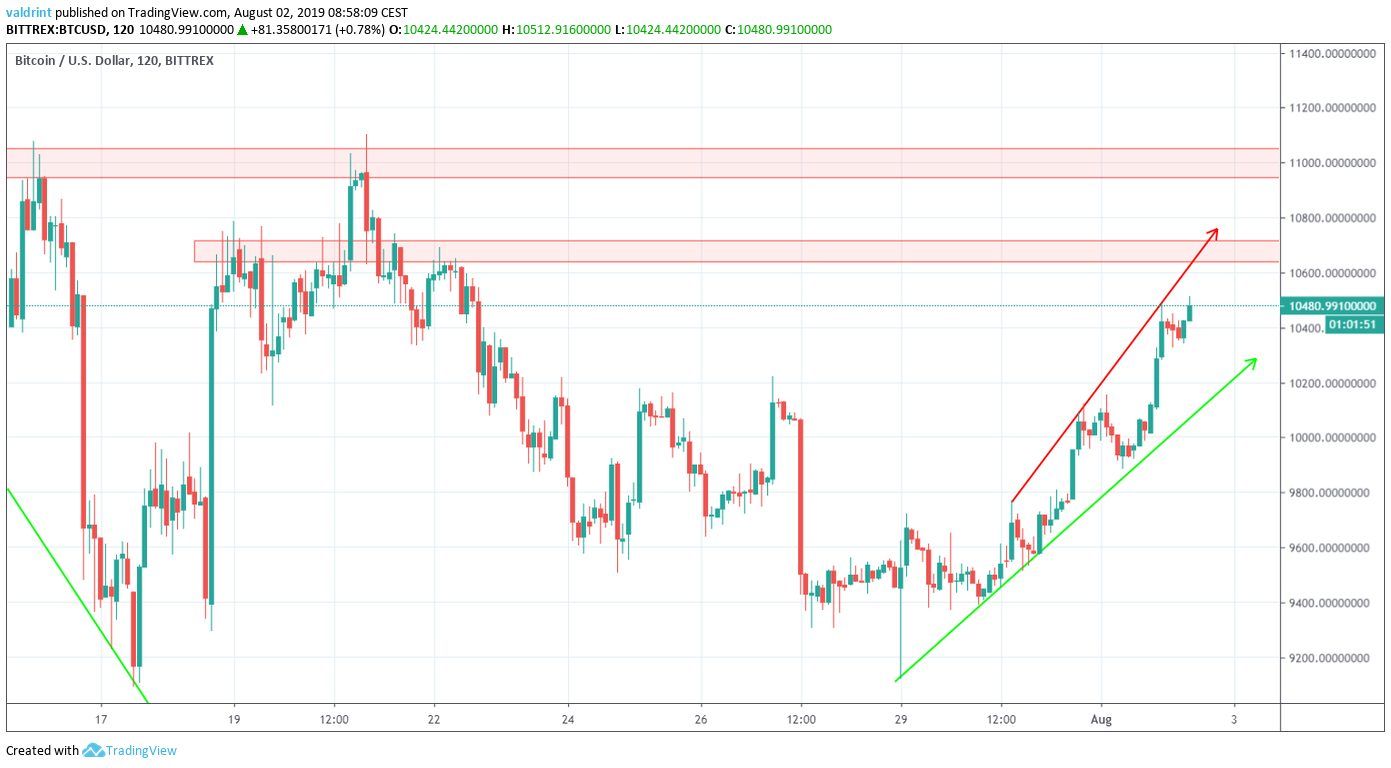
They can be found at $10,700 and $11,000.
Once the price gets there, we will again check for signs of reversal, such as a double top or evening star reversal pattern combined with a more pronounced divergence.
Beginning Of An Uptrend
A look at the daily moving averages (MA) suggests that the Bitcoin price is attempting to initiate an uptrend, but has not yet done so.
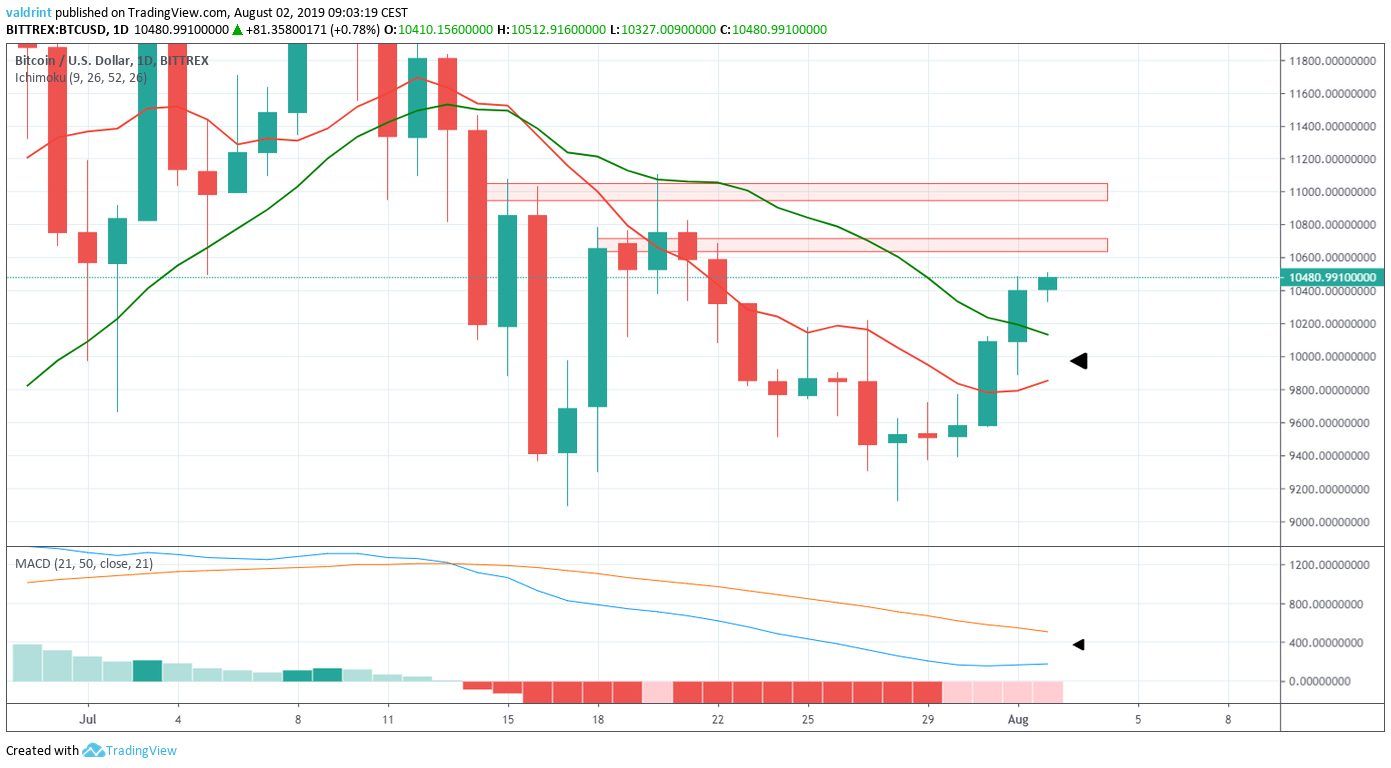
The most recent price increases took it above the 10- and 20-day MAs.
This is a bullish sign.
If a bullish cross were to occur, combined with a bullish cross in the MACD, it would act as confirmation that the price has finished correcting and a new uptrend has begun.
Bitcoin Price Summary
The BTC price is trading inside an ascending broadening wedge.
According to our analysis, it will continue increasing until it reaches at least one of the resistance areas outlined above.
Afterward, it should decrease towards the support line of the wedge.
Do you think Bitcoin will reach the resistance areas? Let us know in the comments below.
Disclaimer: This article is not trading advice and should not be construed as such. Always consult a trained financial professional before investing in cryptocurrencies, as the market is particularly volatile.
Images are courtesy of TradingView, Shutterstock.
