
On August 30, 2019, the BTC price reached a low of $9080. An upward move followed and BTC reached a high of $10,933 on September 6. It has been decreasing since — trading between $10,300 and $10,000 a range of roughly six percent.

For our previous analysis, click here.
Bitcoin Price: Trends and Highlights for September 18
- BTC/USD is trading inside a symmetrical triangle.
- It has made a double top near $11,000.
- The Bitcoin price is trading inside a longer-term descending triangle.
- Daily moving averages have made a bearish cross.
- There is support at $10,000 and $9800.
Current Bitcoin Price Pattern
A look at the hourly time-frame shows that BTC has been trading inside a symmetrical triangle since reaching a low on August 30.

At the time of writing, it was approaching the end of the triangle — which is projected to be on September 20.
At that time, a decisive move is likely to occur. What will be the direction of this move?
Wave Count
A look at a longer-term time-frame shows us that BTC has been trading inside a descending triangle since June 26.

Furthermore, on August 10, a rapid downward move was initiated, causing the price to decrease all the way to the support line.
We believe this move holds serious importance since the price has struggled to initiate significant upward movement since.
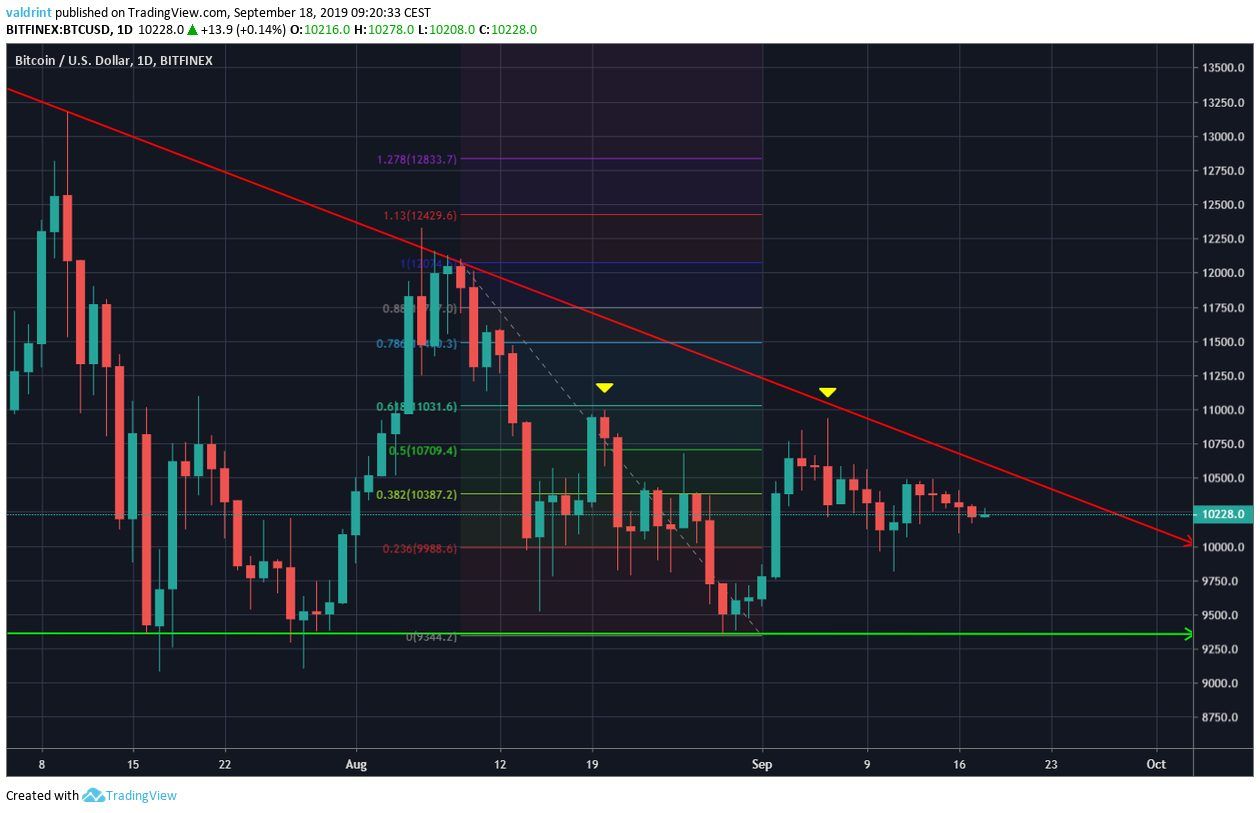
Since then, BTC has struggled to move above the 0.618 fib level, which is at $11,000.
Additionally, the second time it reached it, on September 5, it created a bearish hammer with a long upper wick.
The similar highs on August 19 and September 5 resemble a double top, which is a bearish pattern.
The fact that this is occurring at a significant resistance area and the creation of a long upper wick on September 5 makes us believe that further decreases await.
Key Downtrend Levels
Looking at the daily moving averages (MA) and the MACD reiterates the bearish sentiment.
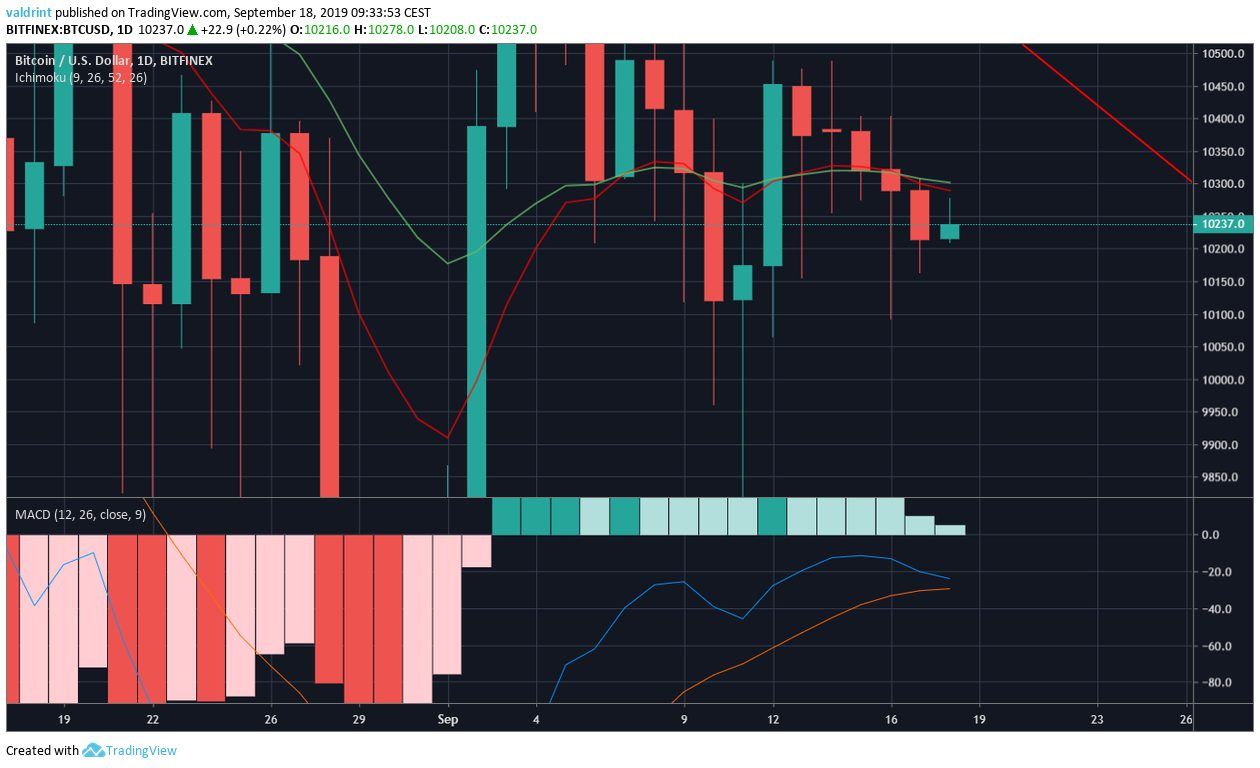
The 10- and 20-day MAs have made a bearish cross on September 16.
The price is trading below both since.
Additionally, the MACD has been rejected by the 0 line and has almost made a bearish cross.
The key level to watch is $10,100.

On September 10, the price found support above it and began a minor upward move.
It has not decreased below it since.
We believe a daily price close below it would trigger rapid price decreases.
Future Movement
A possible outline of future price movement is given below along with two support areas.
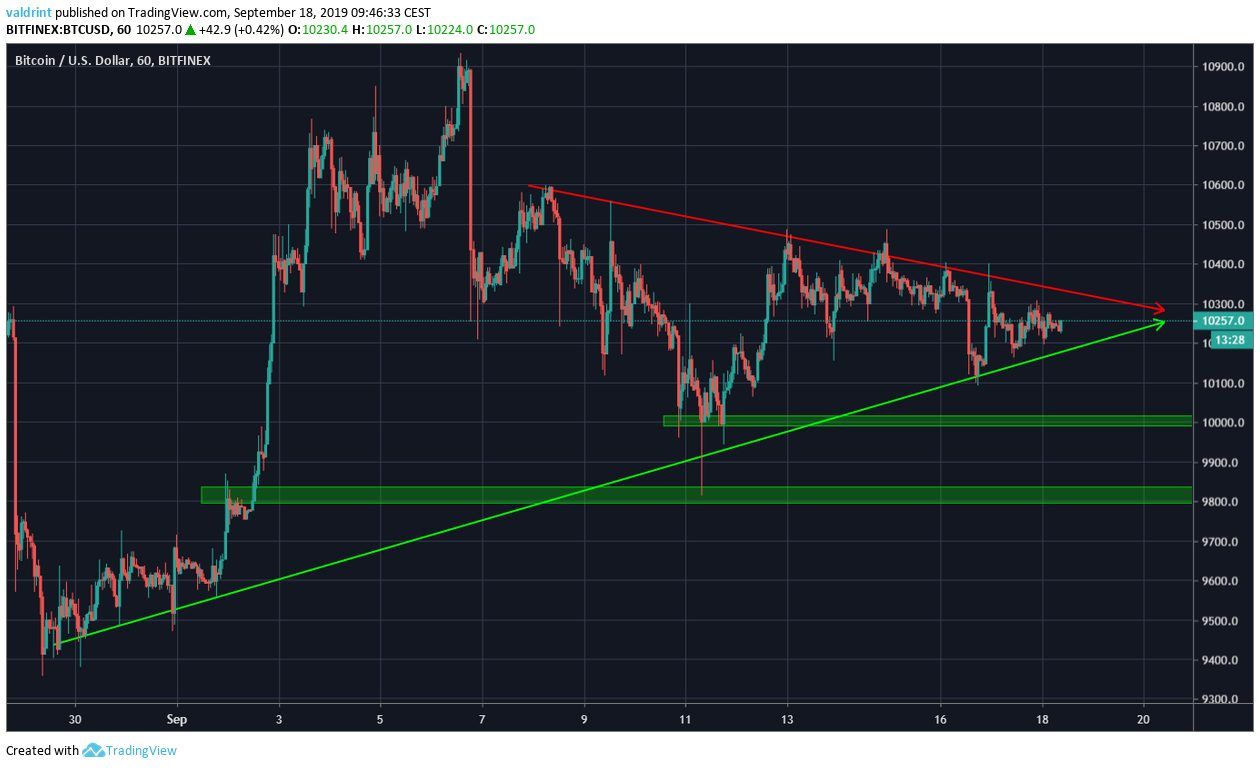
They are found at $10,000 and $9800, respectively.
We believe the Bitcoin price will eventually break down from the triangle and reach at least one of these areas.
Bitcoin Price Summary
The BTC price is trading inside a symmetrical triangle.
According to our analysis, BTC is likely to break down from this triangle and reach at least one of the support areas outlined.
For hypothetical trading purposes, we consider BTC a sell in the $10,300-$10,400 range.
Do you think the Bitcoin price will break out or break down from the triangle? Let us know in the comments below.

Disclaimer: This article is not trading advice and should not be construed as such. Always consult a trained financial professional before investing in cryptocurrencies, as the market is particularly volatile.
Images are courtesy of Shutterstock, TradingView.
