


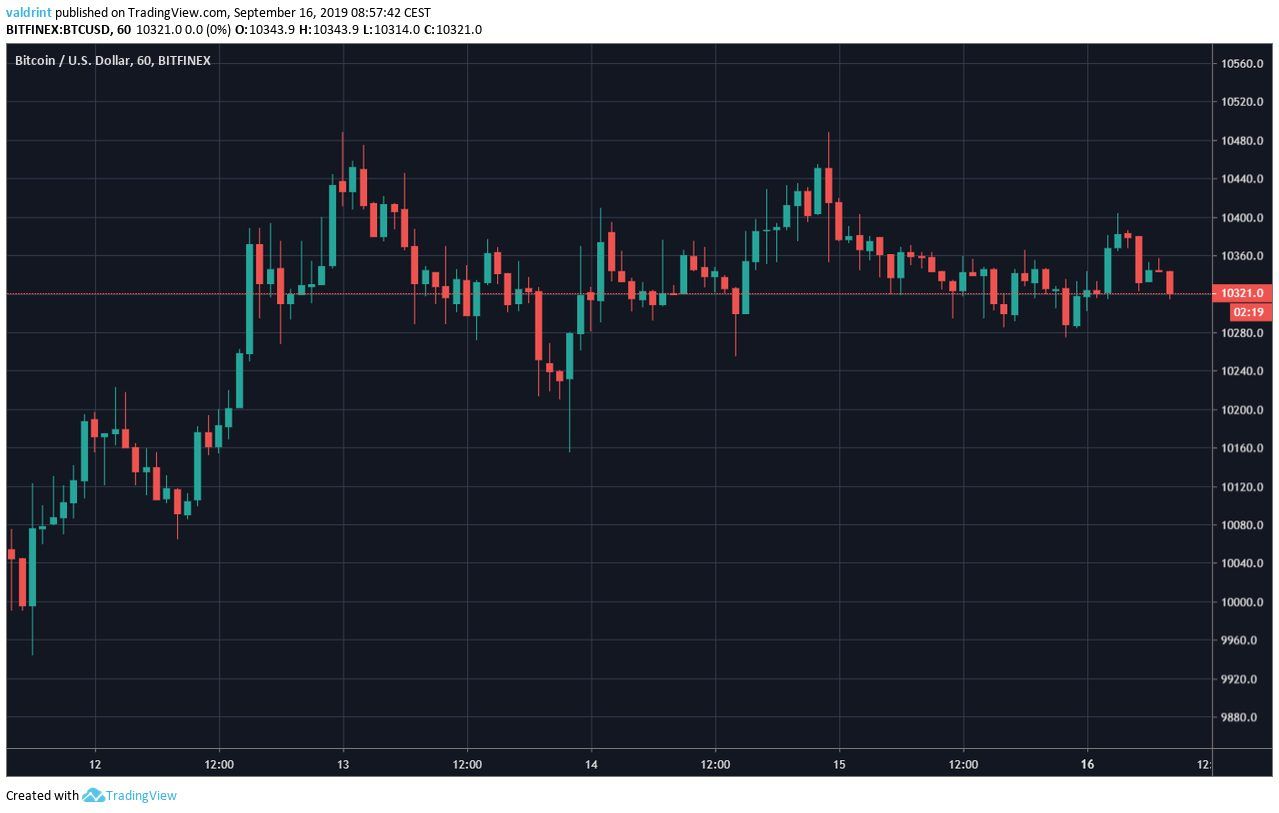
On September 11, 2019, the Bitcoin price reached a low of $9943. An upward move followed and BTC reached a high of $10,488 on September 13. After a brief decrease, the price reached similar highs the next day. It has been decreasing since.
Will BTC fall below $10,000 or will it initiate an upward move? Keep reading below if you want to find out.
For our previous analysis, click here.
Bitcoin Price: Trends and Highlights for September 16
- BTC/USD has created an inverse head and shoulders pattern.
- It is trading inside a short-term ascending and long-term descending triangle.
- Daily candlestick analysis provides a bullish sentiment.
- Daily moving averages and the MACD give a neutral outlook.
Type of Pattern
A look at the hourly chart shows that BTC has likely completed an inverse head and shoulders (H&S) pattern.
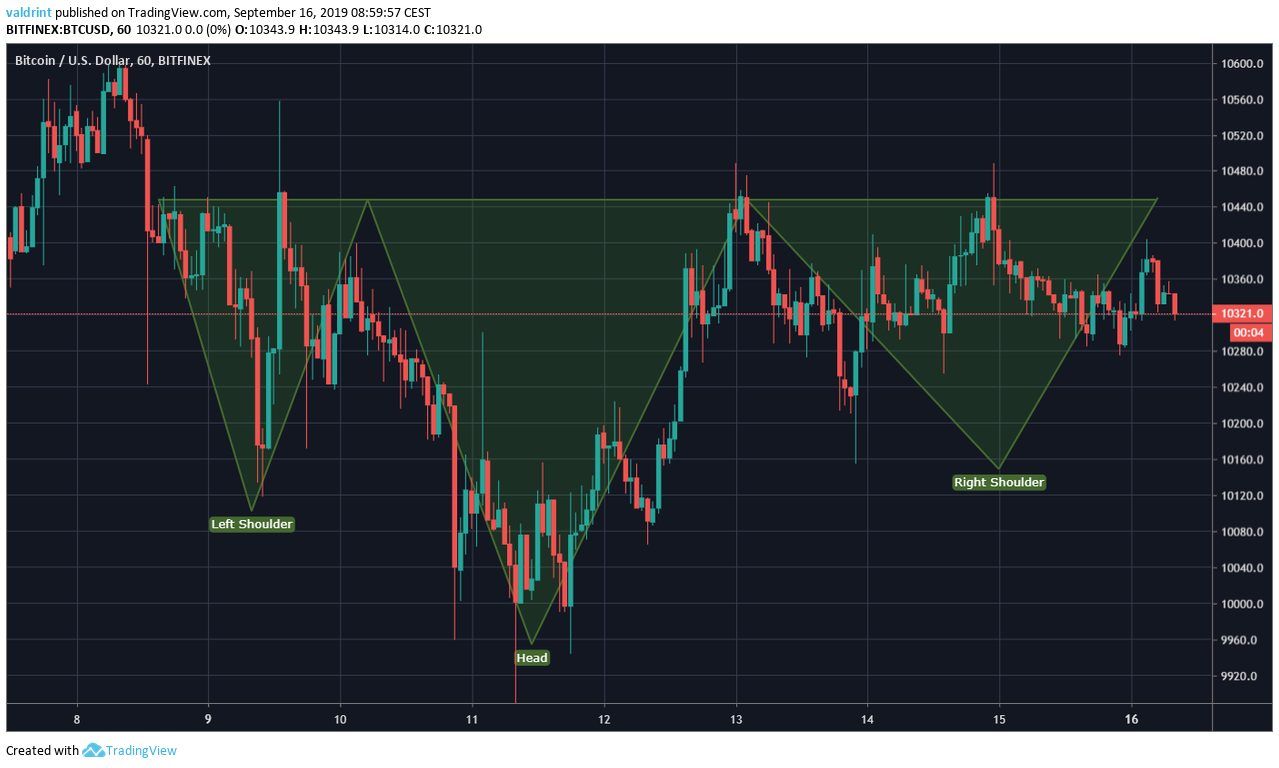
The pattern is considered bullish, making a price breakout more likely.
At the time of writing, the price seems to have completed the right shoulder.
Additionally, it is possible that the price is trading inside an ascending triangle.
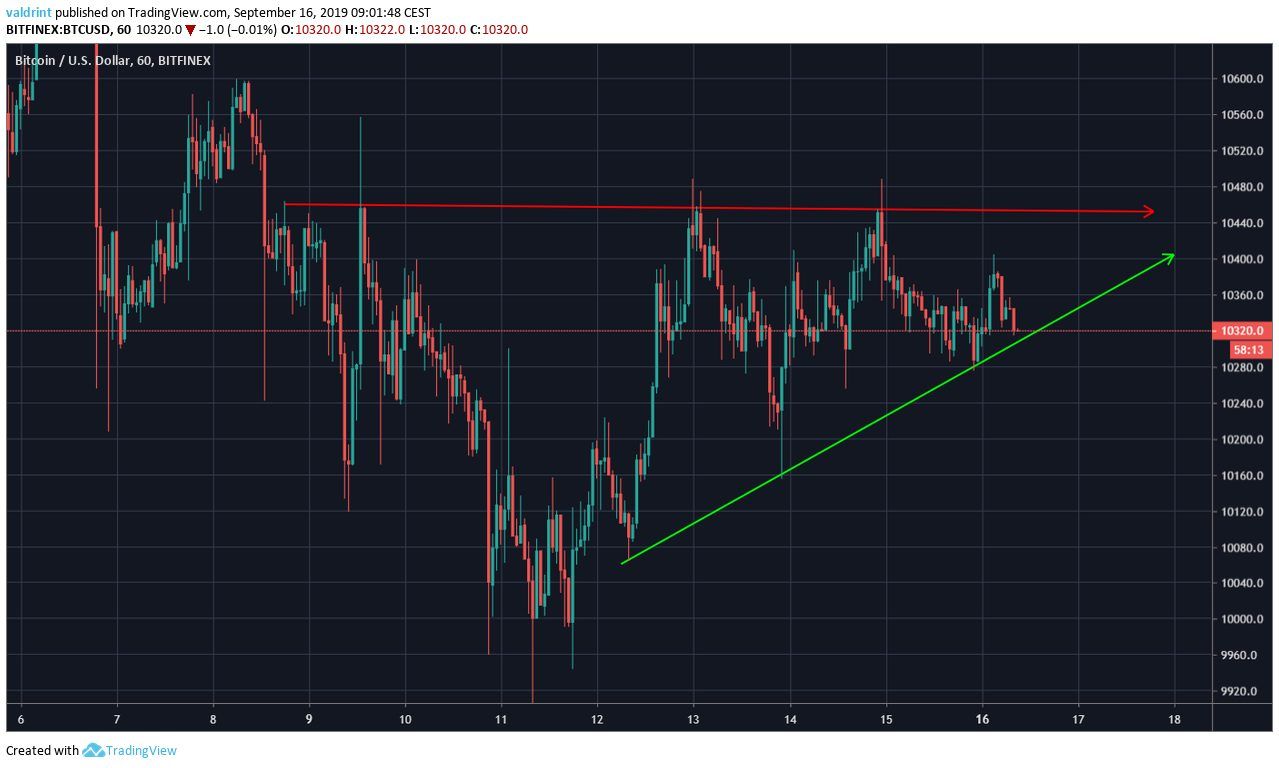
Slight increases inside the confines of the triangle until an eventual breakout occurs would fit in with the inverse H&S pattern.
However, a downward move taking us below $10,200 would likely invalidate both the ascending triangle and the inverse H&S pattern.
Bullish Sentiment
A look at the daily chart confirms the validity of the ascending support line since we can see that it can be traced since August 29 and has been touched several times.
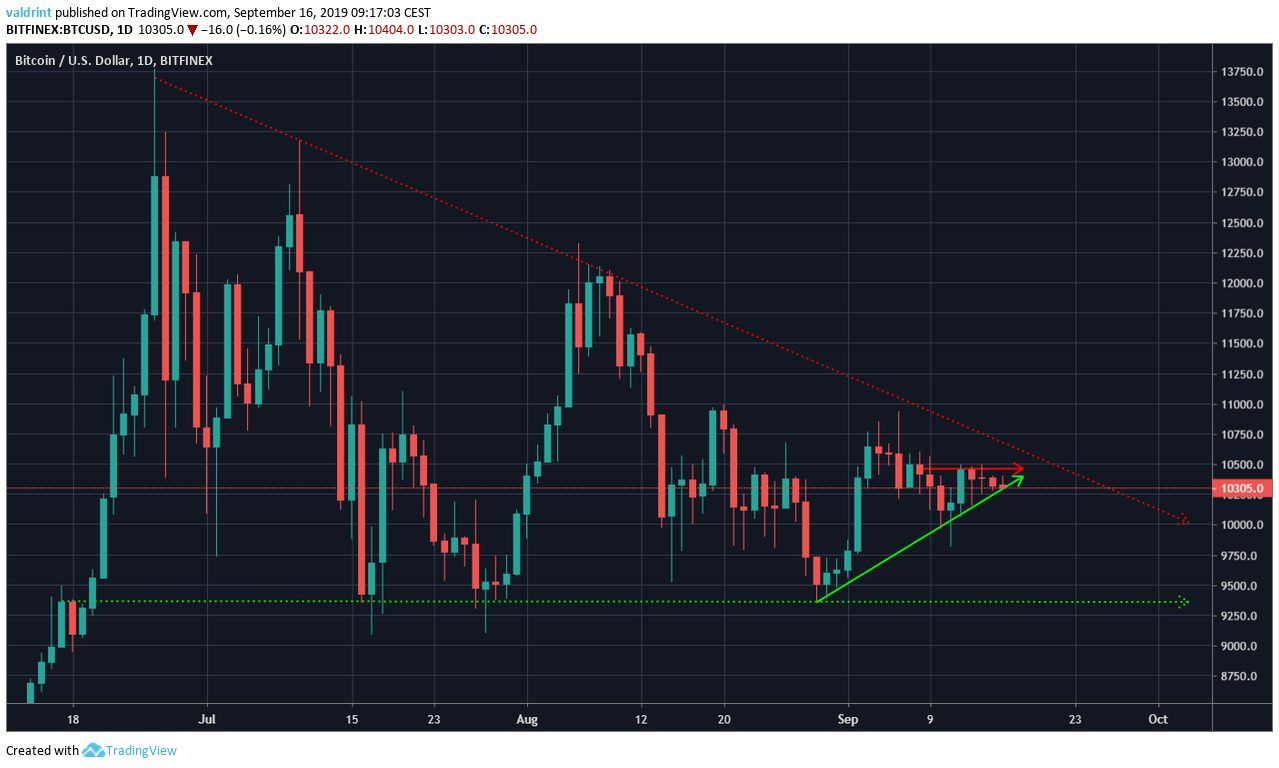
Additionally, we can see that BTC is trading inside a longer-term descending triangle. The price is relatively close to the descending resistance line of the triangle.
Taking a closer look at the daily candlesticks gives a bullish sentiment.
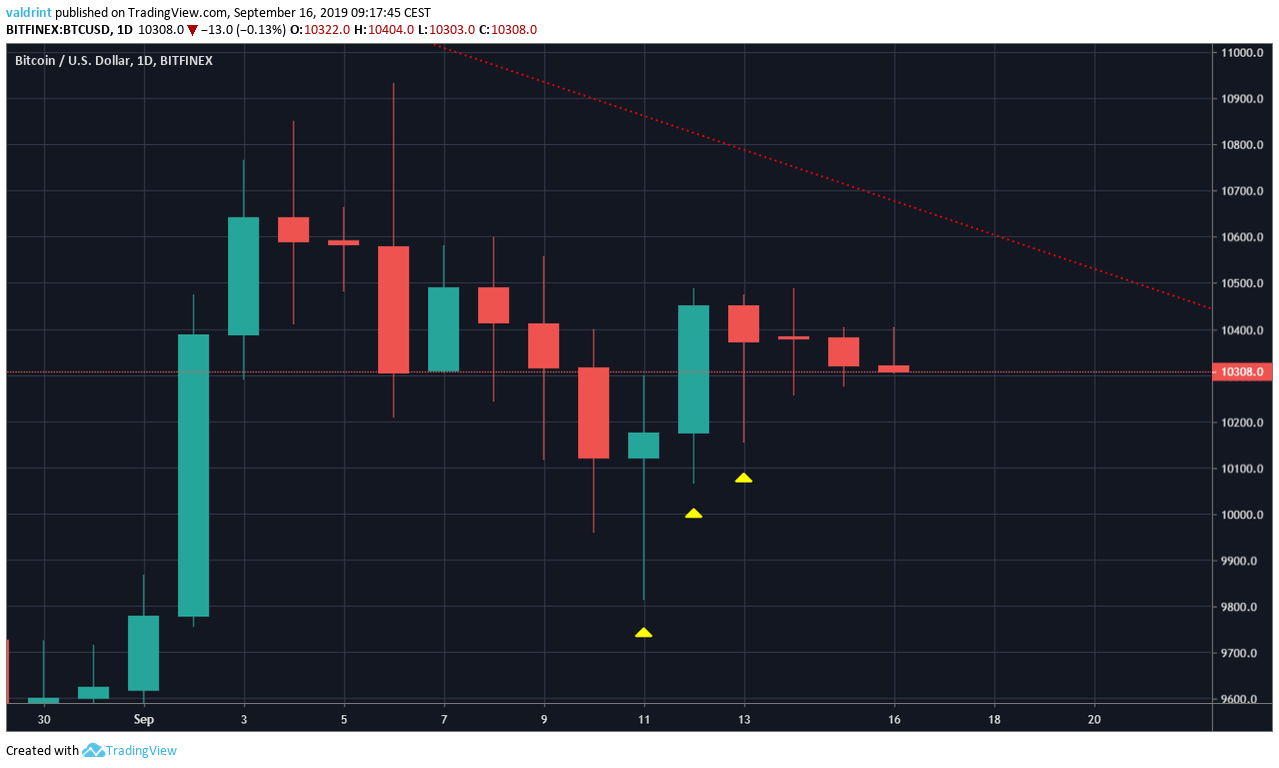
Beginning on September 11, the Bitcoin price created two bullish candles in a row; doji and bullish engulfing.
Since then, it has been decreasing. However, it has not come close to the opening prices of September 12.
To the contrary, once the price did that, it created a long lower wick.
This is an indication of buying pressure.
Let’s take a look at technical indicators to see if we can predict the direction of the upcoming move.
Technical Indicators
Incorporating the daily moving averages (MA) and the MACD does not help us in determining the likelihood of a breakout.
The Bitcoin price is trading right online with the 10- and 20-day MAs.
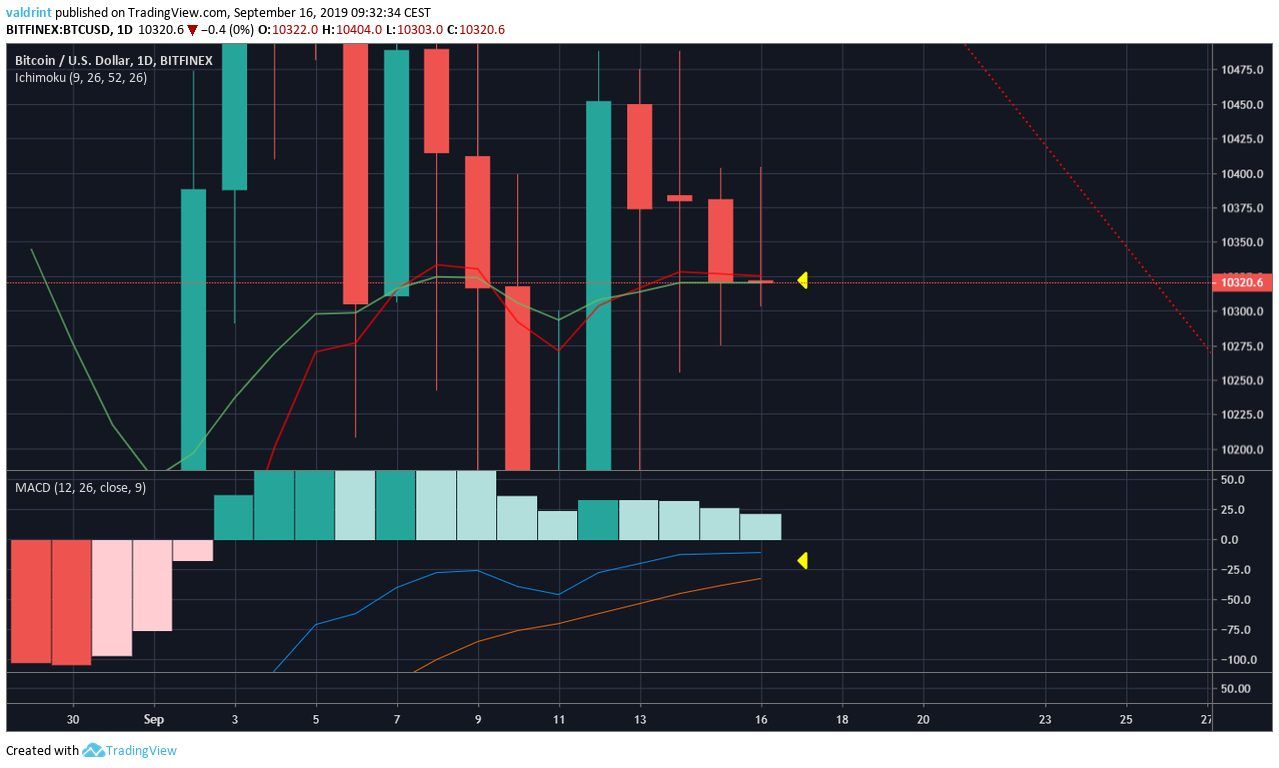
Additionally, they have a neutral position, being right on top of each other. This occurs when the price has been consolidating for a period of time.
Finally, the MACD looks to have been rejected by the 0 line. However, it has not yet begun to decrease, and an upward movement would likely take it into positive territory.
Bitcoin Price Summary
The Bitcoin price has likely completed an inverse H&S pattern and is trading inside an ascending triangle.
While both a breakout and breakdown seem possible, we believe a breakout to be more likely.
For hypothetical trading purposes, we do not recommend initiating any positions at the current price level.
Rather, the support and resistance lines of the triangle can be used as stop losses in case a rapid move in either direction occurs.
Do you think the Bitcoin price will break out or break down from the triangle? Let us know in the comments below.

Disclaimer: This article is not trading advice and should not be construed as such. Always consult a trained financial professional before investing in cryptocurrencies, as the market is particularly volatile.
Images are courtesy of Shutterstock, TradingView.


