


On September 6, the Bitcoin price reached a high of $10,933. A rapid decrease ensued and the price reached a low of $10,208 during the same day. After a gradual retracement that ended with a high of $10,600 on September 8, BTC continued its downward movement — but at a slower rate.
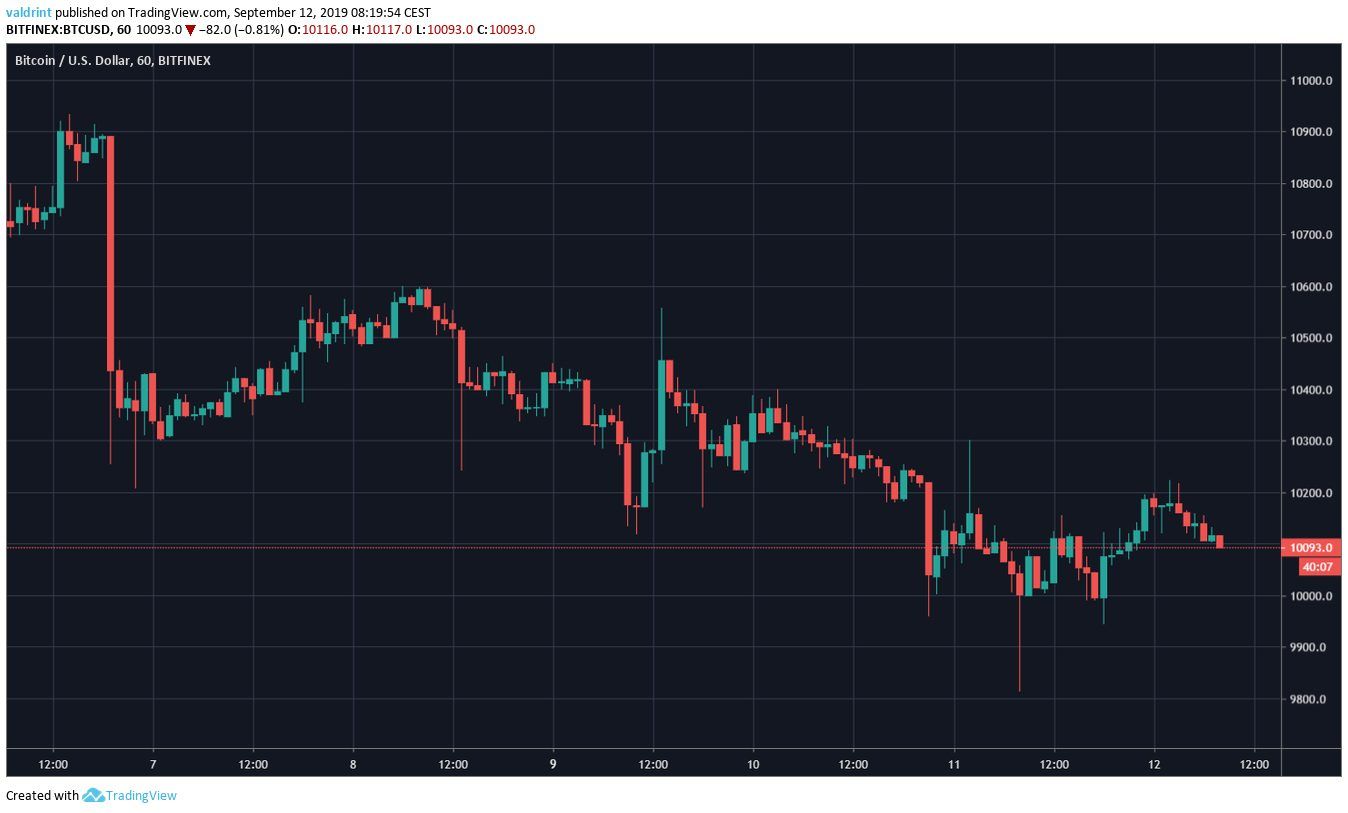
Will the Bitcoin price stay above $10,000 or will it decrease below? Continue reading if you want to find out.
For our previous analysis, click here.
Bitcoin Price: Trends and Highlights for September 12
- BTC/USD is trading inside a descending channel.
- There is support at $9950.
- Daily moving averages and MACD are bearish
- There is resistance at $10,300.
Bitcoin Price in a Descending Channel
A look at the hourly channel shows that BTC has been trading inside a descending channel since September 7.
While it initially looked as if the pattern was a descending wedge, the recent movement on September 12 made us adjust the resistance line — creating a descending channel instead.
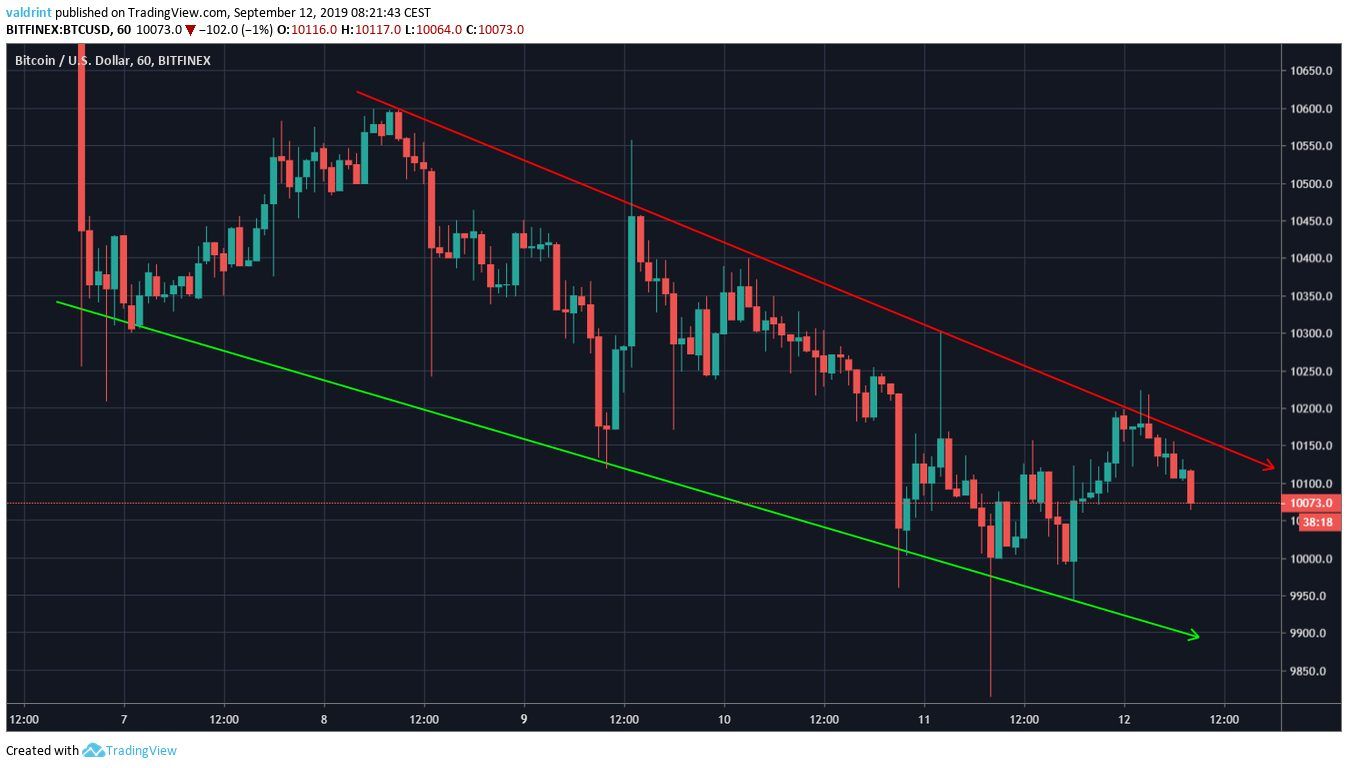
At the time of writing, the Bitcoin price was decreasing towards the support line after being rejected a breakout earlier today.
Looking at the movement on September 11, we can see a support area at $9950.
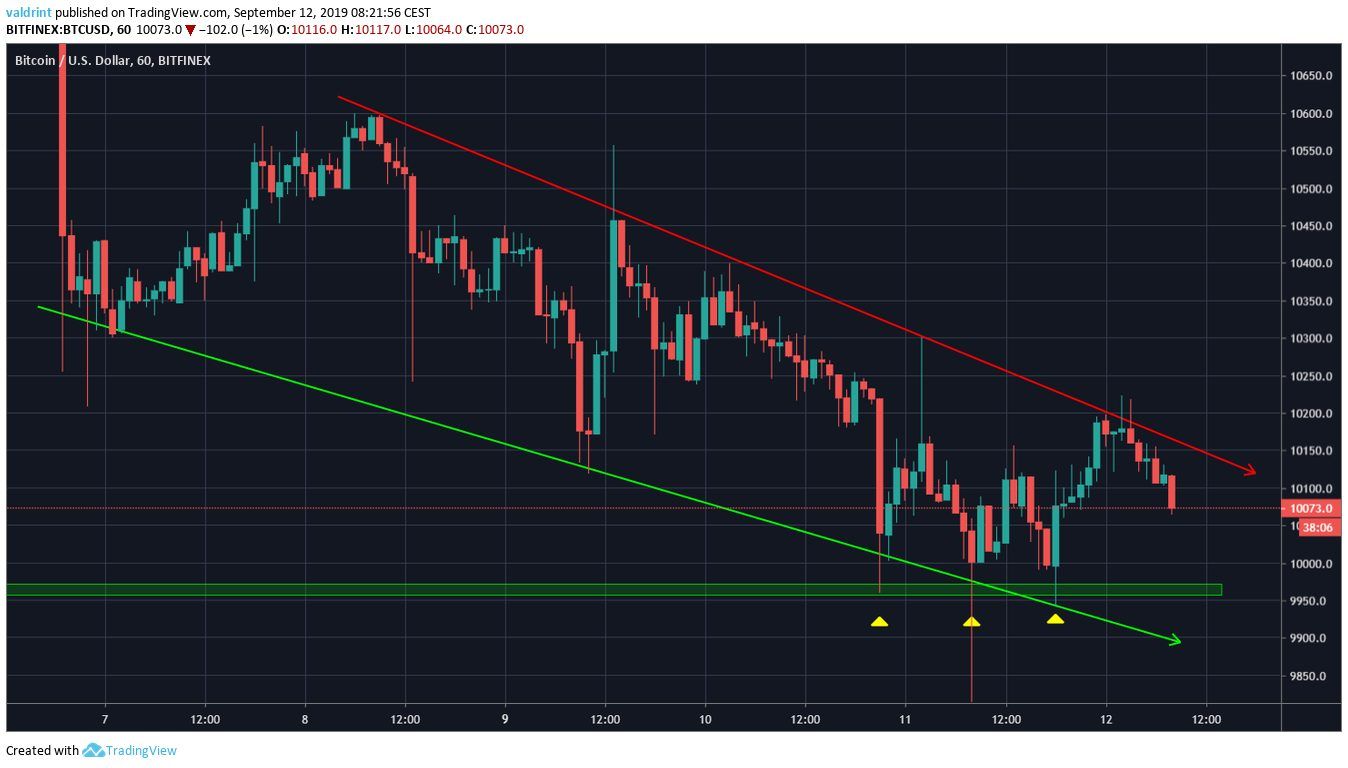
Additionally, we can see a triple bottom inside this area characterized by long lower wicks. The triple bottom is considered a bullish pattern — making a price breakout more likely.
Daily Outlook
A look at the daily chart reveals that the Bitcoin price has been trading inside a descending triangle since June 25.
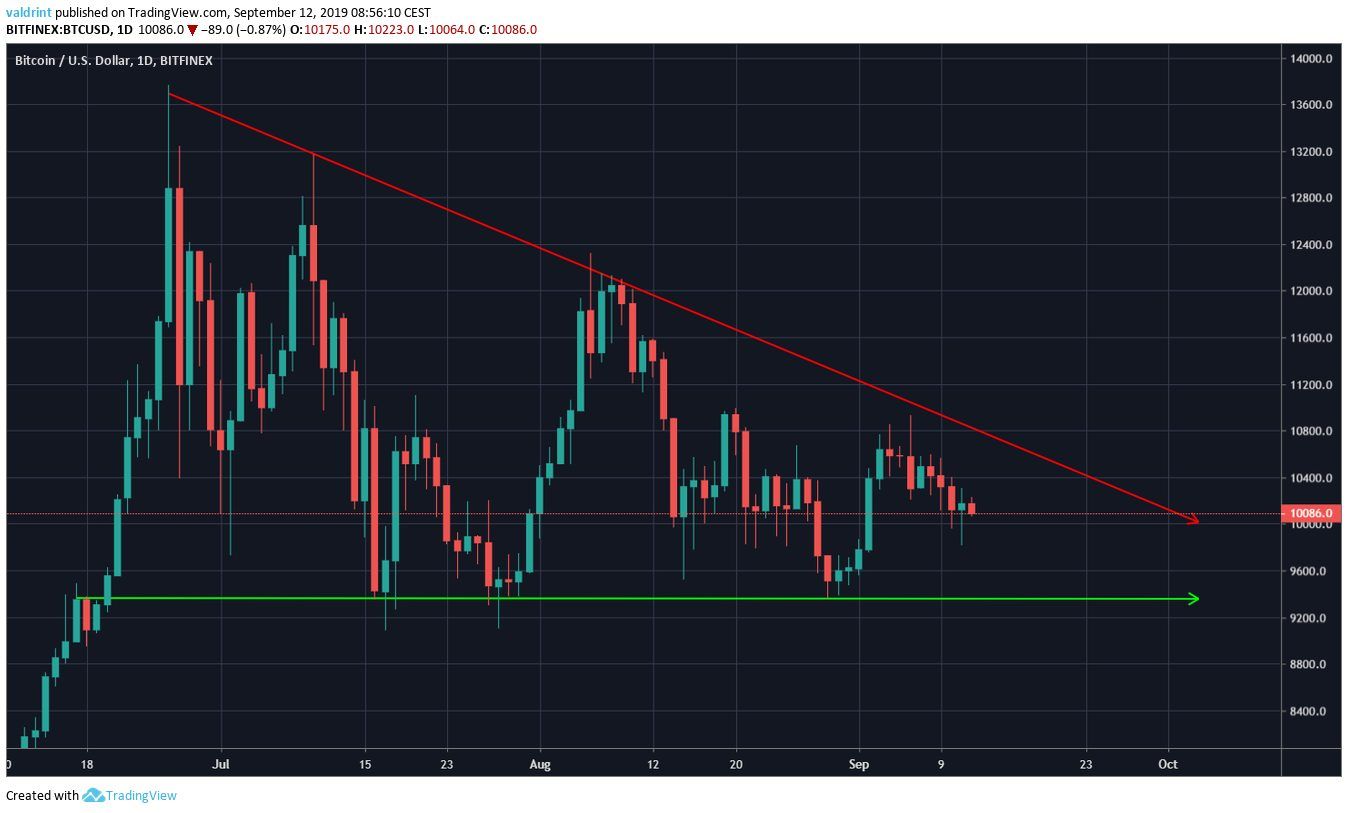
The BTC price is approaching the projected end of the triangle, which should occur in mid-October.
The descending triangle is a bearish pattern, making a price breakdown more likely.
Additionally, the bearish outlook is strengthened once we incorporate the daily moving averages (MA) and the MACD into the analysis.
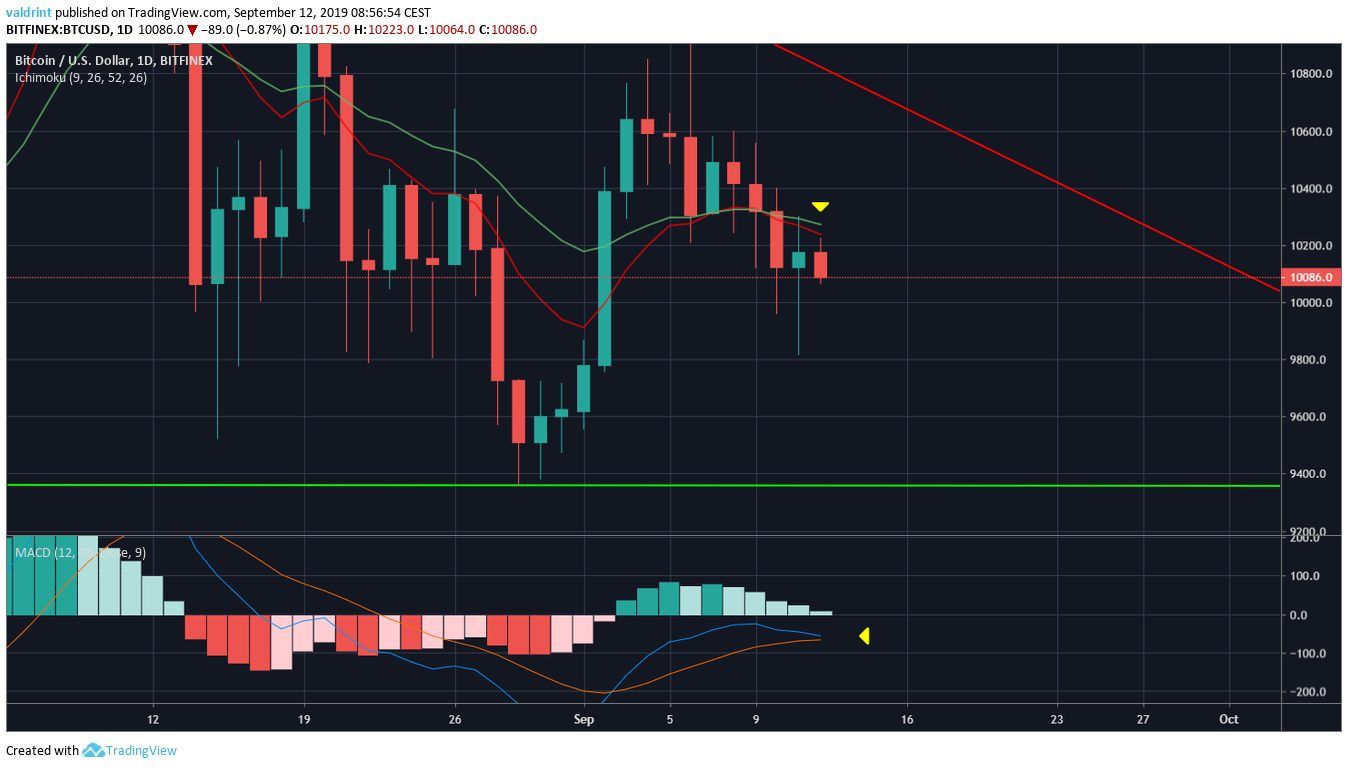
A bearish cross has occurred between the 10- and 20-day MAs.
The Bitcoin price is facing very close resistance from both.
Additionally, the daily MACD has failed to cross into positive territory and is now very close to making a bearish cross.
This would likely confirm the bearish trend and initiate the downward move towards the support line.
Future Movement
Two possible outlines for the next Bitcoin price movement are given below. Additionally, one resistance area is traced, which is found at $10,300.
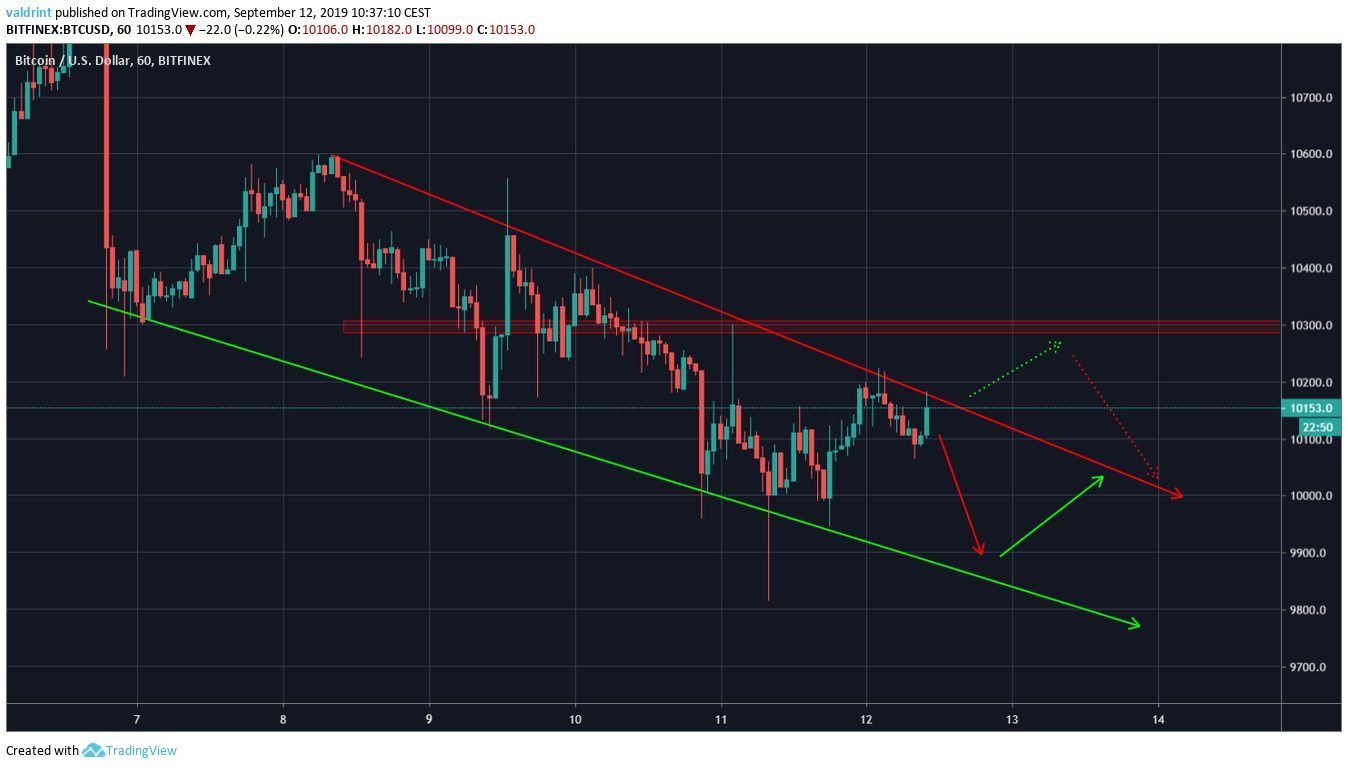
The Bitcoin price is likely to continue to decrease at the rate predicted by the channel.
If to the contrary it breaks out, it is likely to reverse at $10,300 and continue its downward movement.
Bitcoin Price Summary
The Bitcoin price is trading inside a short-term descending channel and a longer-term descending triangle.
According to our analysis, it is likely to continue its downward movement.
For hypothetical trading purposes, we have a neutral view towards BTC, and believe the correct move is waiting for better buying/selling opportunities.
Do you think the Bitcoin price will continue to decrease? Let us know in the comments below.

Disclaimer: This article is not trading advice and should not be construed as such. Always consult a trained financial professional before investing in cryptocurrencies, as the market is particularly volatile.
Images are courtesy of Shutterstock, TradingView.


