


On August 10, 2019, the Bitcoin price reached a high of $12,011. A rapid decrease ensued. The BTC price traded around $11,400 until August 13, when another rapid decrease began. On August 15, it reached a low of $9522. It has been increasing since then.
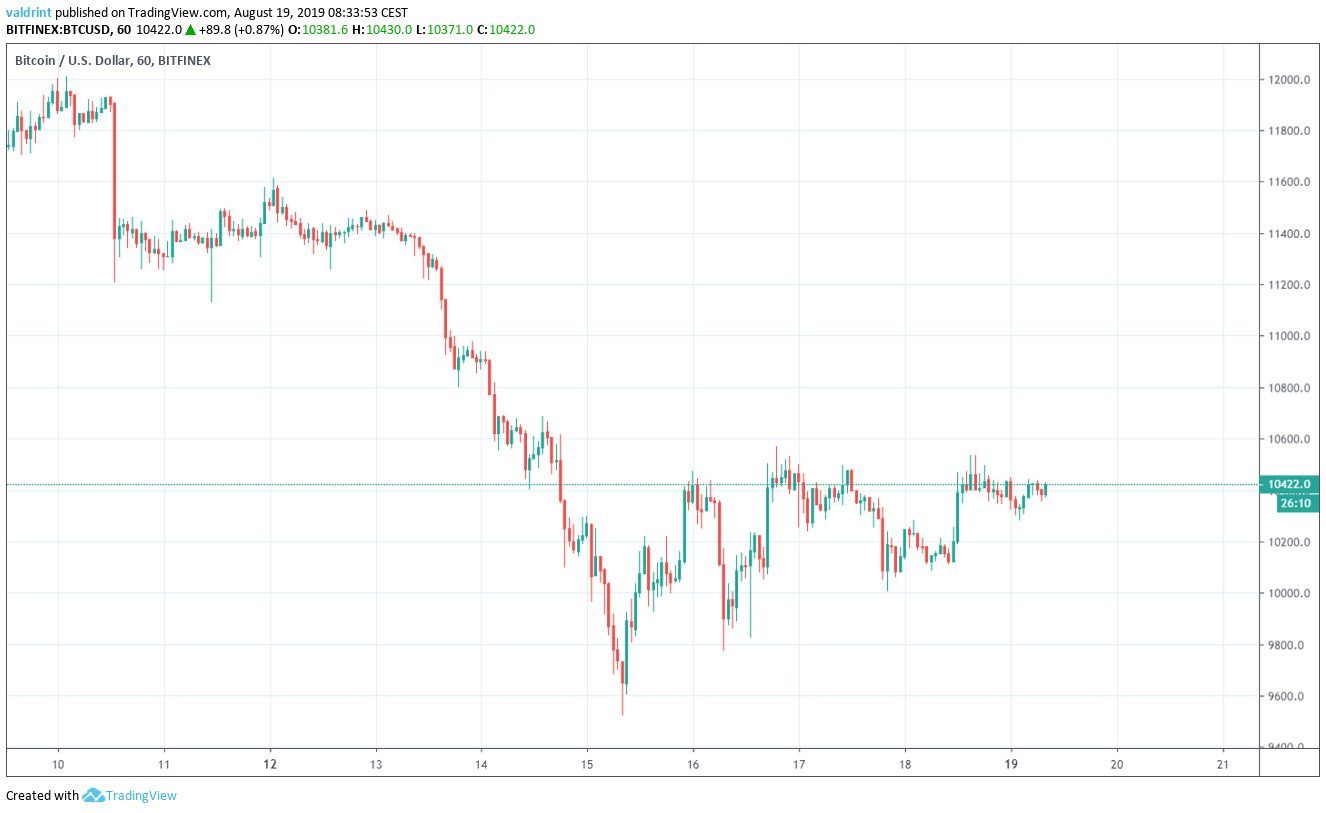
Will the BTC price continue to increase or does another downward move await? Continue scrolling if you are interested in finding out.
For our previous analysis, click here.
If you are interested in trading Bitcoin (BTC) and other cryptocurrencies with a multiplier of up to 100x on our new partner exchange with the lowest fees, follow this link to get a free StormGain account!

Bitcoin Price: Trends and Highlights for August 19
- BTC/USD has found support above the 10-week moving average.
- The MACD is very close to making a bearish cross.
- BTC is possibly trading inside a descending triangle.
- Price bounced on the 100-day moving average.
- BTC made a short-term breakout.
Long-Term BTC Price Outlook
A look at the weekly chart reveals that BTC has been showing weakness in the form of long upper wicks.
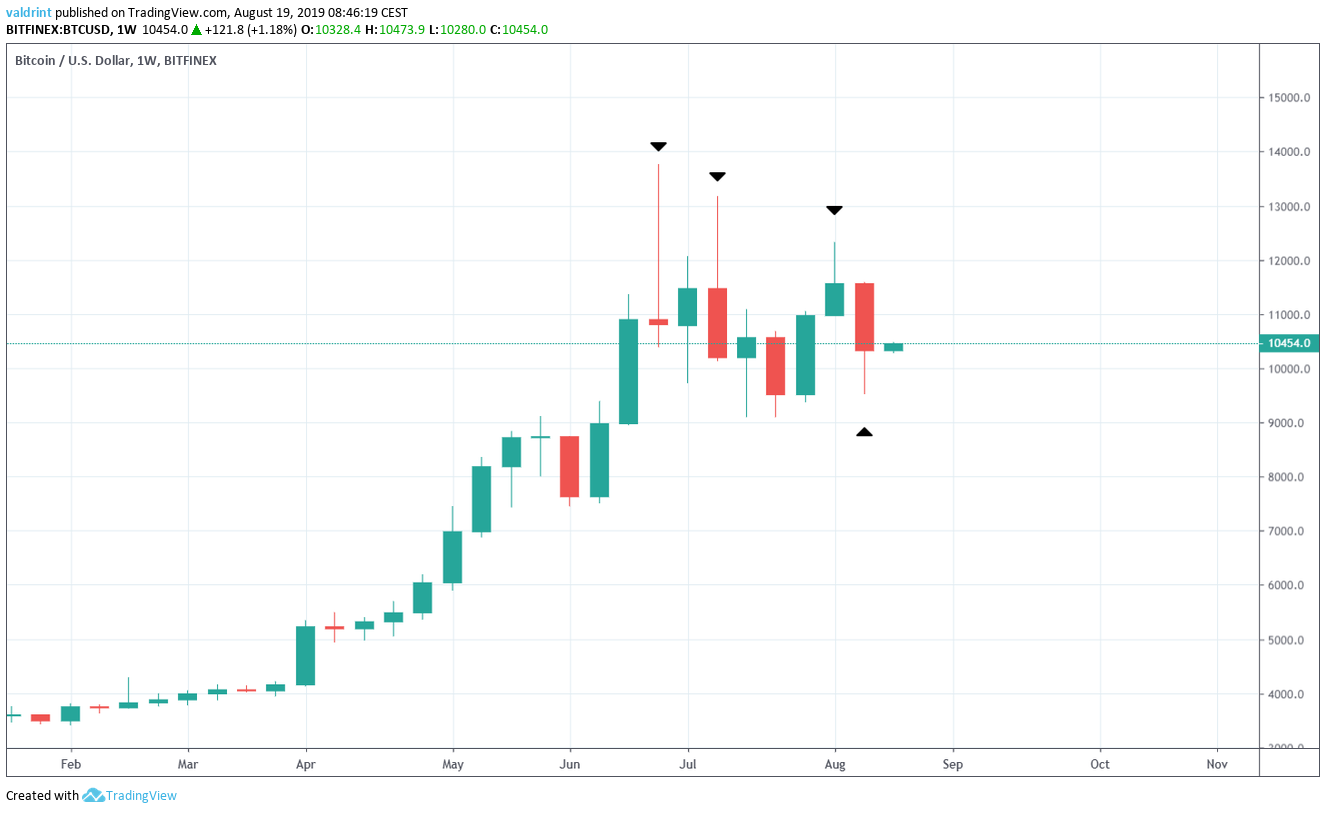
The wicks can be found in candlesticks that have reached values above $11,500.
While last week’s price showed some strength by rebounding from the $9500 lows to close near $10,300, this movement pales in comparison to the failed upward moves that left upper wicks during the prior weeks.
Additionally, a look at the moving averages (MA) shows the extent to which the previous upward move has cooled off.
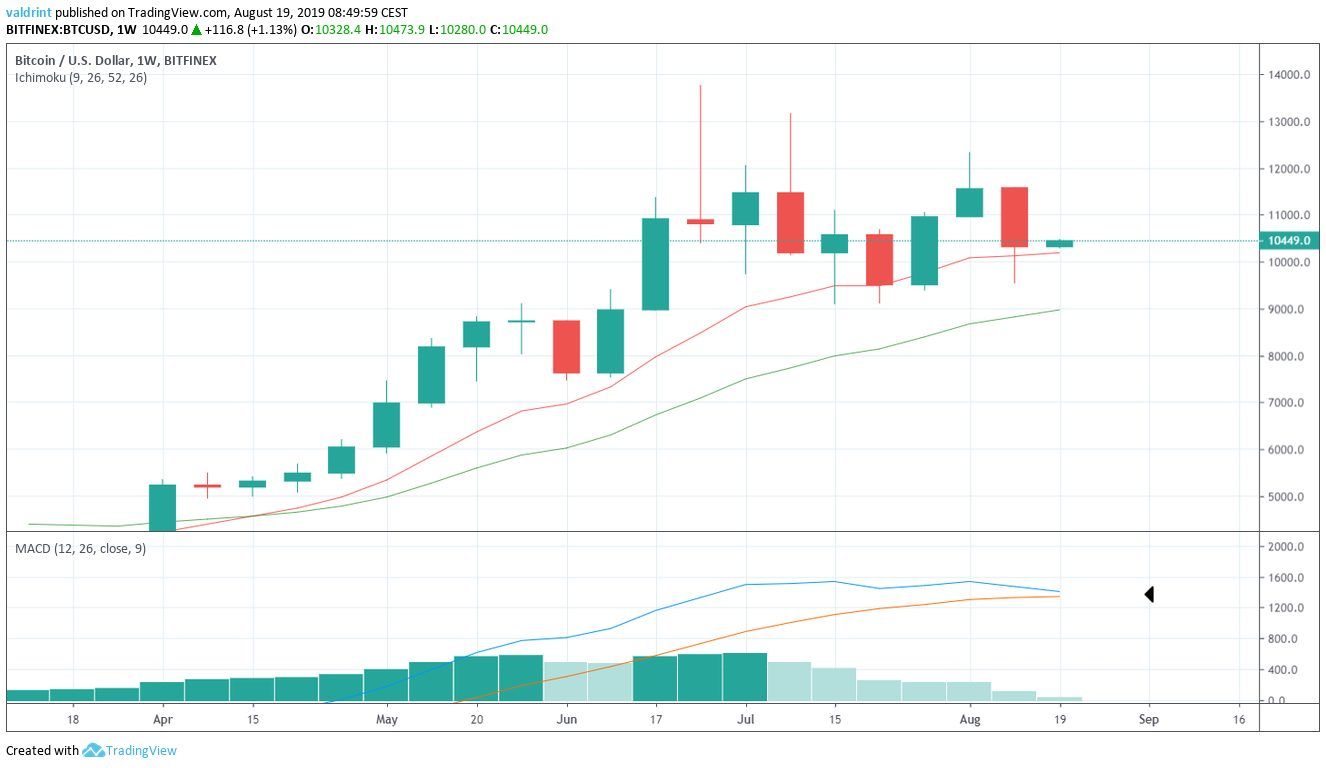
The Bitcoin price has found support above the 10-week MA and has been trading slightly above it since the middle of July.
Additionally, the MACD is very close to making a bearish cross.
This often precedes a bearish cross between the MAs — which could indicate that a downtrend has begun.
Let’s take a closer look to see where the BTC price is heading.
Descending Triangle
A look at the daily time-frame shows that BTC is possibly trading inside a descending triangle.
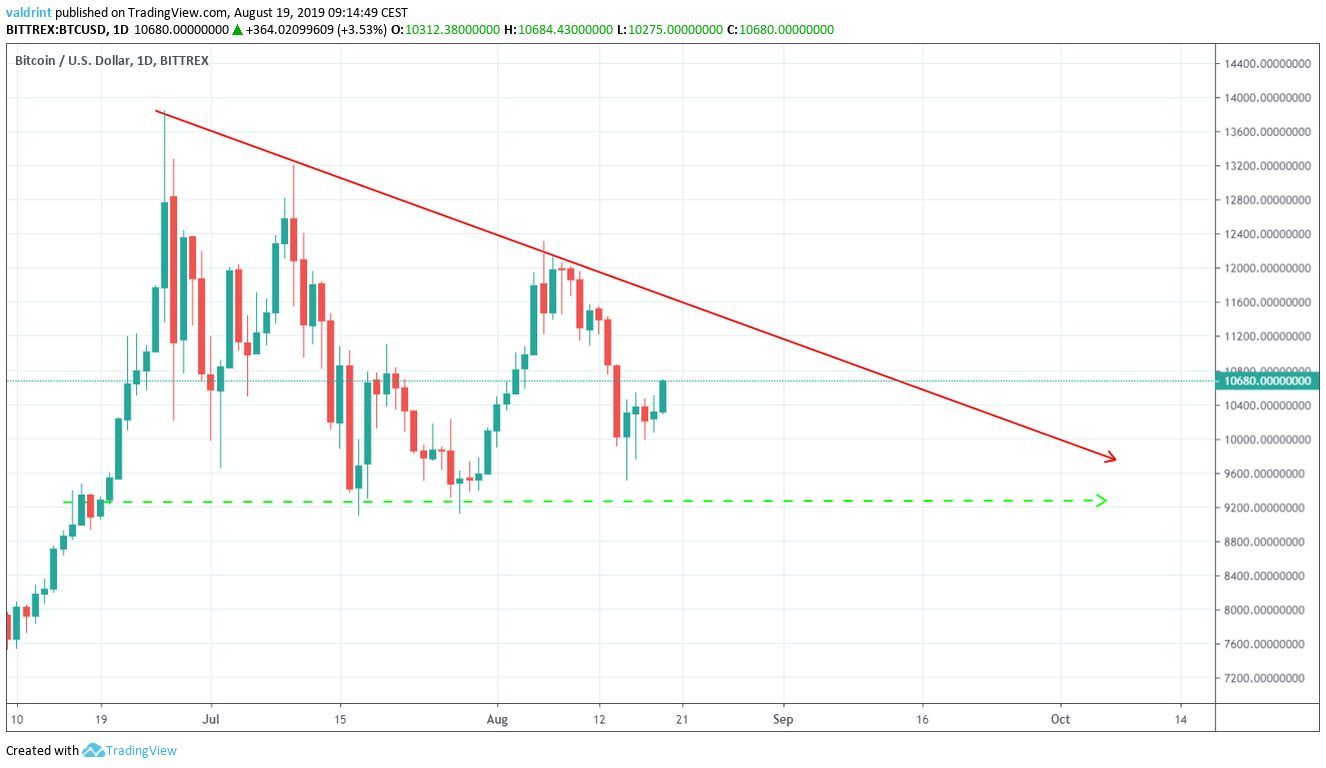
While the resistance line has been confirmed, it is possible that the Bitcoin price follows a different support line — potentially creating a symmetrical triangle.
The price is trading in the middle of the channel.
A look at the daily moving averages reveals two interesting developments:
- The BTC price bounced upward once it reached the 100-day MA
- It is facing resistance from the 10- and 20-day MAs.
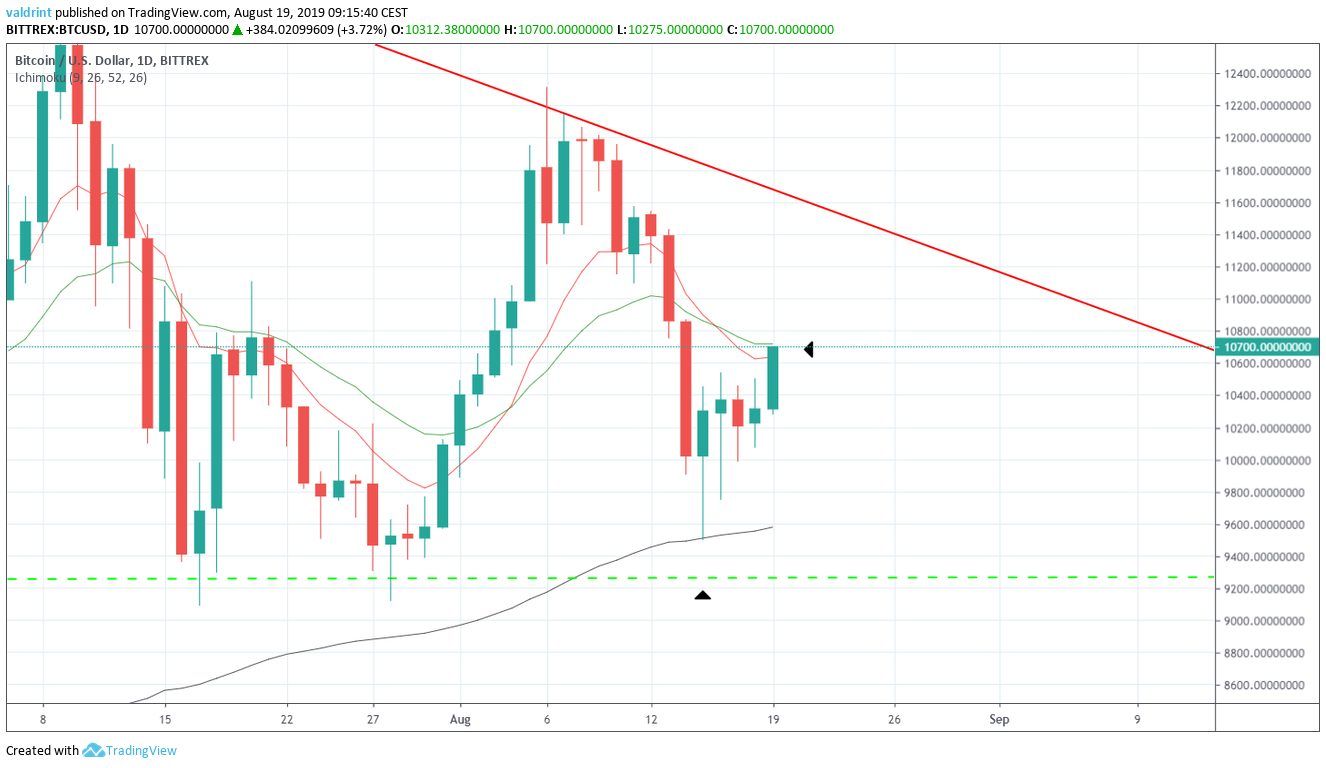
At the time of writing, the BTC price was in the process of moving above the 10- and 20-day MAs.
However, they have previously made a bearish cross.
The magnitude of the upward move initiated after the price touched the 100-day MA increases its significance as support.
Therefore, as long as the price is trading above it, we can consider BTC bullish in the short/medium-term.
Short-Term
A look at the 30-minute chart shows that BTC has been following an ascending support line since reaching lows near $9500 on August 15.
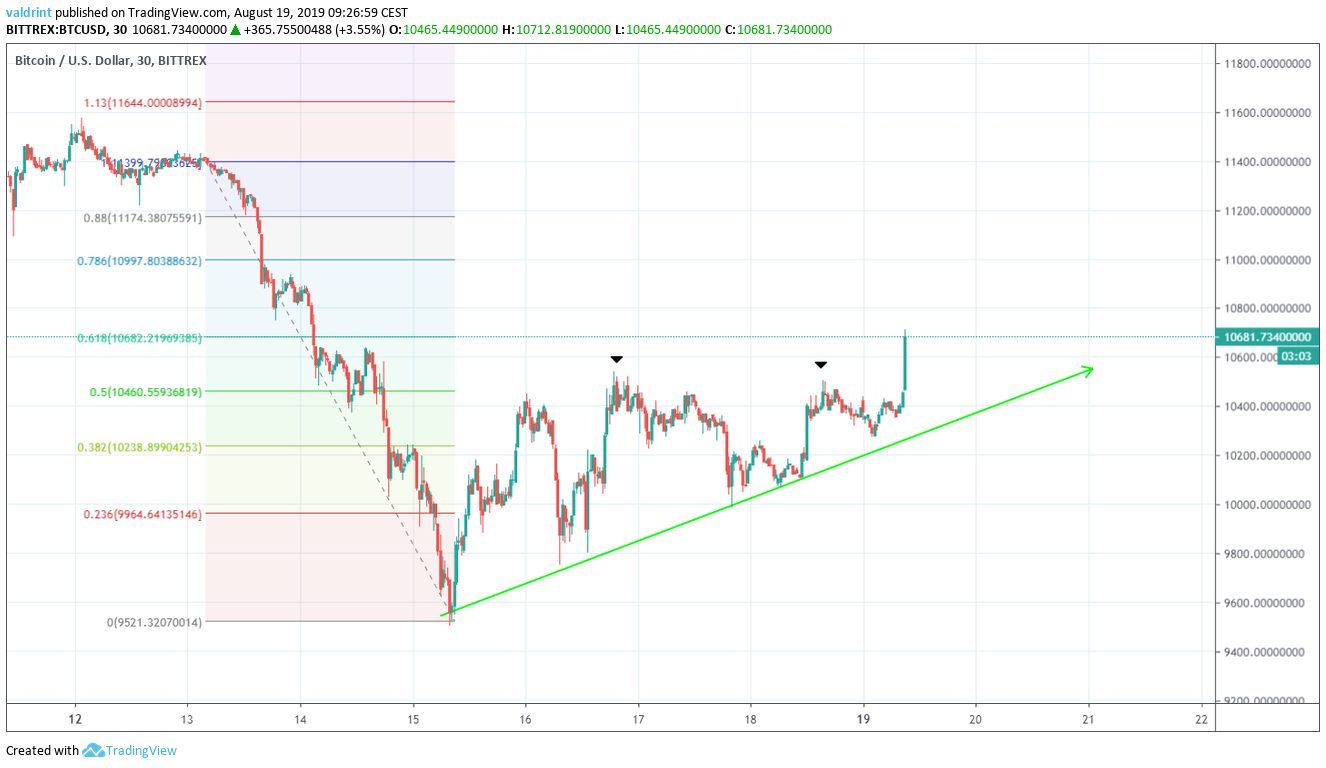
Additionally, after failing to do so for the past four days, it just broke out above the 0.5 fib level of the previous drop.
It is currently attempting to break out of the 0.618 level.
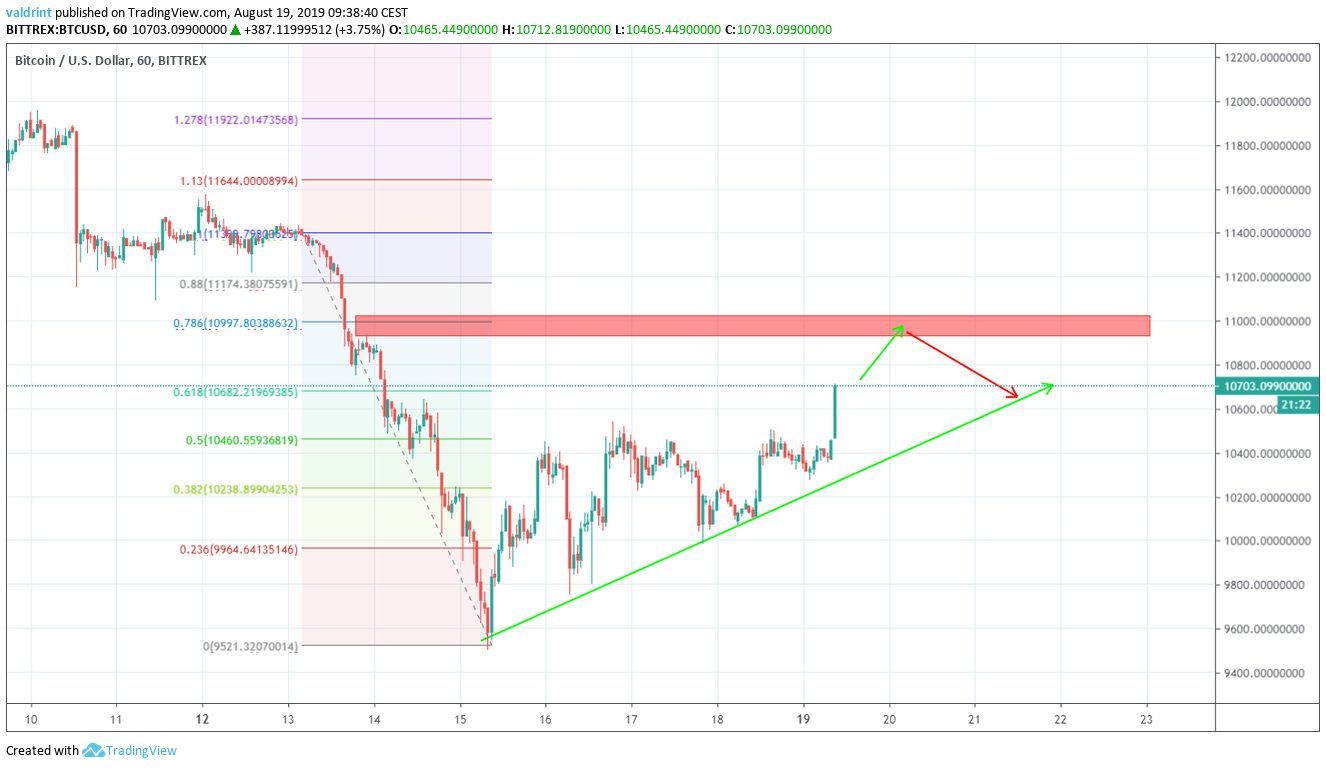
While BTC could continue to increase, it should meet resistance at $11,000 before decreasing towards the ascending support line.
Our long-term outlook remains bearish.
Bitcoin Price Summary
The BTC price is following a short-term ascending support line.
According to our analysis, it is likely to increase at the rate predicted by the support line.
We do not believe it is likely to increase above $11,000.
For trading purposes, we feel that BTC should offer some selling opportunities — especially if it approaches $11,000.
How long do you think BTC will continue to increase? Let us know in the comments below.
Disclaimer: This article is not trading advice and should not be construed as such. Always consult a trained financial professional before investing in cryptocurrencies, as the market is particularly volatile.
Images are courtesy of Shutterstock, TradingView.


