


On August 12, 2019, the Bitcoin price reached a high of $11,615. The next day, a rapid decrease began that is still ongoing. The BTC price briefly found support above $10,400 before continuing the downward move.
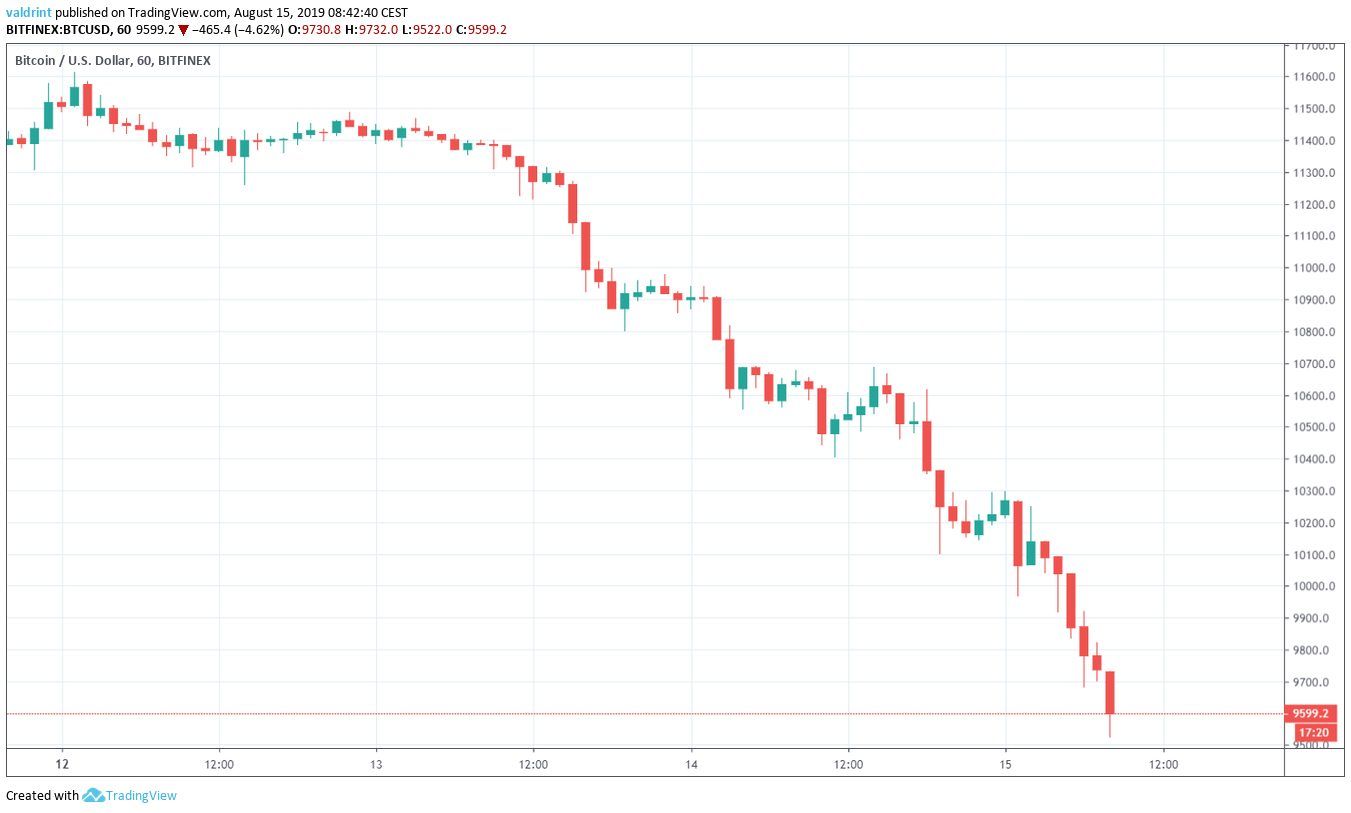
At the time of writing, it was trading close to $9600.
How long will BTC continue to decrease? Keep reading below if you are interested in finding out.
For our previous analysis, click here.
If you are interested in trading Bitcoin (BTC) and other cryptocurrencies with a multiplier of up to 100x on our new partner exchange with the lowest fees, follow this link to get a free StormGain account!

Bitcoin Price: Trends and Highlights for August 15
- BTC/USD is trading inside a descending channel.
- There is support at $9200.
- The BTC price is right on the 100-day moving average.
- The RSI has developed a very short-term bullish divergence.
BTC Price in a Descending Channel
A look at the daily chart shows that BTC has been trading inside a descending channel since June 26.
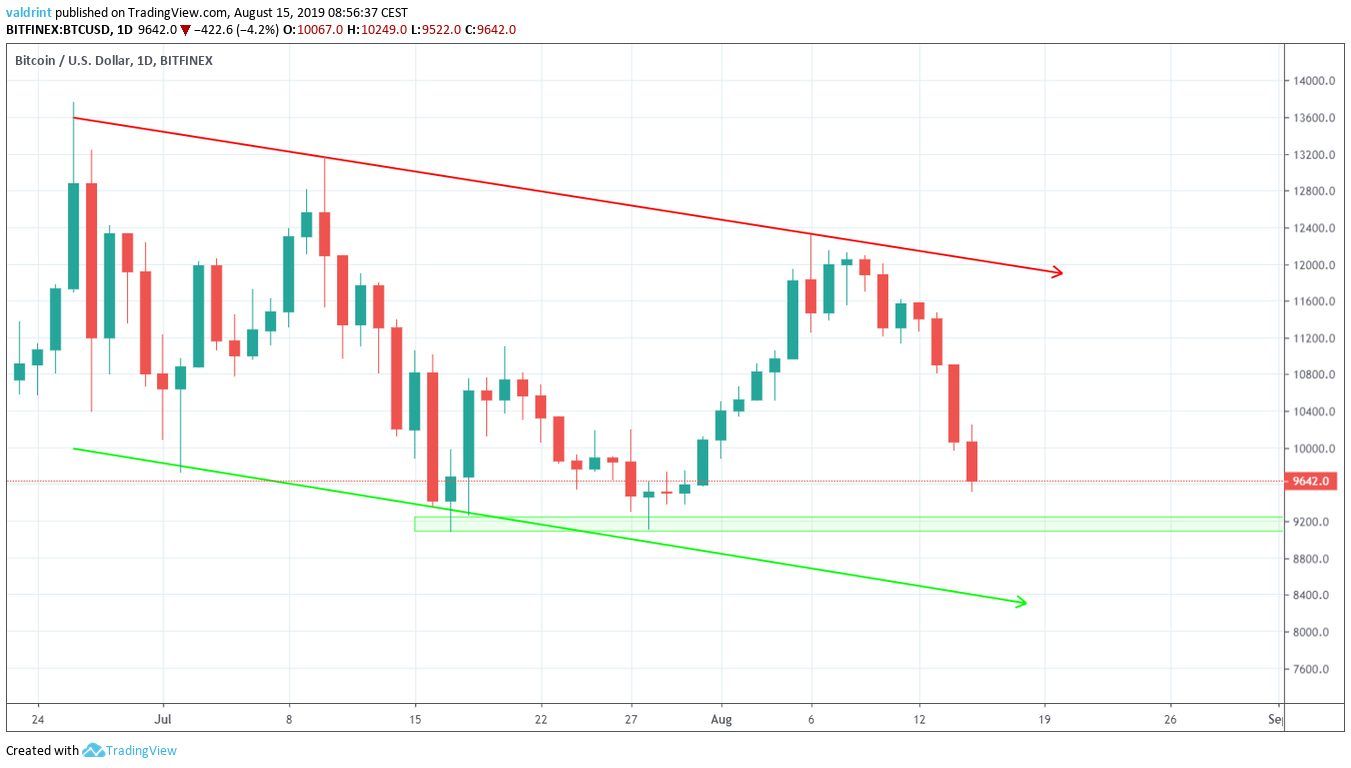
Additionally, we can see one support area near $9200.
A drop towards it would create a triple bottom, which is considered a bullish reversal pattern.
If not, the support line is currently at $8400.
Moving Averages
In order to try and predict where the Bitcoin price will reverse we will incorporate moving averages (MA) into the analysis.
We can see that the price is currently right above the 100-day moving average.
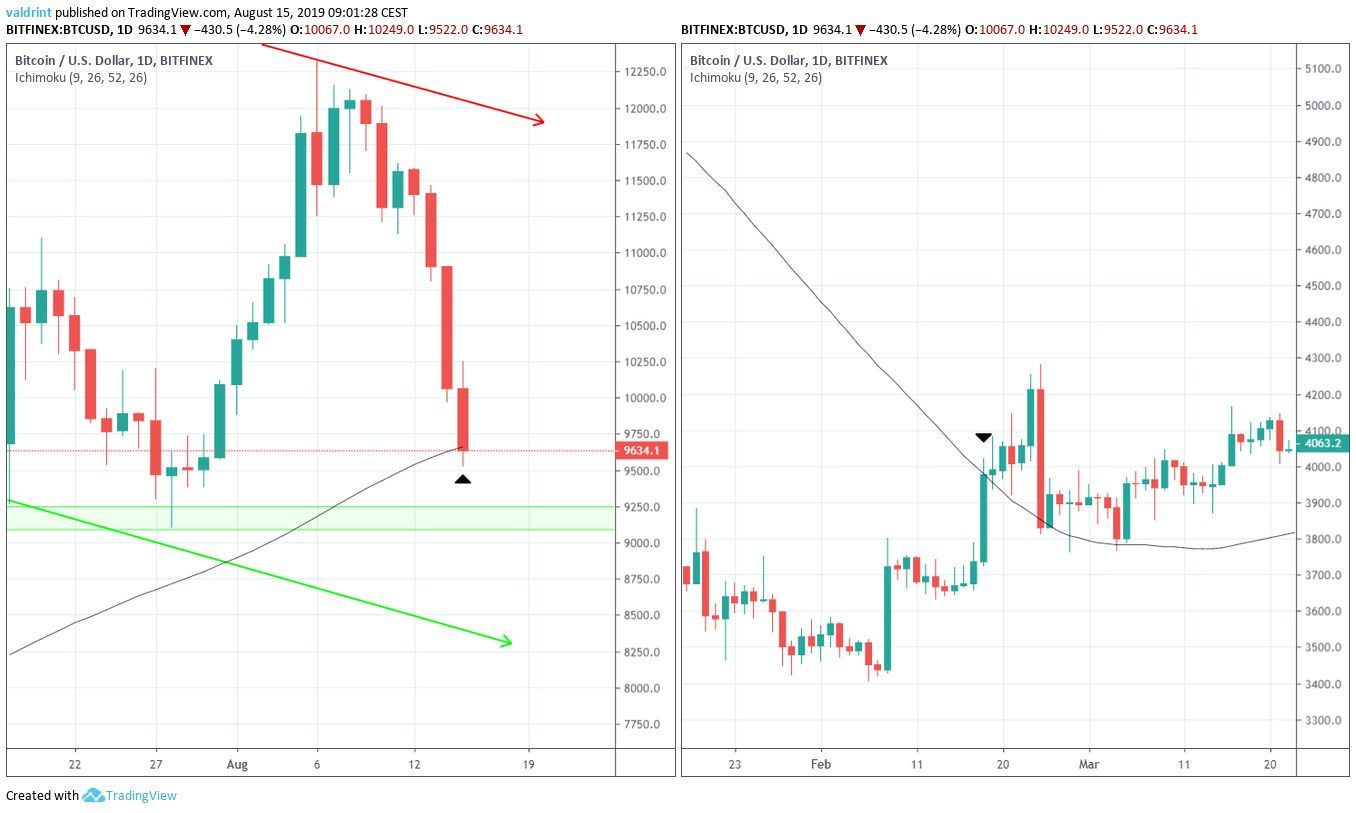
This moving average is quite significant.
As we can see on the right side of the graph, the previous time the Bitcoin price traded below it was February 18 — right before the start of the current upward move.
Afterward, the price validated it as support in early March.
A breakdown below this MA, followed by the price validating it as resistance, would most likely confirm that the current upward move has finished and that we are in a downtrend.
If that were to occur, the 10- and 20-day MAs would also likely make a bearish cross.
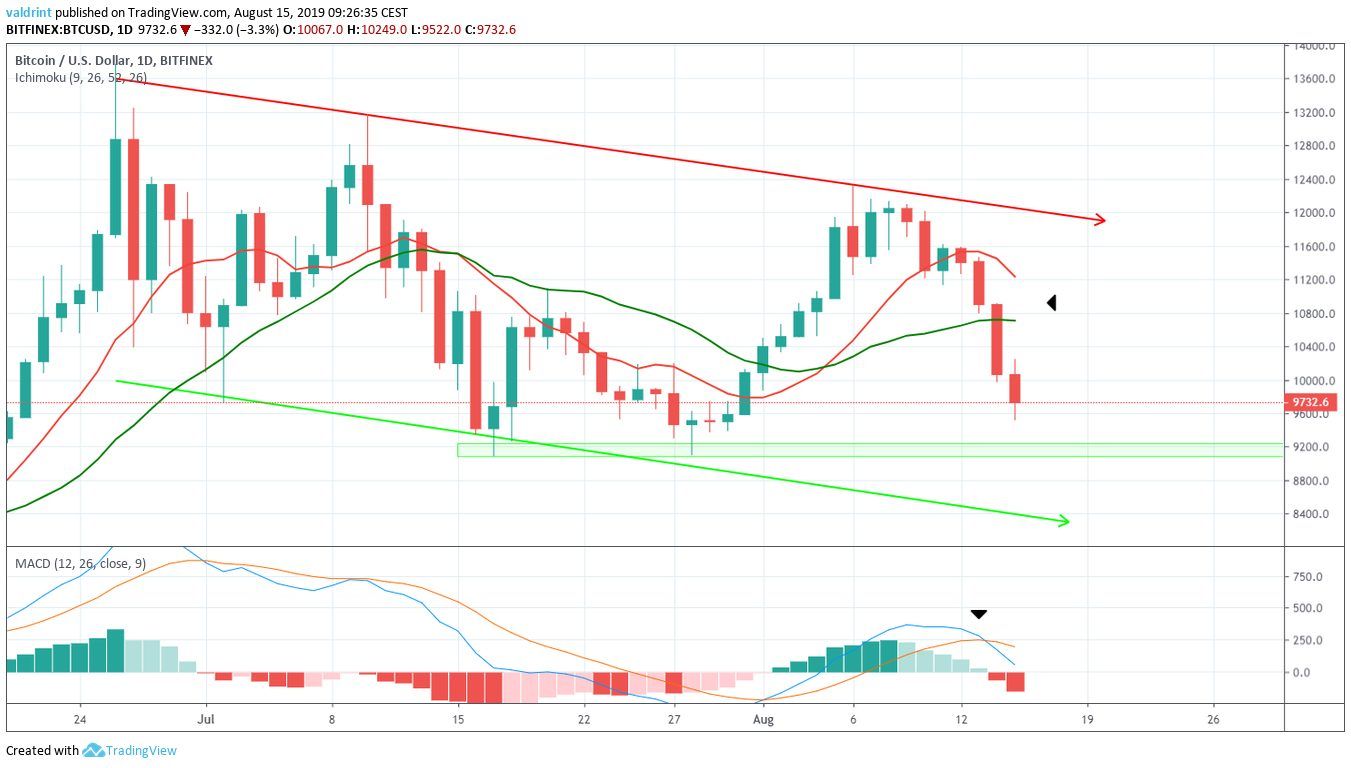
The Bitcoin price is currently trading below them.
Additionally, the MACD made a bearish cross on August 13.
On the other hand, a bounce on the 100-day MA would likely cause the bearish cross to be rejected and the price to move upward.
However, besides the support from the 100-day MA, there are currently no other signs pointing to a reversal.
Short-Term Momentum
In order to predict short-term movement, we will use the hourly RSI.
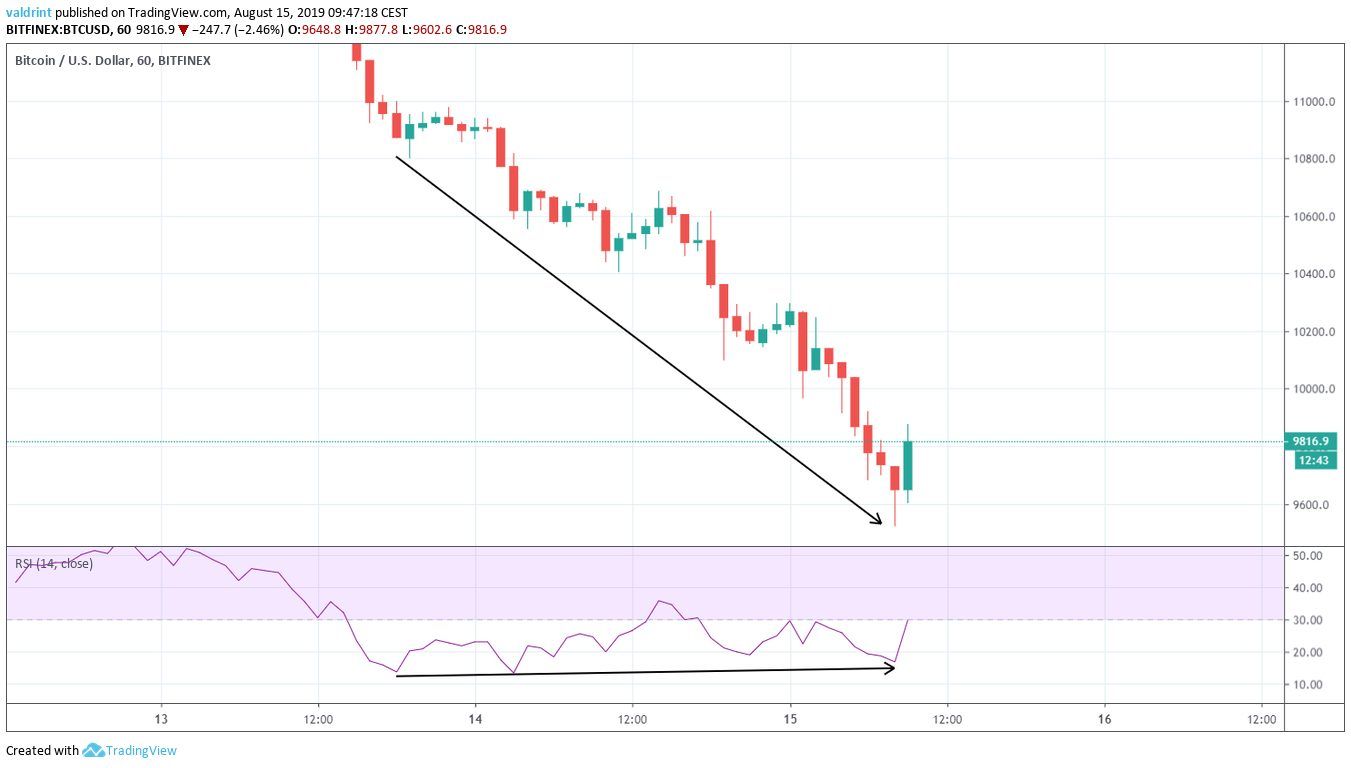
First, we can see that it is deep into oversold territory.
Additionally, it has been generating bullish divergence since August 13.
However, this divergence is not present in long-term time-frames.
Therefore, while we believe it will initiate an upward move, it should only be a short-term one.
If it does, we will use a Fibonacci retracement tool to find a possible target.
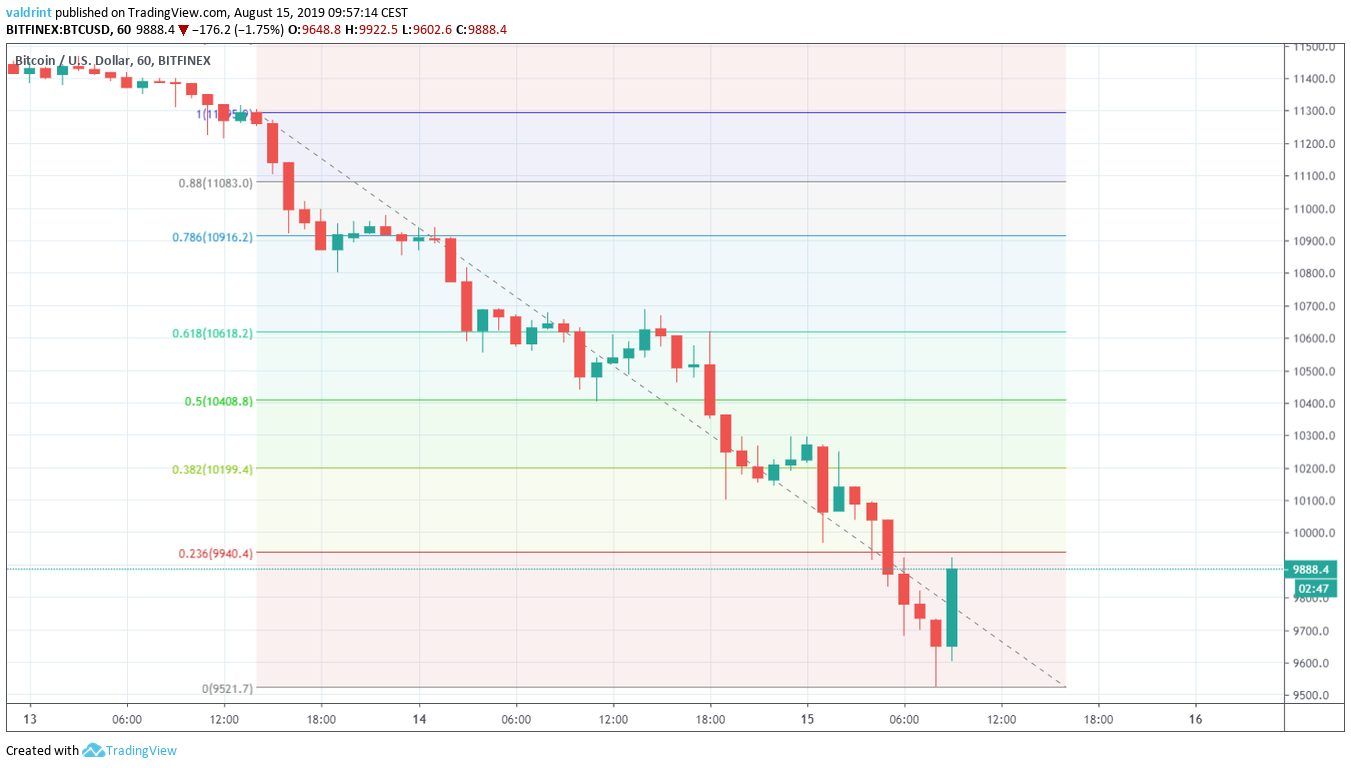
The most likely one is found between the 0.382 and 0.5 fib levels.
Therefore, we believe the Bitcoin price will retrace to $10,200 – $10,400 before resuming its downward movement.
Bitcoin Price Summary
The BTC price has been rapidly decreasing since August 12.
According to our analysis, it is likely to experience a bounce on the 100-day moving average before continuing the decrease towards the support area at $9200.
Do you think the BTC price will reach the support area? Let us know in the comments below.
Disclaimer: This article is not trading advice and should not be construed as such. Always consult a trained financial professional before investing in cryptocurrencies, as the market is particularly volatile.
Images are courtesy of Shutterstock, TradingView.


