
On August 10, 2019, the Bitcoin price reached a high of $11,923. A flash crash occurred the same day. The BTC price traded between $11,300 and $11,600 until August 13, when another decrease occurred.
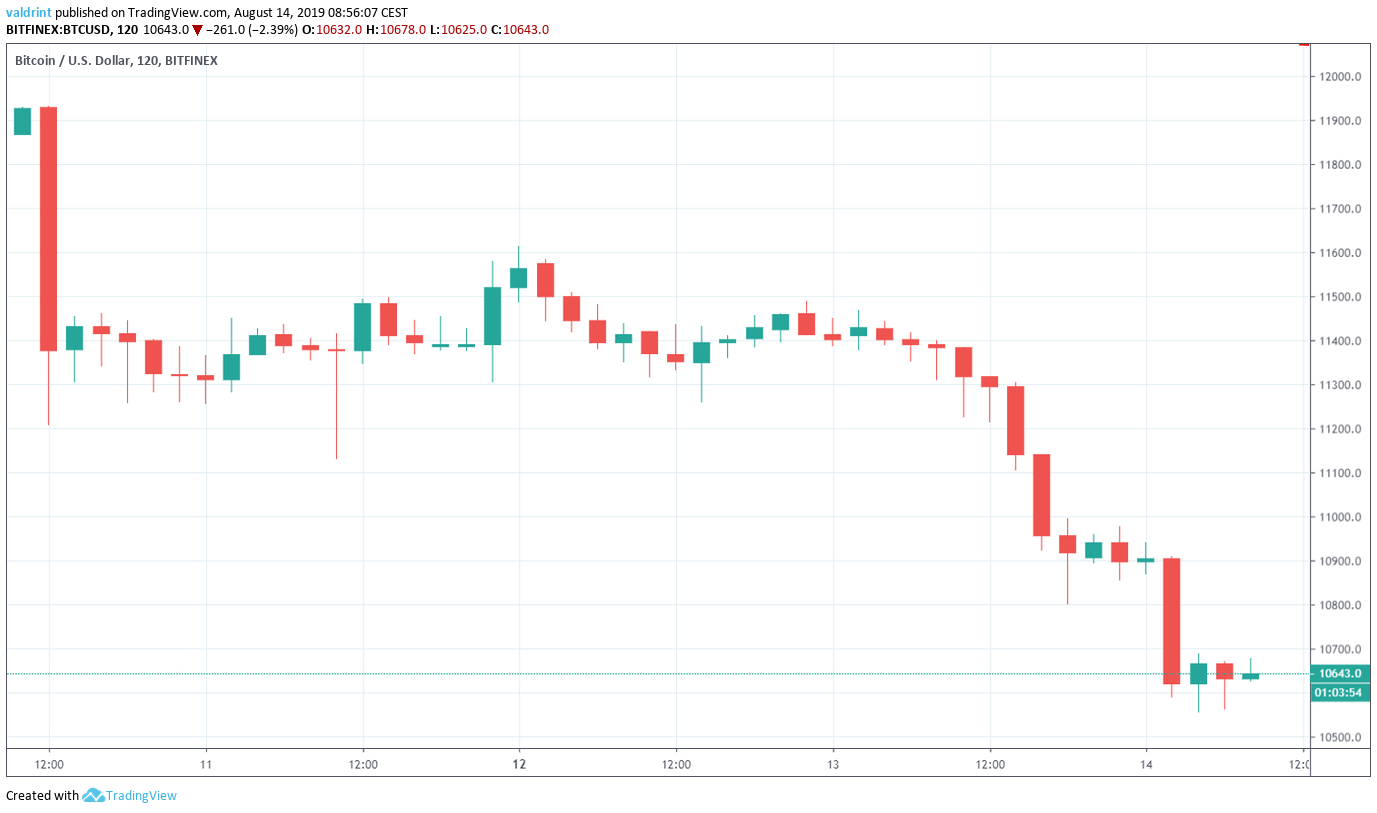
At the time of writing, the BTC price was trading slightly above $10,600.
How long will this downward move continue for Bitcoin? Continue reading and find out.
For our previous analysis, click here.
If you are interested in trading Bitcoin (BTC) and other cryptocurrencies with a multiplier of up to 100x on our new partner exchange with the lowest fees, follow this link to get a free StormGain account!

Bitcoin Price: Trends and Highlights for August 14
- BTC/USD is trading inside a descending channel.
- There is support at $10,600, $10,000 and $9400.
- There is short-term bullish divergence in the RSI & MACD.
- BTC is likely in the third wave of a five-wave Elliott formation.
Bitcoin Price in a Descending Channel
A look at the six-hour time-frame shows that BTC has been trading inside a descending channel since June 25.
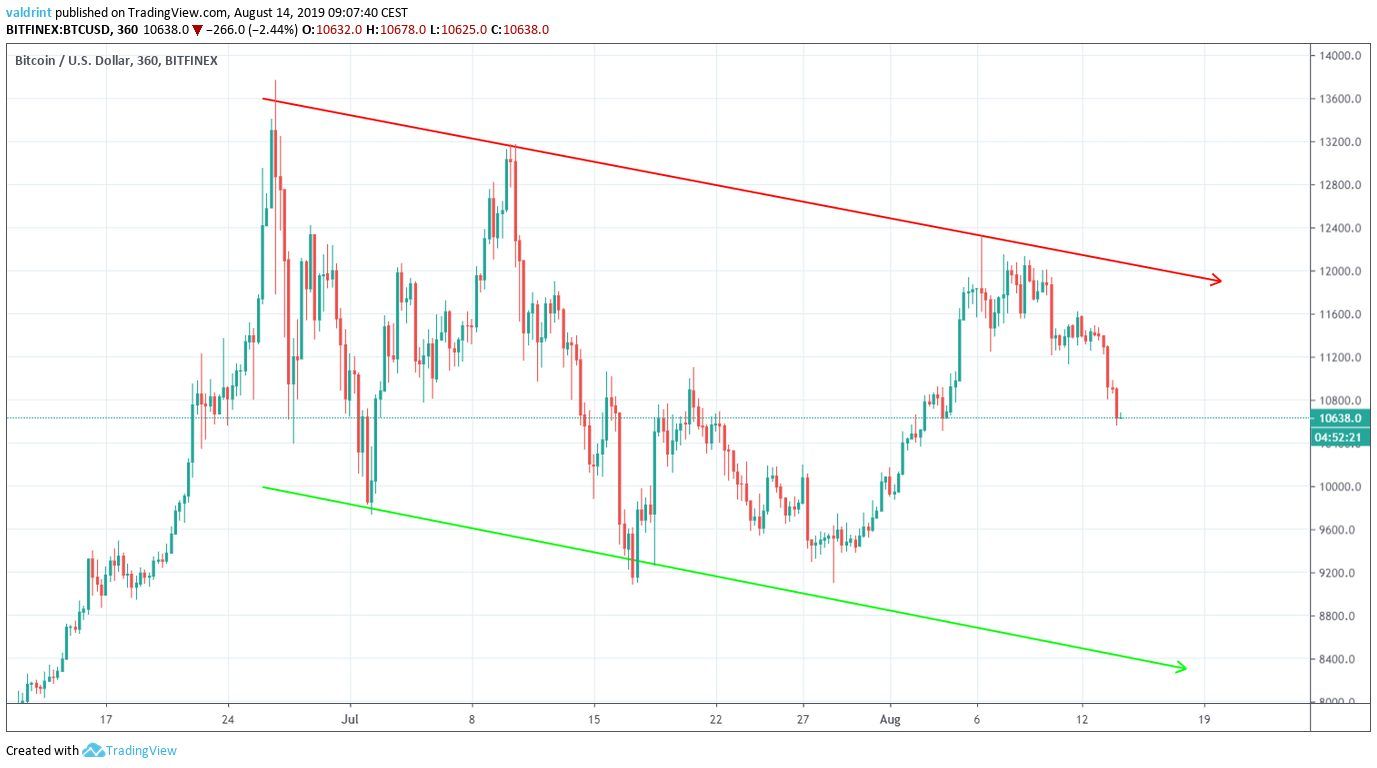
After reaching the resistance line on August 25, the BTC price began to decrease.
The decrease intensified on August 10.
Bitcoin has broken down below several support areas without experiencing an upward bounce.
Support Areas
In order to find the most likely areas that can provide a reversal, we will use a Fibonacci retracement tool and search for areas in which the Bitcoin price previously found support.
The strongest areas of support are those that coincide both with a Fib level and have previously acted as support.
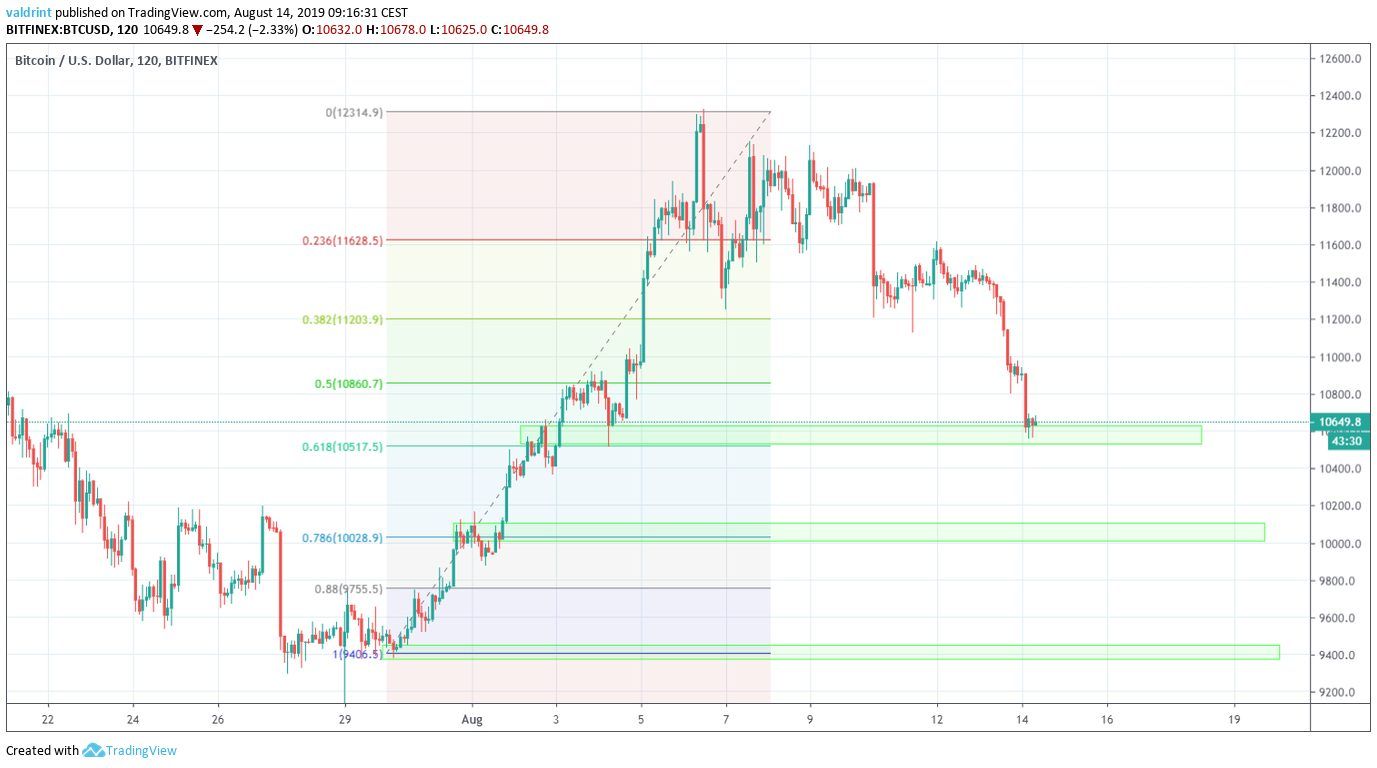
The first support area is found at $10,600, also coinciding with the 0.5 fib level.
This makes it a very suitable place to initiate a reversal.
Other significant support areas can be found at $10,000 and $9400.
Let’s take a look at them one by one and see where a reversal is likely to begin.
Possible Reversal
A look at the 30-minute time-frame shows that the Bitcoin price has made a double bottom inside the first support area.
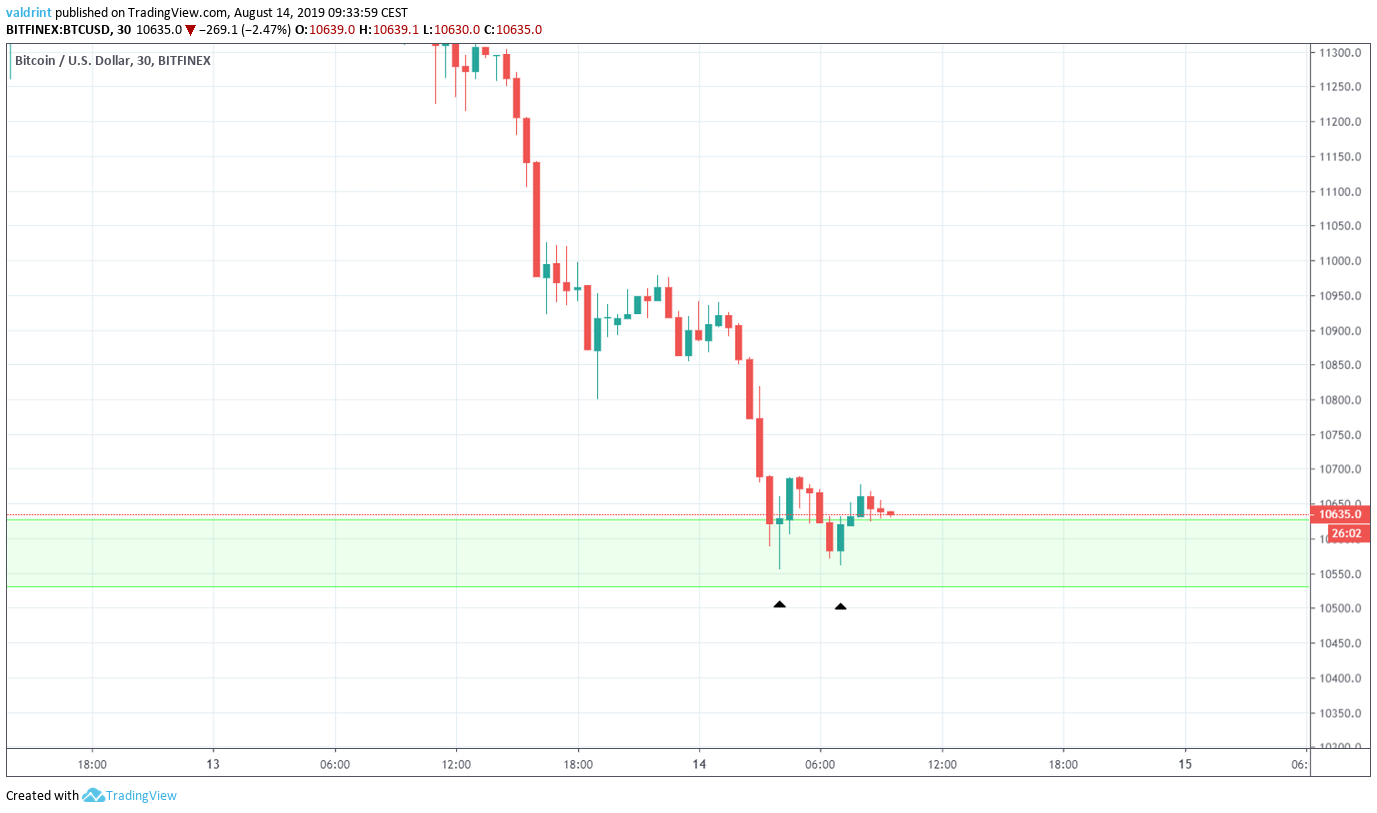
Additionally, it created a bullish doji the first time it reached the area, which is a sign of bullish pressure.
A look at the RSI and MACD shows that both have generated bullish divergence.
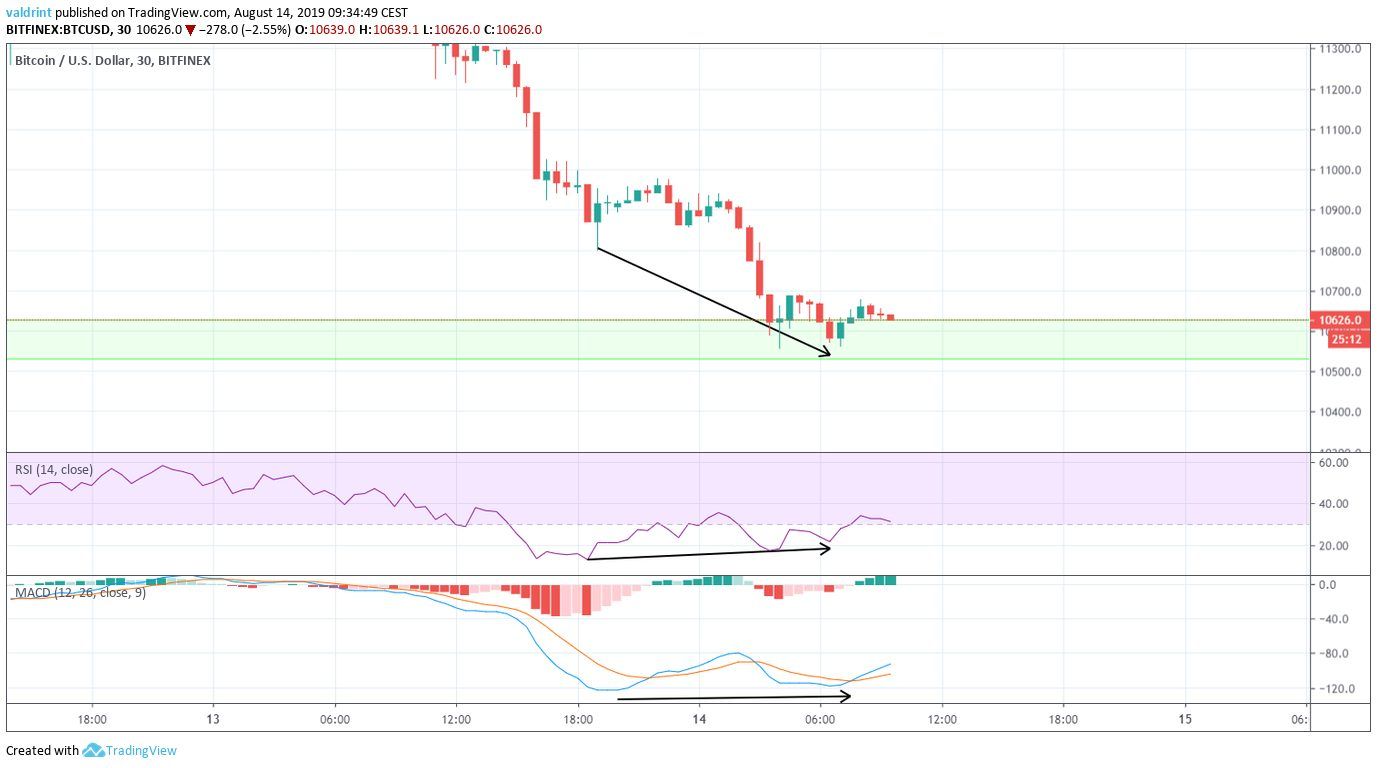
While the divergence is significant, it is only present in very short-term time-frames.
Therefore, while an upward move may be likely to begin, we do not think it is likely to be a strong one.
Future Movement
Below we have outlined a possible five-wave Elliott formation for the Bitcoin price.
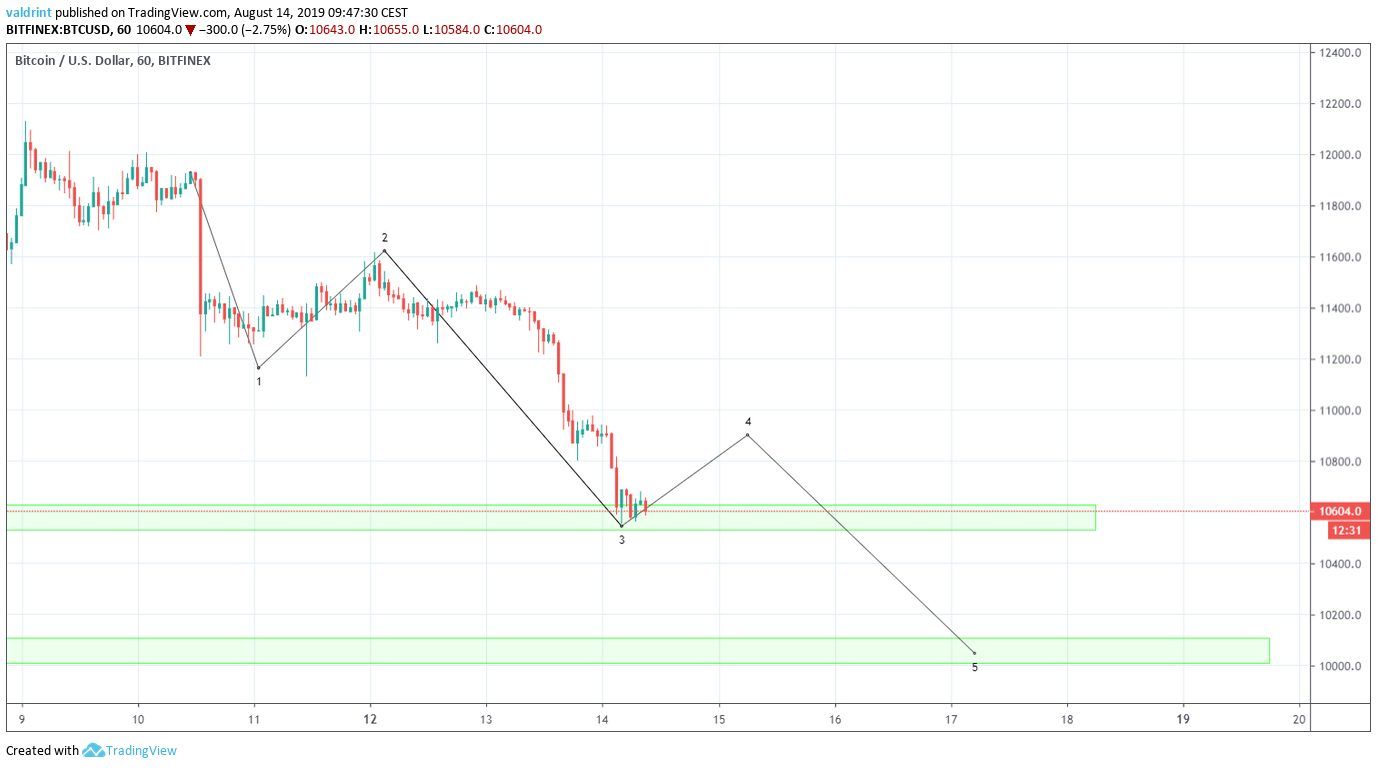
We believe the BTC price is likely in the end of the third wave.
The fourth wave (upward) should begin soon, aided by the short-term divergence.
Afterwards, we should experience the final downward wave which takes us to the next support area at $10,000.
Bitcoin Price Summary
The Bitcoin price has been on a downtrend since August 10.
According to our analysis, it is likely to initiate a short-term upward move and then decrease towards $10,000.
Do you think BTC will reach the second support area? Let us know in the comments below.
Disclaimer: This article is not trading advice and should not be construed as such. Always consult a trained financial professional before investing in cryptocurrencies, as the market is particularly volatile.
Images are courtesy of Shutterstock, TradingView.
