


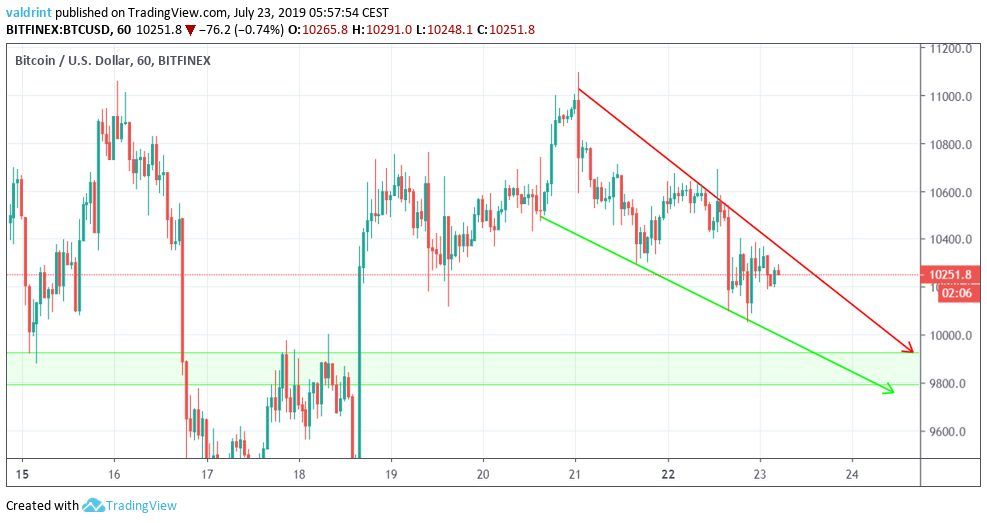
On July 18, 2019, the Bitcoin price reached a low of $9160. An upward move ensued. The BTC price reached highs of $9760 the next day. The increase continued until July 21. Since then, BTC has been gradually decreasing.
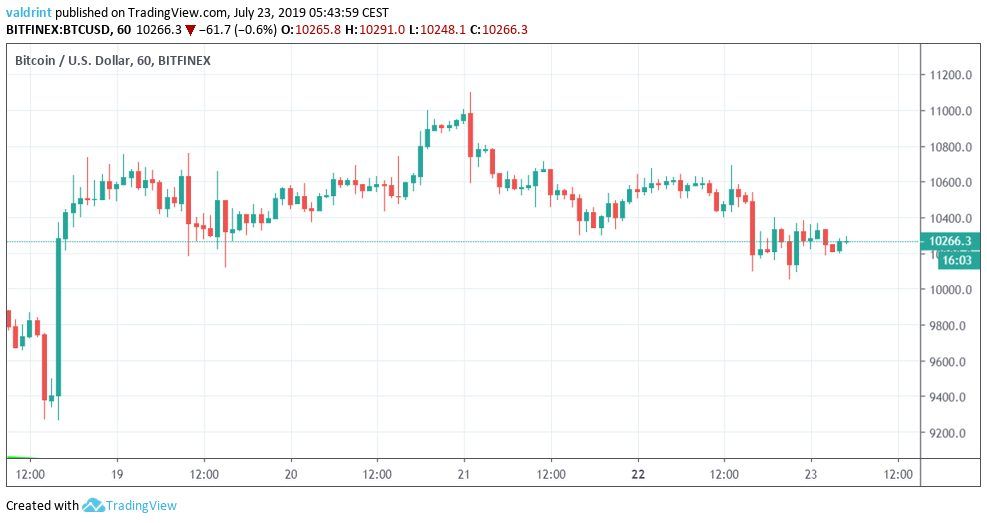
How long will this decrease continue? Keep reading below in order to find out.
For our previous analysis, click here.
If you are interested in trading Bitcoin (BTC) with a multiplier of up to 100x on our new partner exchange with the lowest fees, follow this link to get a free StormGain account!
Bitcoin Price: Trends and Highlights for July 23
- BTC/USD broke down from a Head and Shoulders Pattern.
- It is trading inside a descending wedge.
- There is short-term bullish divergence developing in the RSI.
- The closest support area is found near $9800.
- There is significant resistance near $11,000 & minor resistance near $10,400.
- Daily moving averages have made a bearish cross
Previous BTC Price Movement
In the period from July 18-22, the Bitcoin price created a head and shoulders pattern.
We discussed this pattern in our previous analysis.
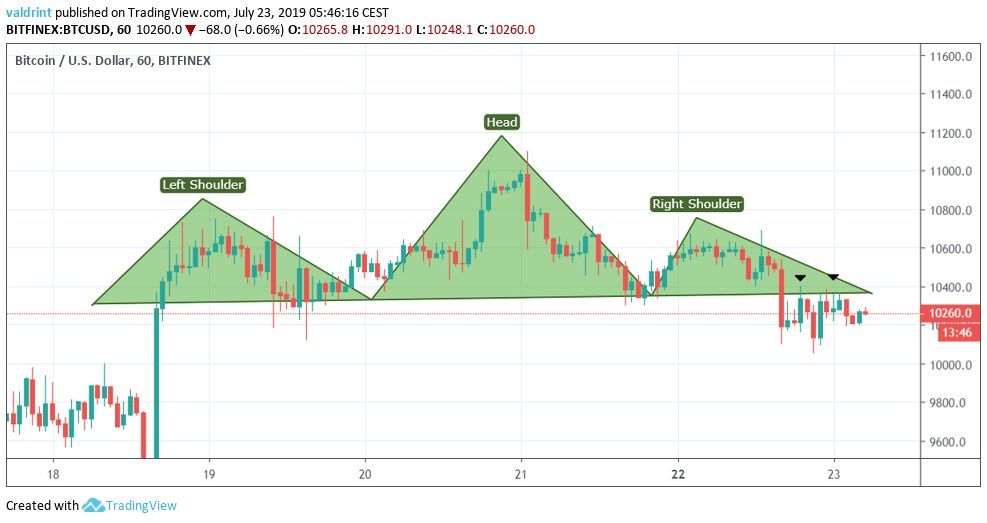
On July 22, BTC broke down from this pattern.
Afterward, it came back to touch the support line of the pattern and validate it as resistance.
BTC Price: Current Descending Wedge
Since reaching a high of $11,000 on July 21, the BTC price has been trading inside a descending wedge.
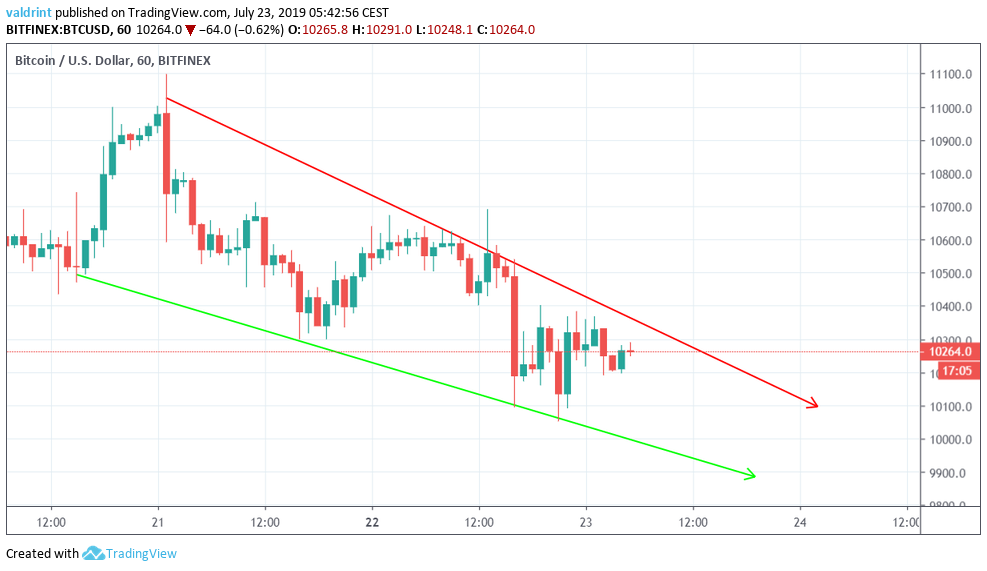
The descending wedge is a bullish pattern, making a price breakout more likely.
Furthermore, there is a slight bullish divergence developing in the RSI.
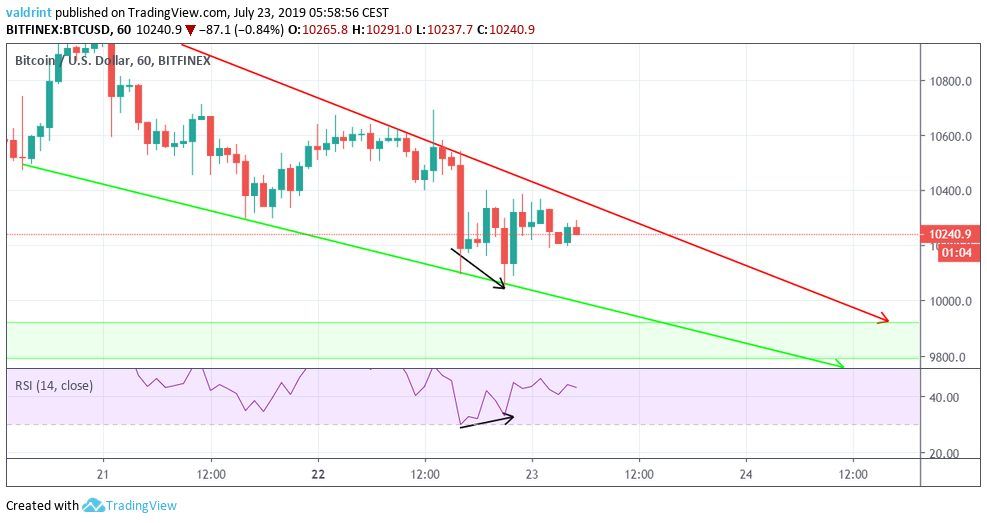
However, it is not very significant and it is not present in the MACD.
The significance of the divergence is reduced since BTC is not inside a noteworthy support area where it could initiate a reversal.
One such support area is traced below.
It is found slightly above $9800.
If the price reaches it, it would be likely to initiate a reversal.
Furthermore, if the RSI generates bullish divergence when the price does so, it would further increase the chances of a breakout transpiring.
Long-Term
A look at the daily time-frame shows that the Bitcoin price has been trading inside a descending channel since June 26.
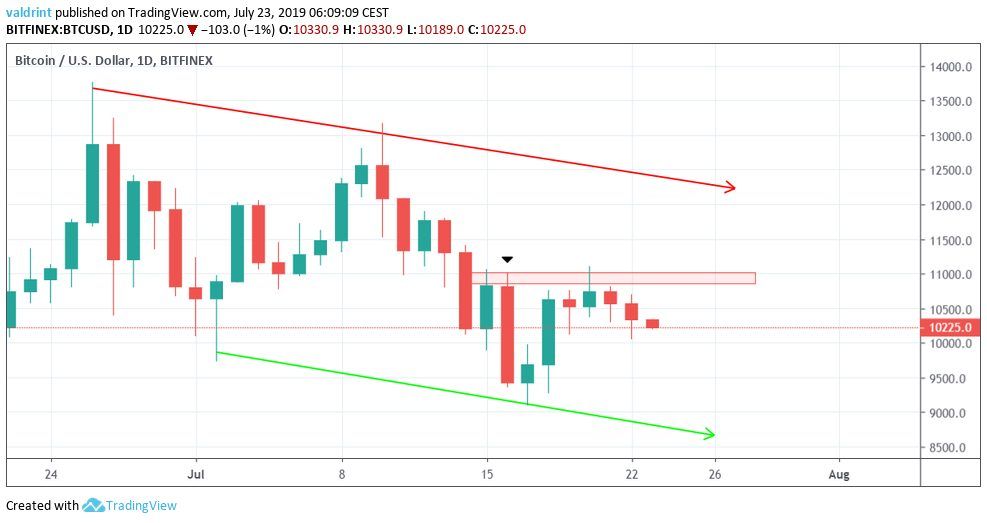
Additionally, we can see one resistance area at $11,000.
It marks the opening of the bearish engulfing candlestick on July 16. The recent increases have been contained within its body.
A look at moving averages (MA) enforces the fact that the price is likely in a downtrend and there is significant resistance above it.
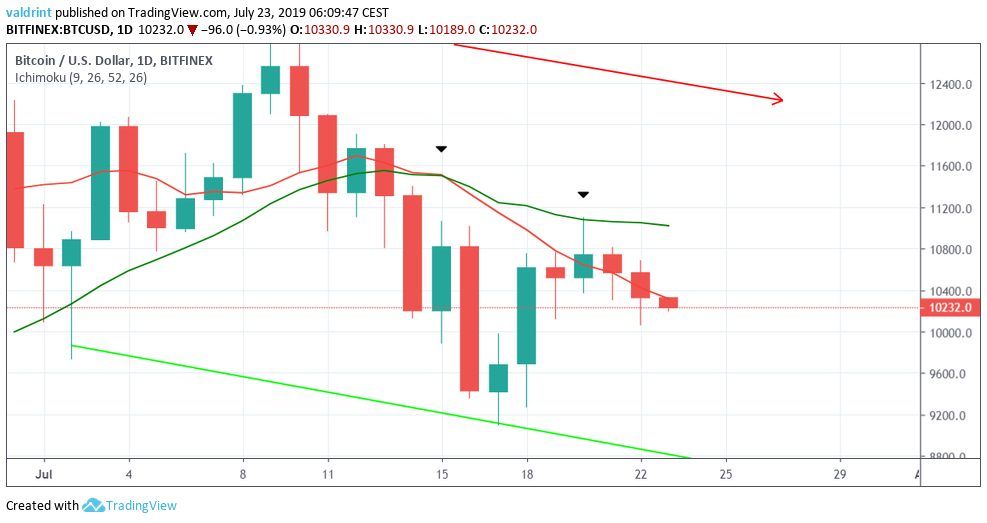
First, a bearish cross between the 10- and 20-period MAs occurred on July 14.
It reached the latter in an unsuccessful breakout attempt on July 20, before beginning to decrease.
At the time of writing, it is trading below both MAs, facing very close resistance from the former.
Reversal Areas
Let’s go back to the short-term and outline possible price movement.
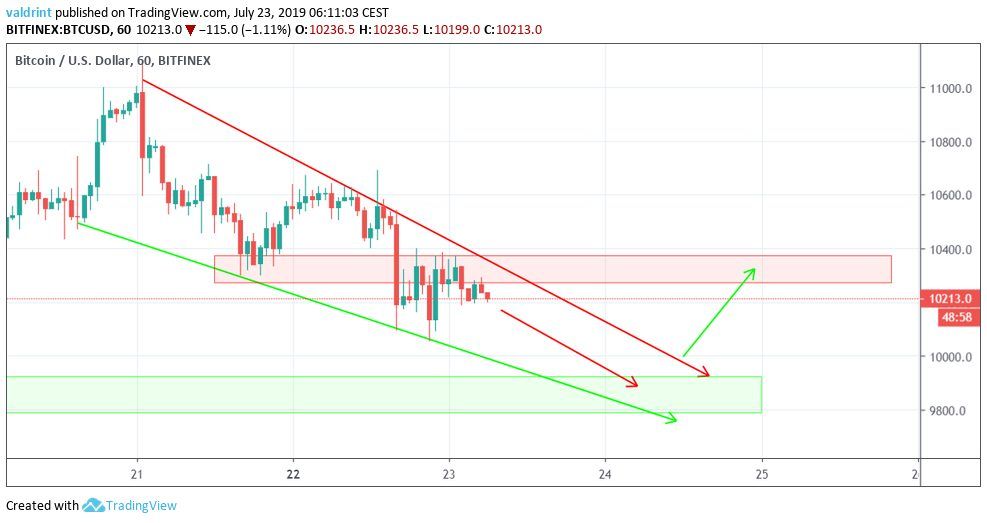
We stated in the previous section that the price is likely to decrease within the confines of the wedge until it reaches the support area at $9800.
There, it is likely to break out.
If it does, we believe it will reach the resistance area at 10,400 before again decreasing.
This area also coincides with the support line of the head and shoulders pattern.
Summary
The BTC price is trading inside a descending wedge.
According to our analysis, it is likely to continue decreasing at the rate predicted by the wedge until it reaches the support area outlined above.
Afterward, a breakout is likely.
Do you think the BTC price will break out from the wedge? Let us know in the comments below.
Disclaimer: This article is not trading advice and should not be construed as such. Always consult a trained financial professional before investing in cryptocurrencies, as the market is particularly volatile.
Images are courtesy of Shutterstock, TradingView.


