


On July 16, 2019, the Bitcoin price reached a high of $11,058. A rapid decrease ensued. The next day, the BTC price reached lows of $9084. Since then, it has been increasing. On July 21, it reached a high of $11,098.
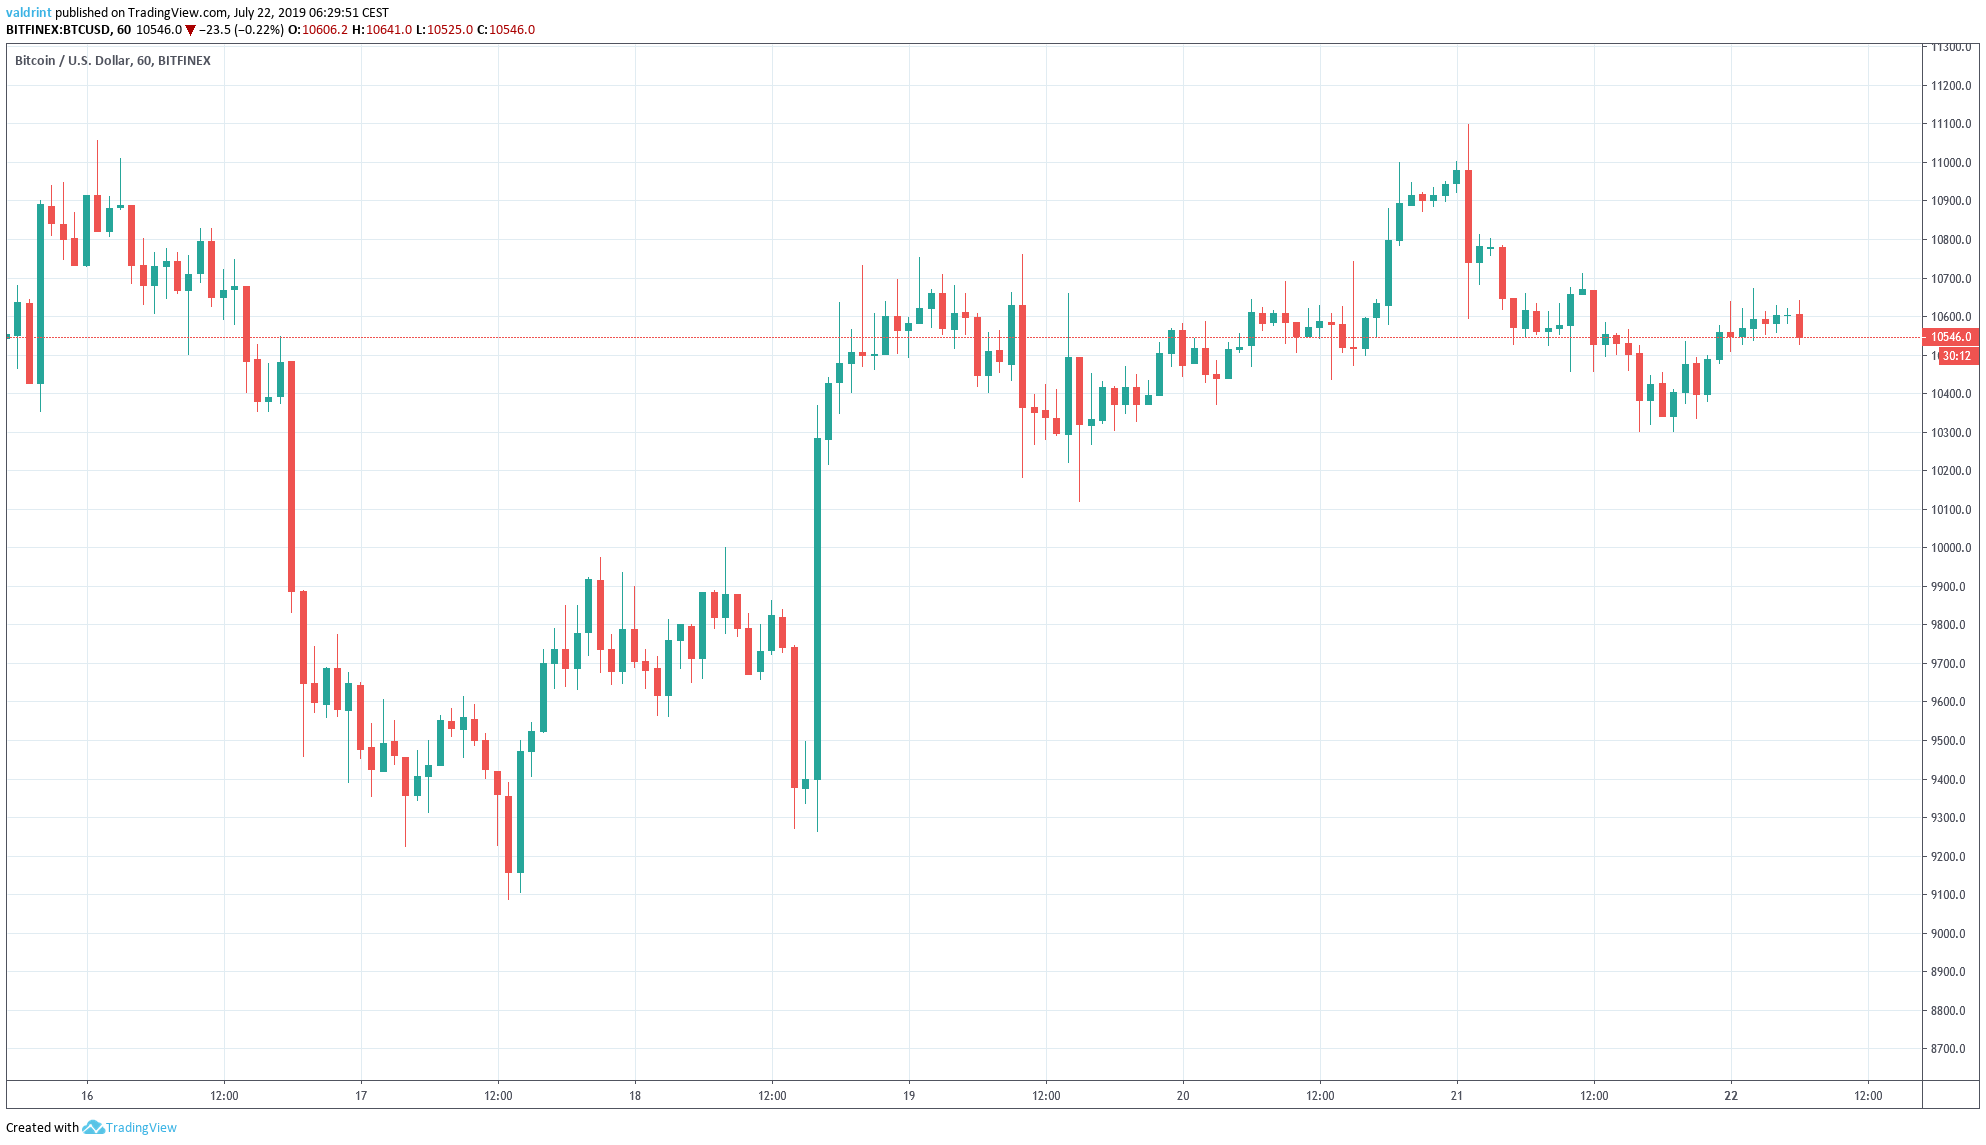
Where is it going next? Keep reading below in order to find out.
For our previous analysis, click here.
If you are interested in trading cryptocurrencies with a multiplier of up to 100x on our new partner exchange with the lowest fees, follow this link to get a free StormGain account!
Bitcoin Price: Trends and Highlights for July 22
- BTC/USD is trading inside an ascending triangle.
- It is trading inside a long-term descending channel.
- Short- and long-term moving averages are bearish.
- There is support near $9800.
- There is resistance near $11,400.
BTC Price in an Ascending Triangle
Since reaching a low of $9048 on July 17, the Bitcoin price has been increasing — following the ascending support line outlined below:
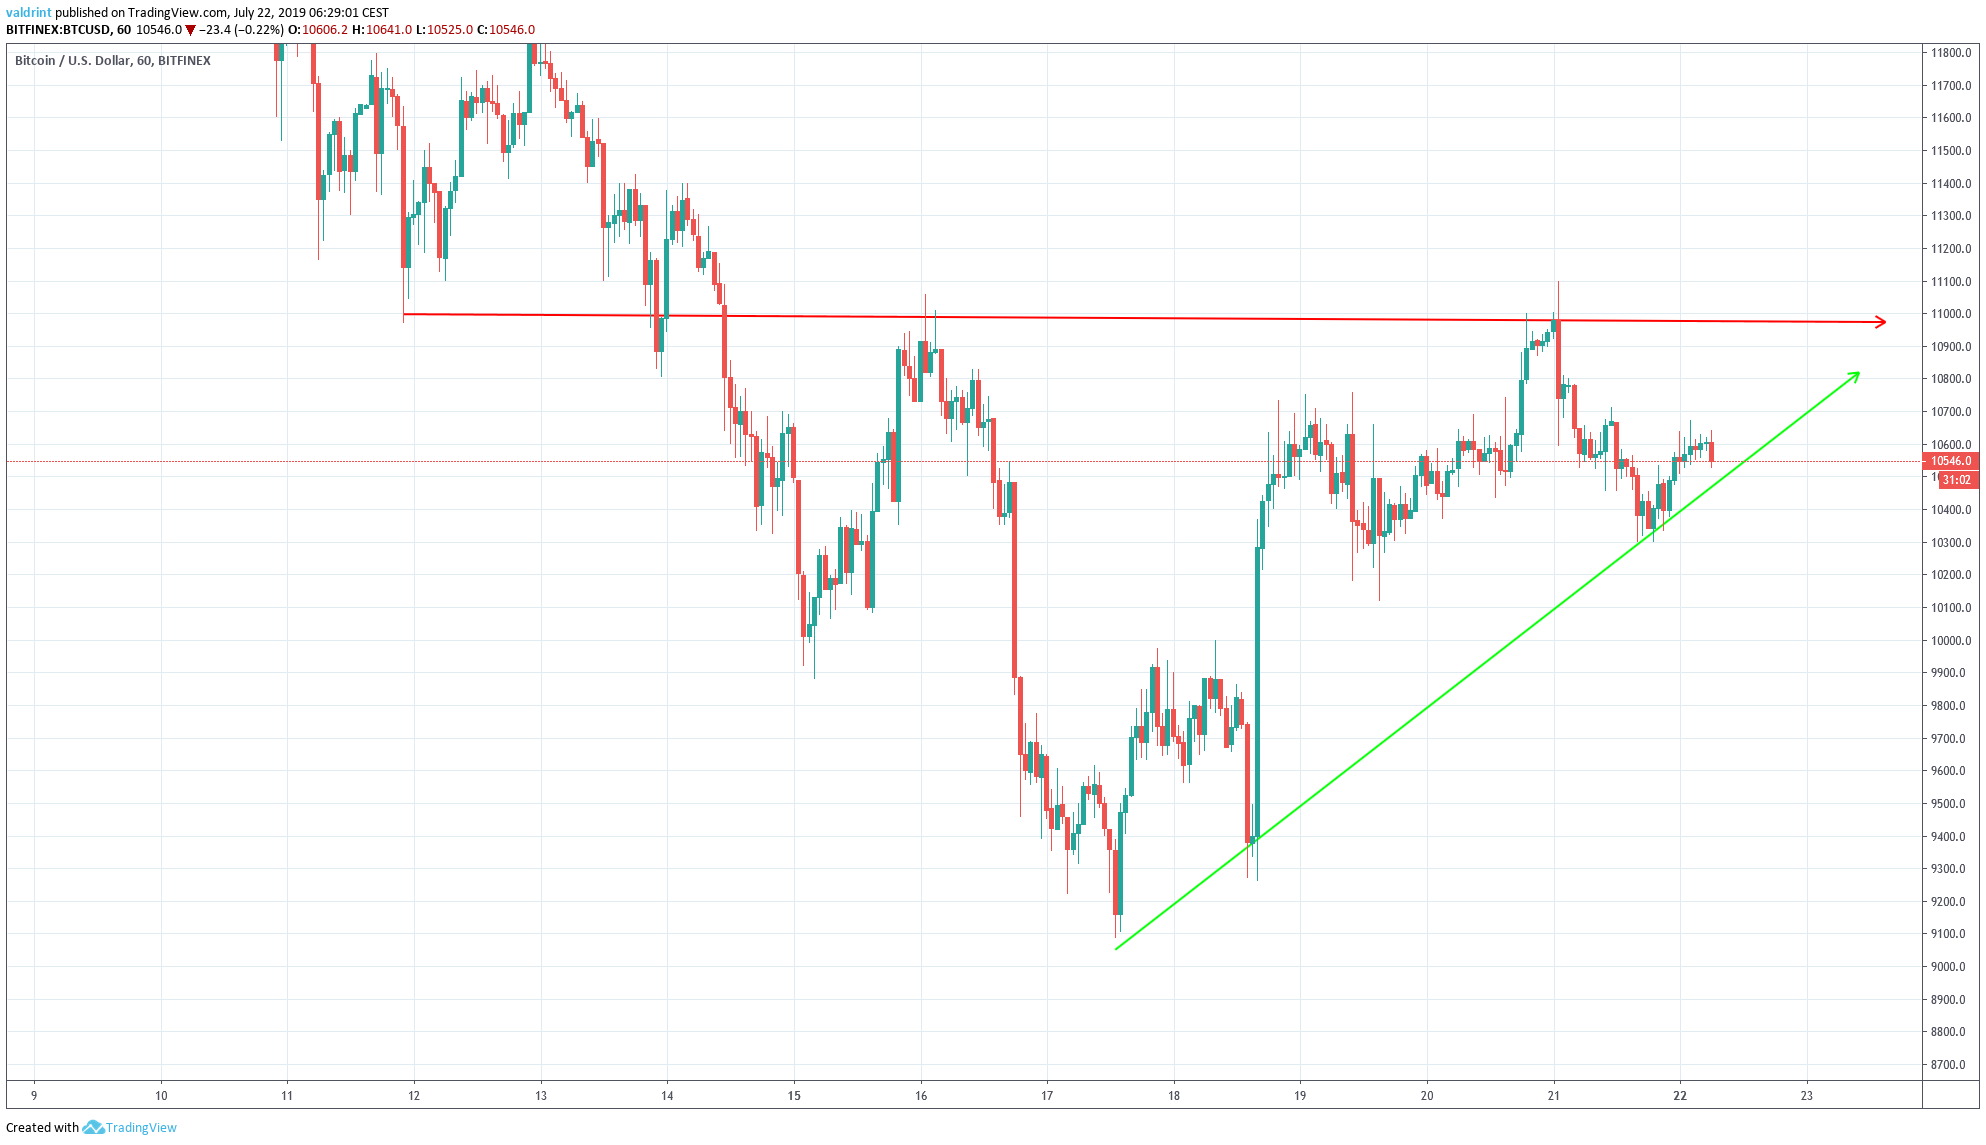
Combined with the previous resistance line near $11,000, the Bitcoin price is trading inside an ascending triangle.
The ascending triangle is considered a bullish pattern, making price breakouts more likely.
A look at a longer-term time-frame shows that this triangle is contained within a descending channel that has been in place since BTC reached a high of $13,764 on June 26.
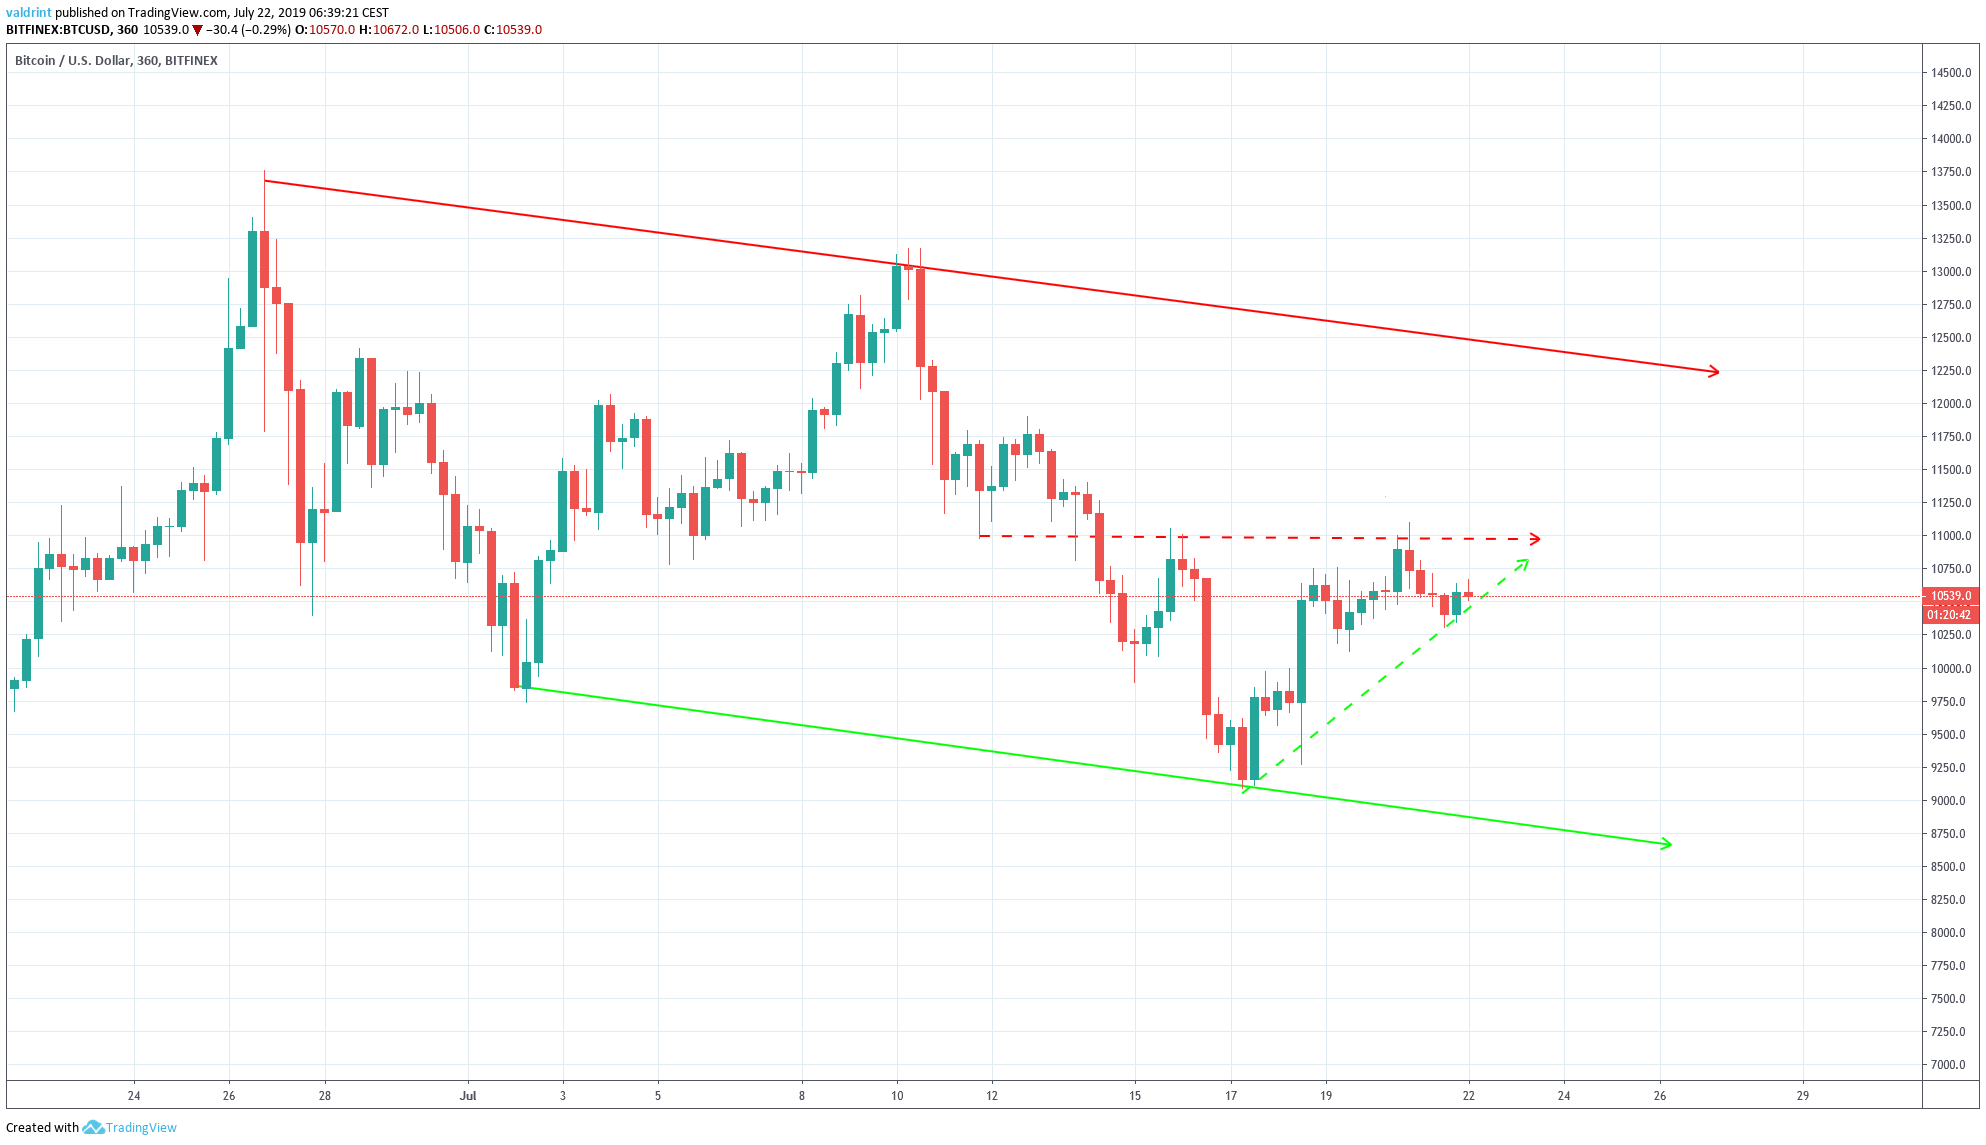
While both the resistance and support lines have been touched only twice, the lines are drawn parallel to each other — possibly making this the correct pattern.
A breakout from the triangle would likely take the Bitcoin price all the way to the resistance line.
Is that likely?
Moving Averages
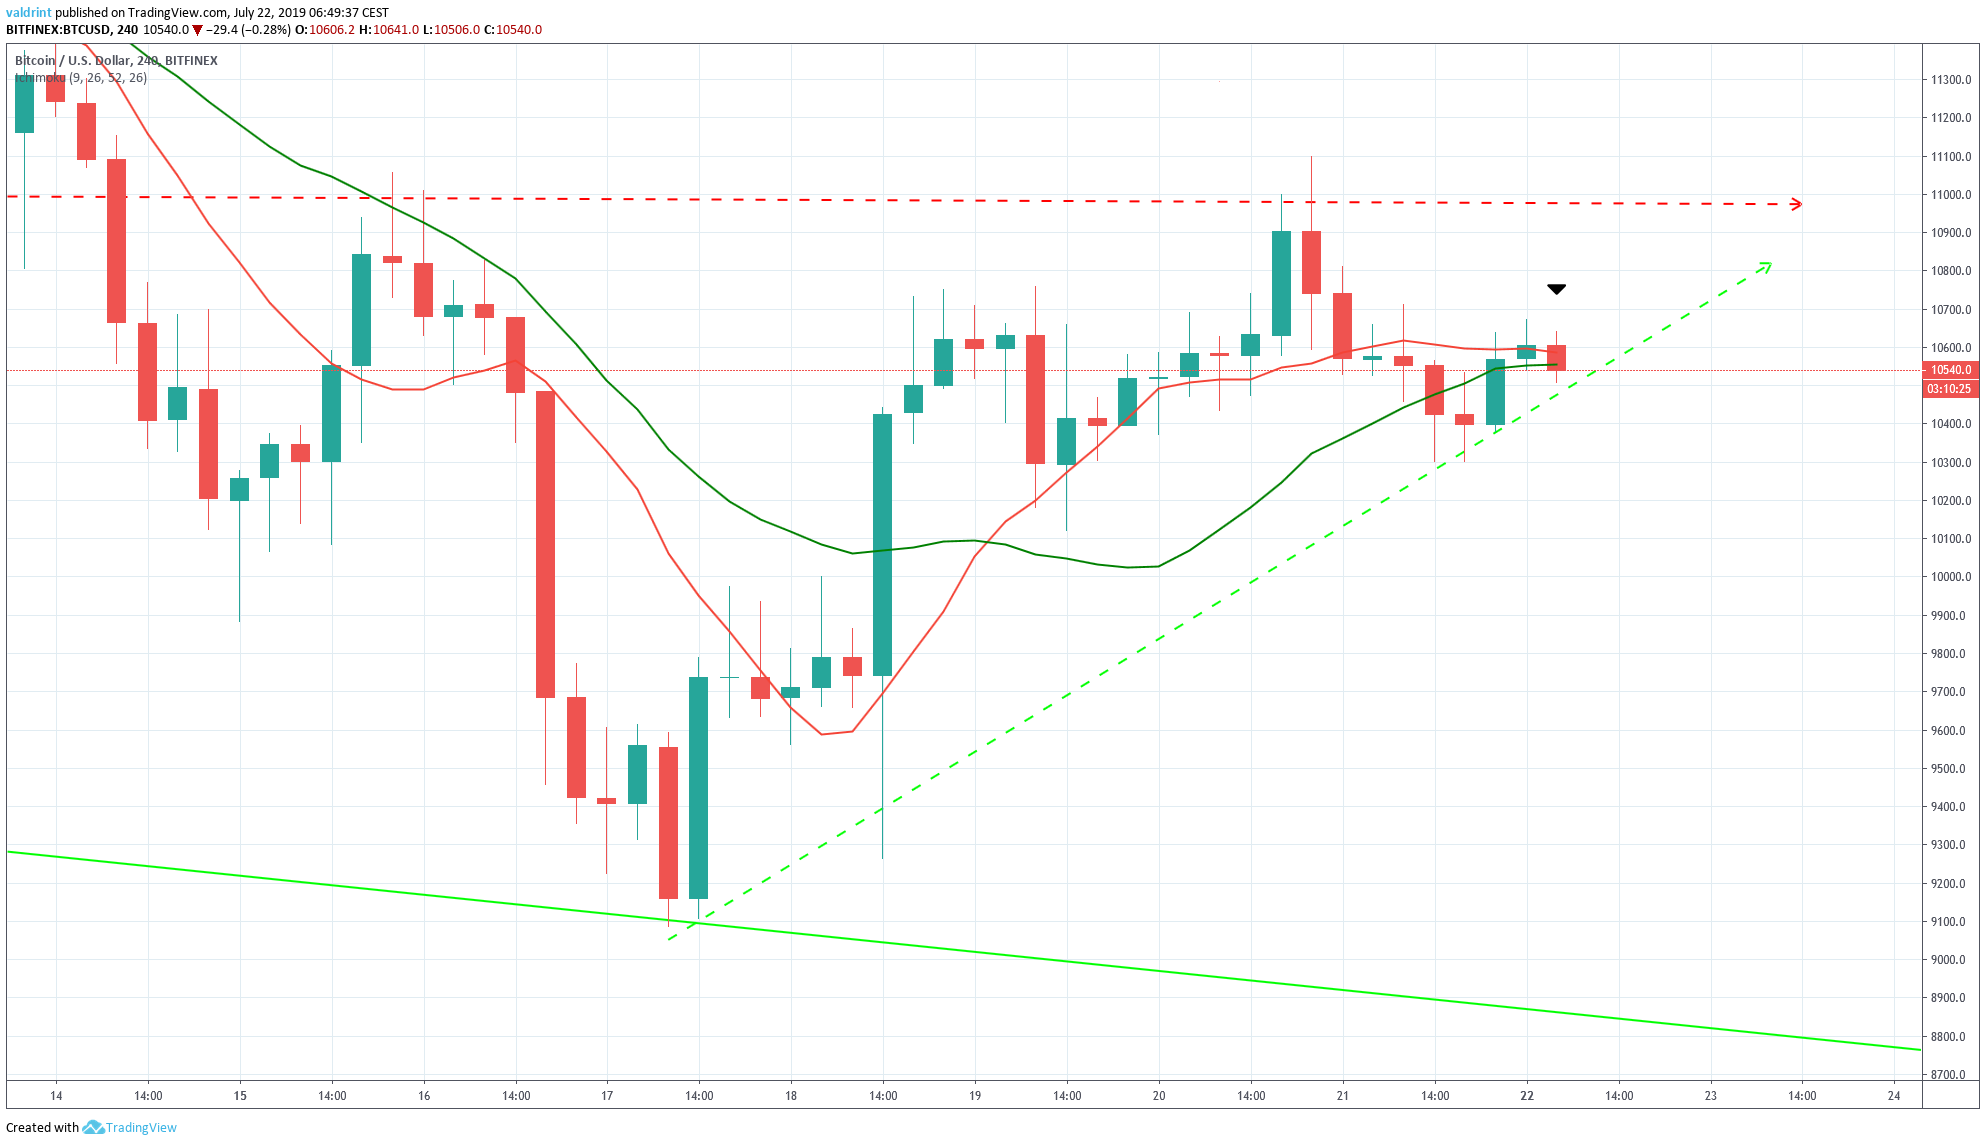
The price is trading below both the 10- and 20-period MAs, which are offering resistance to the price and are very close to making a bearish cross.
In time-frames of three hours or less, this cross has already occurred.
A similar observation is taken from the daily time-frame.
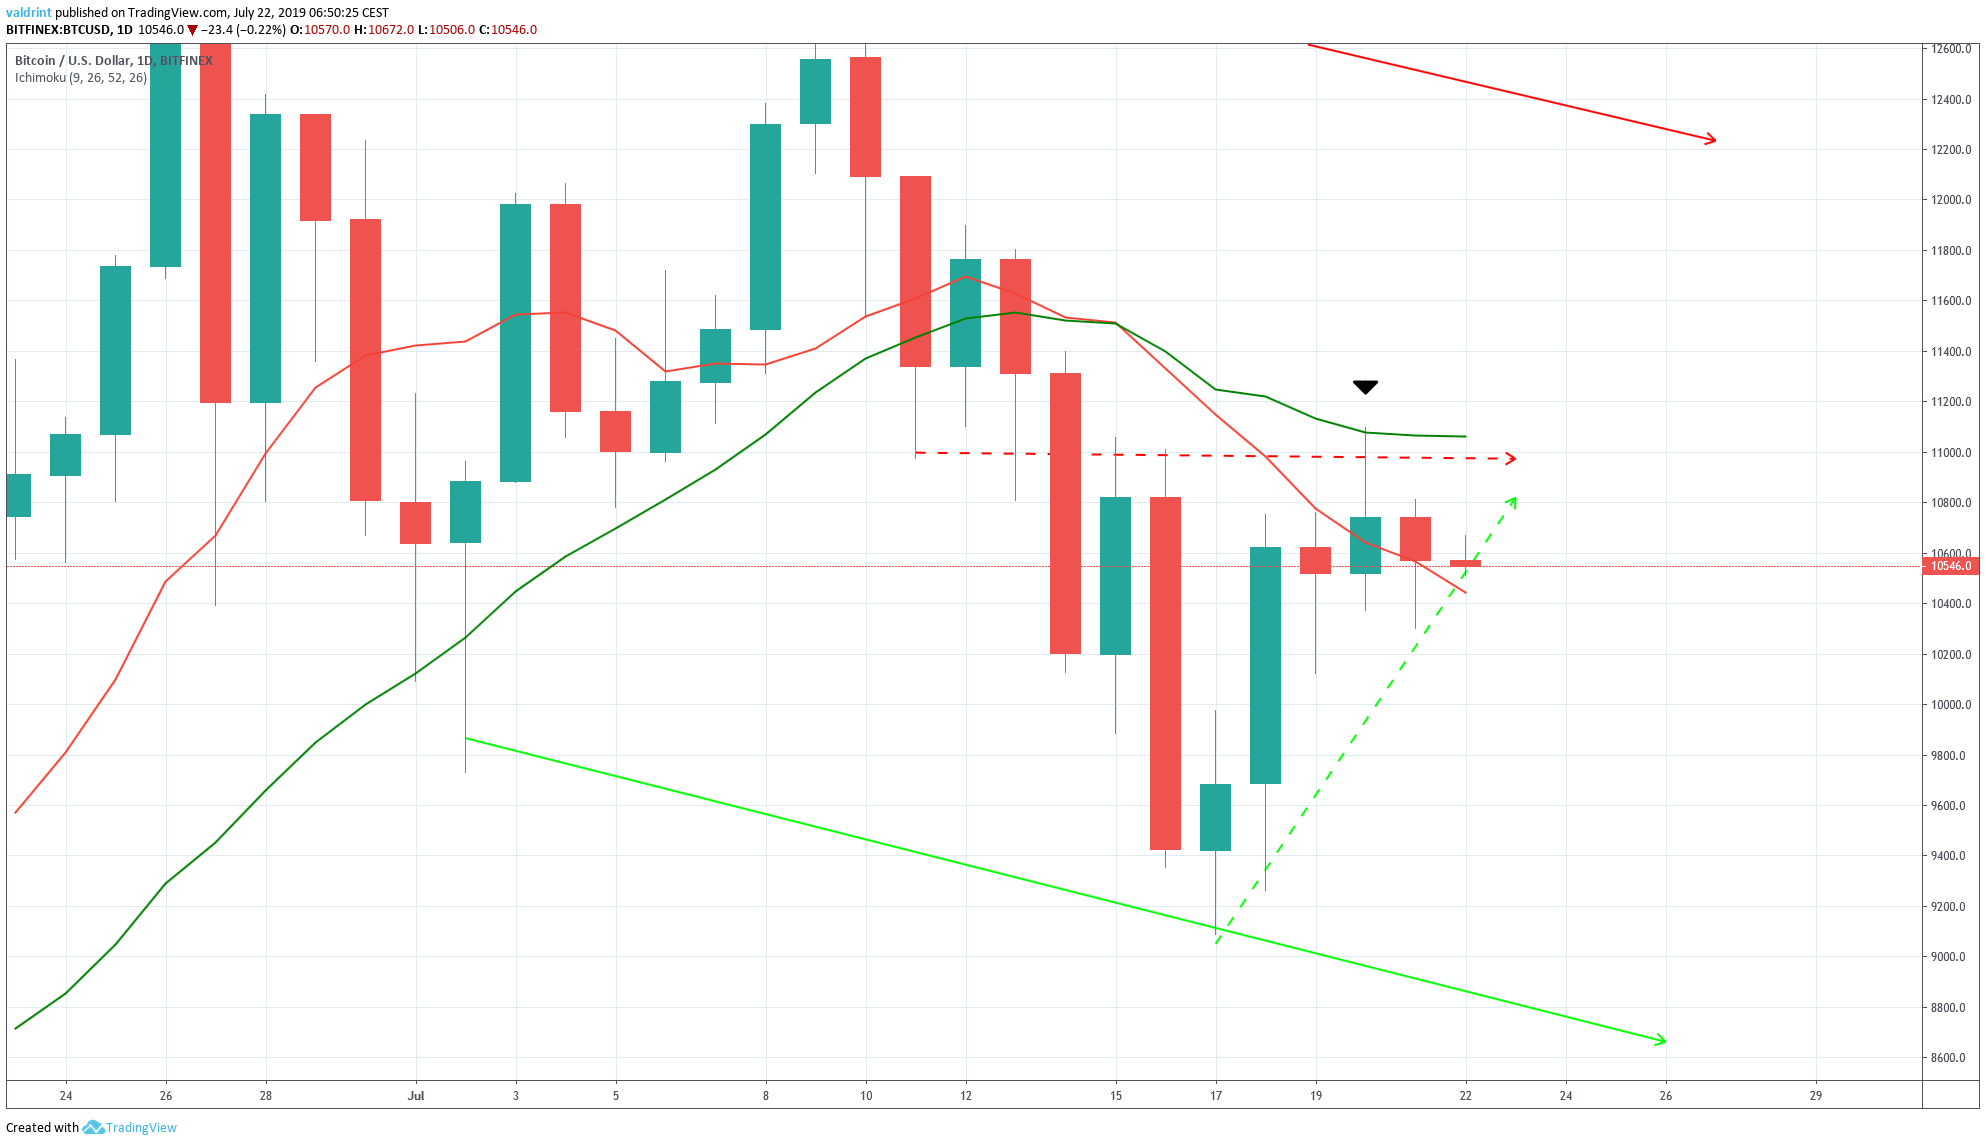
The 10- and 20-period MAs have already made a bearish cross. The price has been trading below them since.
A recent attempt at a breakout on July 20 ended at the 20-day MA.
However, recent price increases have taken it above the 10-day MA, but it is heading downward and does not look ready to move upward and continue providing support to the price
Finally, a look at daily candlesticks gives us another bearish development.
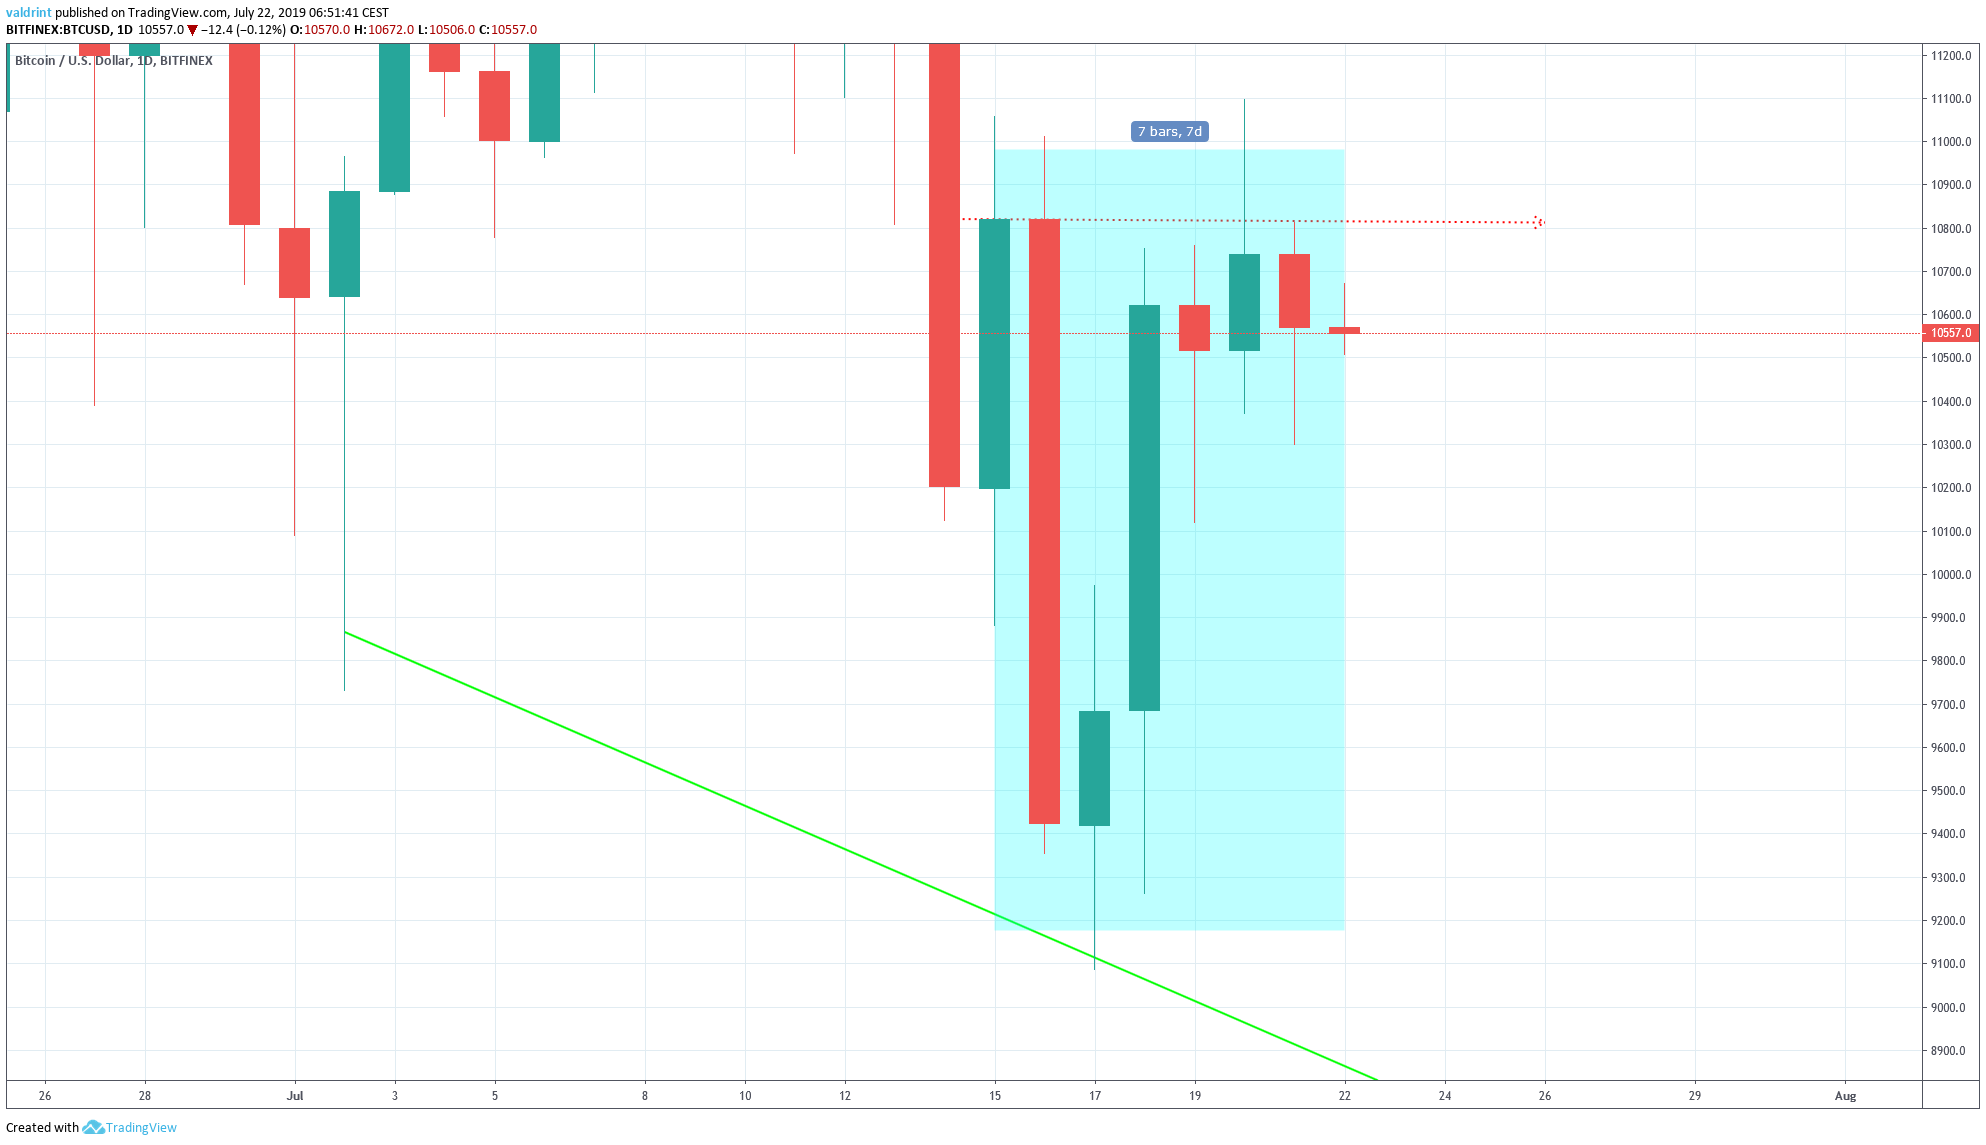
We can see that all the price increases since July 16 have been contained inside the bearish candlestick that transpired that day.
This is a sign that we have still not cleared the entire selling pressure from the previous decrease.
Long-Term
A look at the weekly time-frame provides better visualization of previous price movement and current outlook:
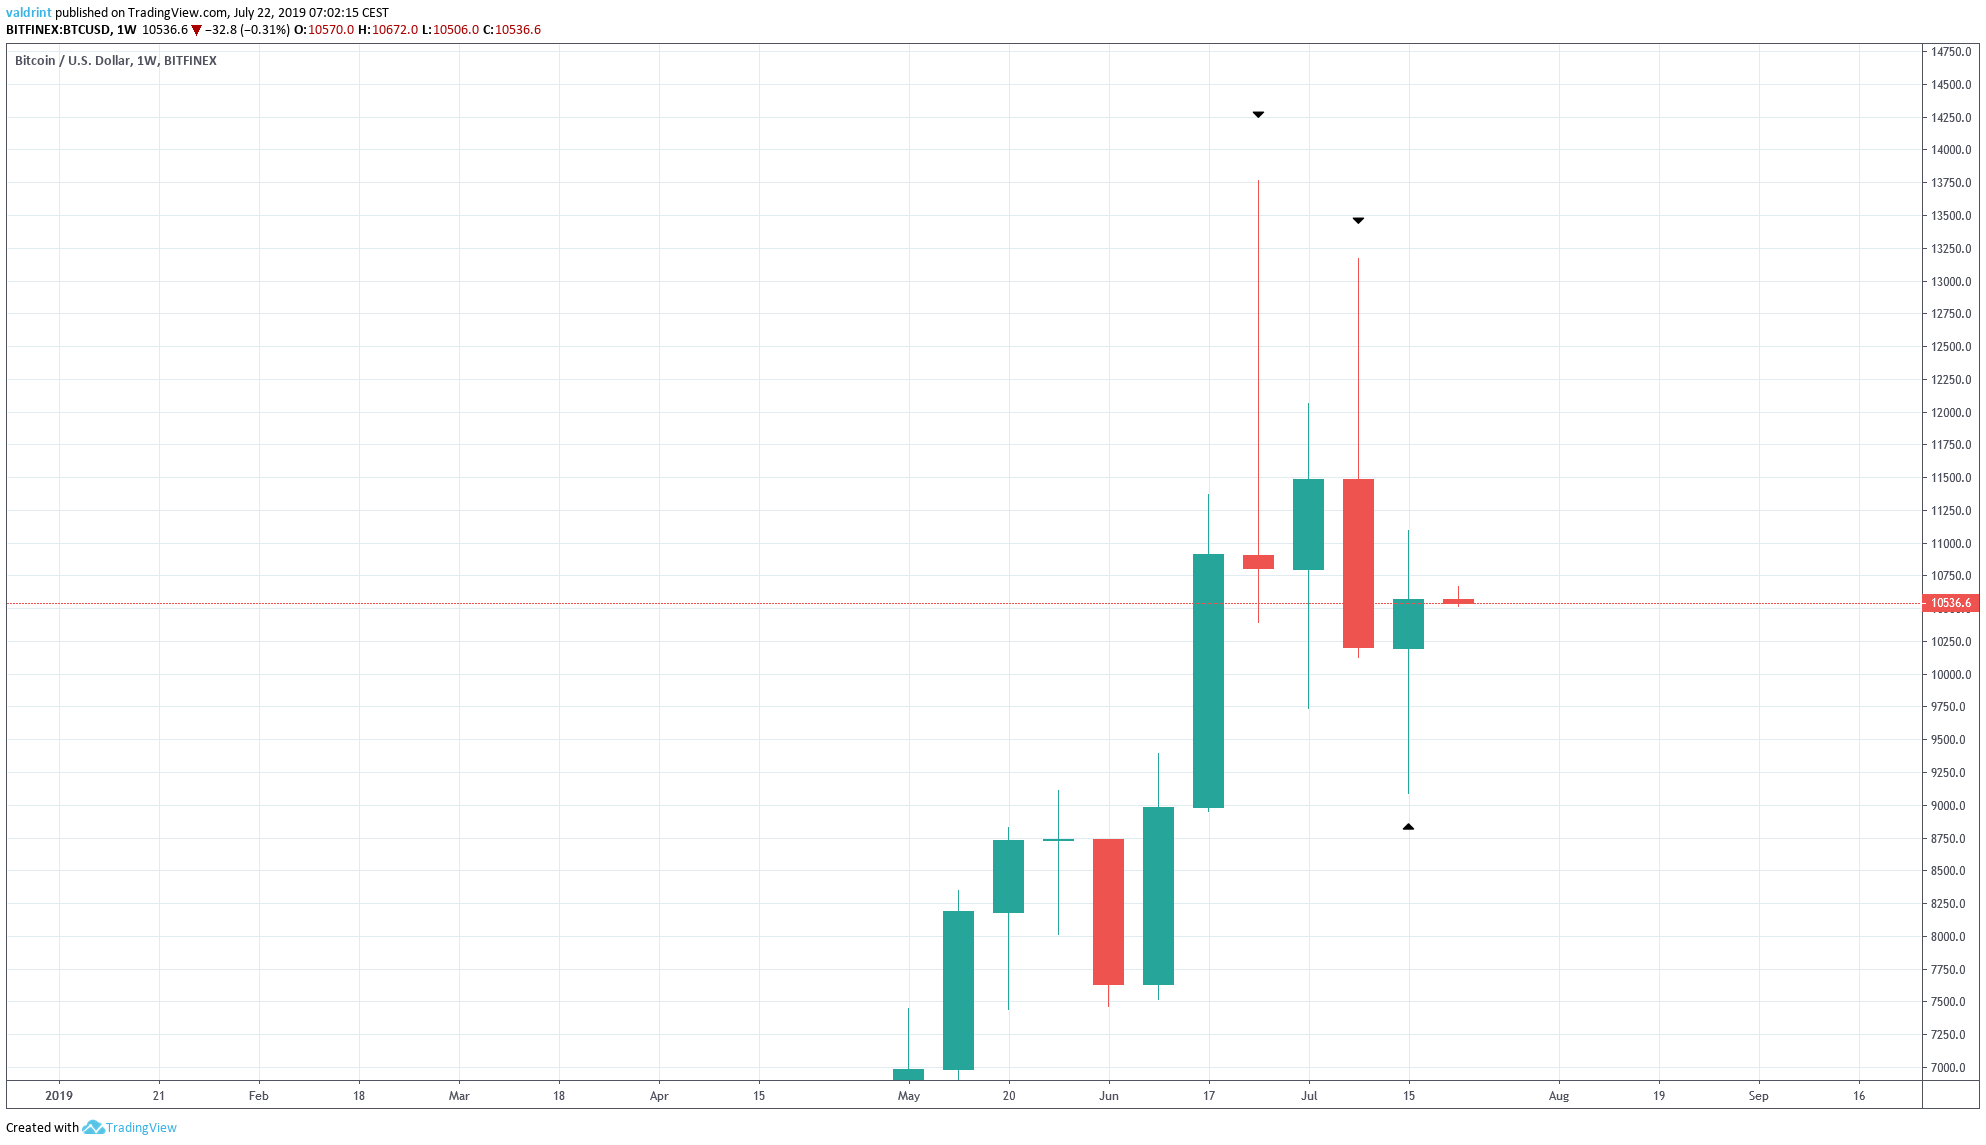
While the previous week’s candlestick has been bullish, it still pales in comparison to the decrease preceding it.
This is especially evident in the very long upper wicks of bearish candlesticks.
A look at the 10- and 20-period MAs shows that the former is providing support to the price.

Once it reached it, BTC immediately began an upward move.
The MA is currently at $9800.
Support Areas
One support and one resistance area are outlined below. The support coincides with the 10-week MA from the previous section.
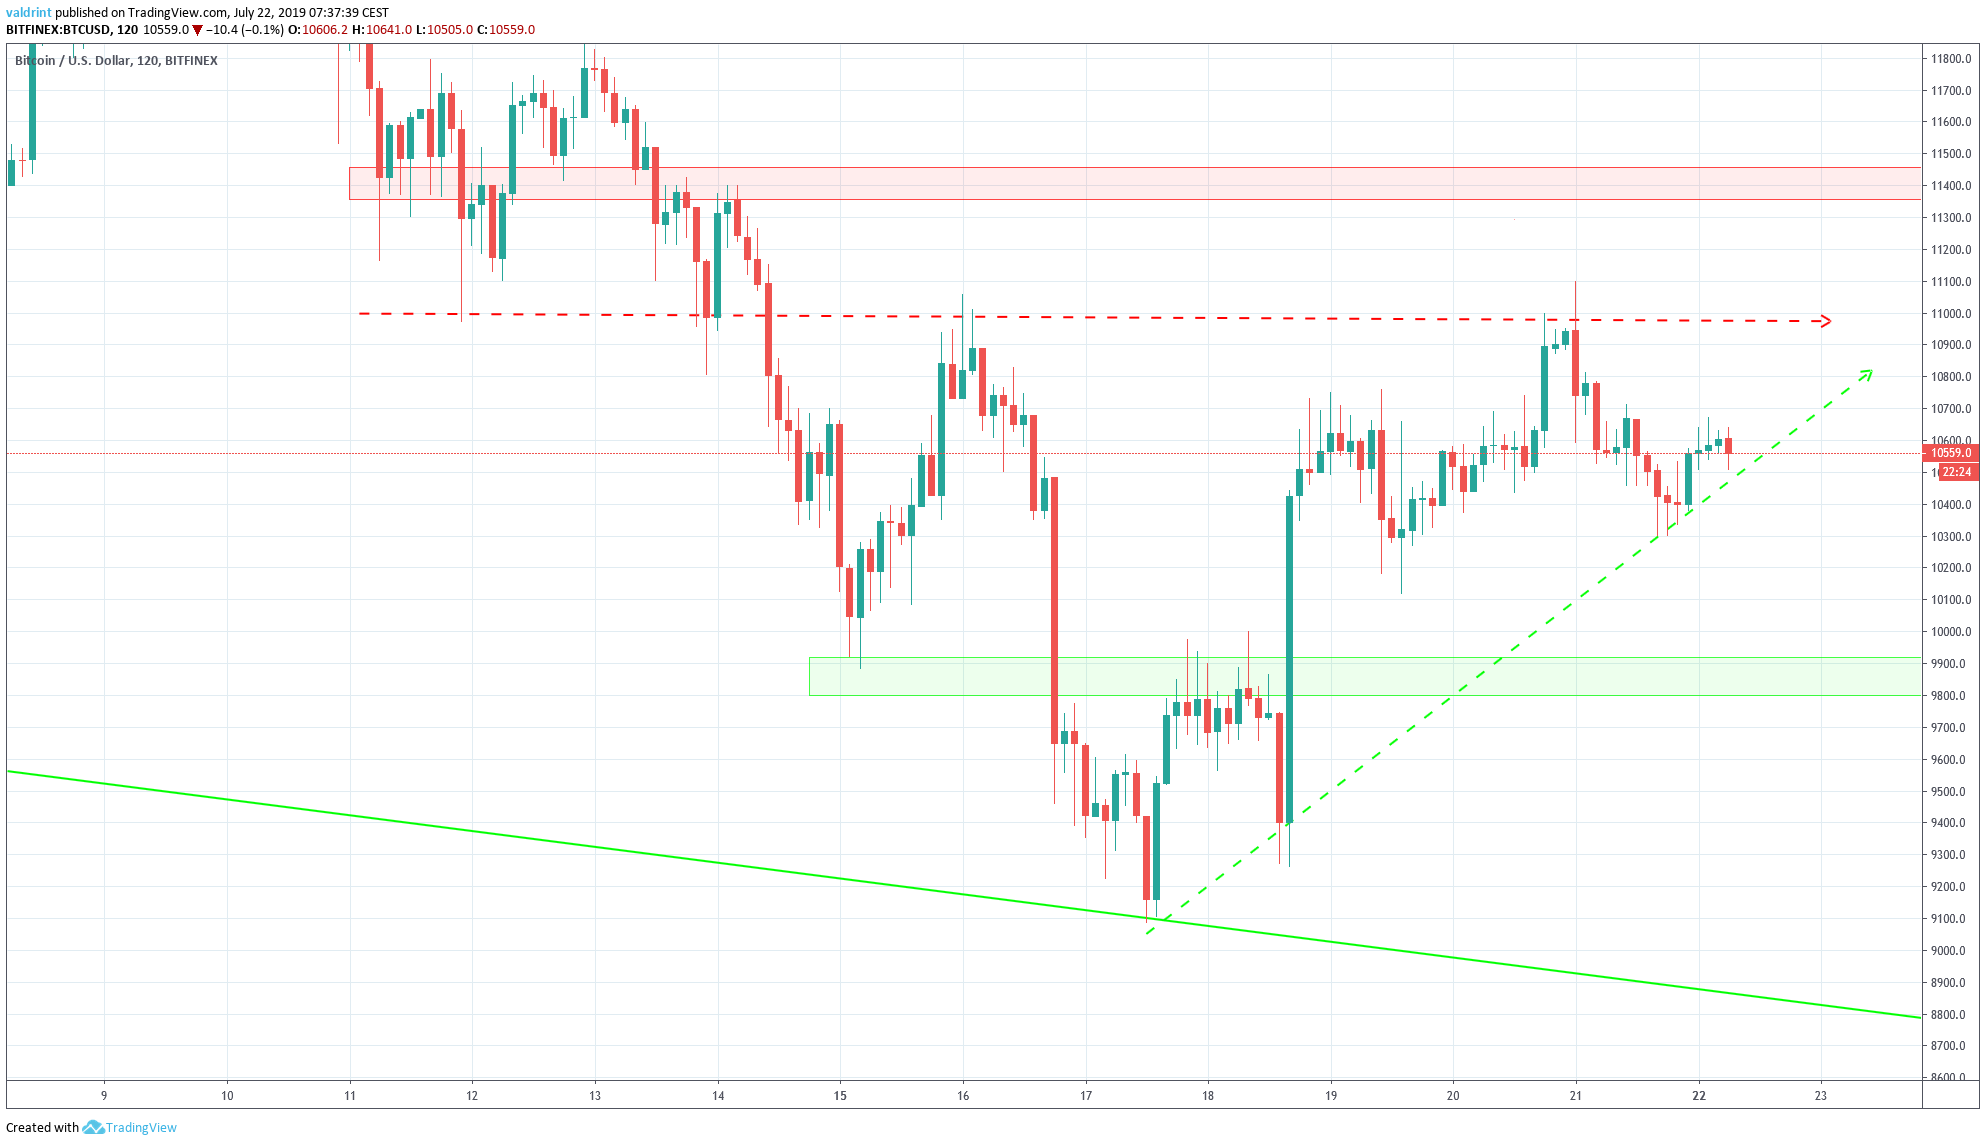
The closest support area is found near $9800.
If the BTC price breaks down from the triangle, it is likely to reach it.
According to our analysis, this is likely to occur. However, it is possible that it initially increases and touches the resistance line.
To the contrary, if a breakout occurs, the closest resistance area is found near $11,400.
Summary
The BTC price is trading inside a short-term ascending triangle and a longer-term descending channel.
According to our analysis, it is likely to break down from the triangle and reach the support area outlined above.
Do you think the BTC price will break down from the triangle? Let us know in the comments below.


