
On July 18, 2019, the Bitcoin price began an upward move which took it from $9300 to $10500 in a span of a few hours. Since then, it has been trading between $10,300 and $10,900.
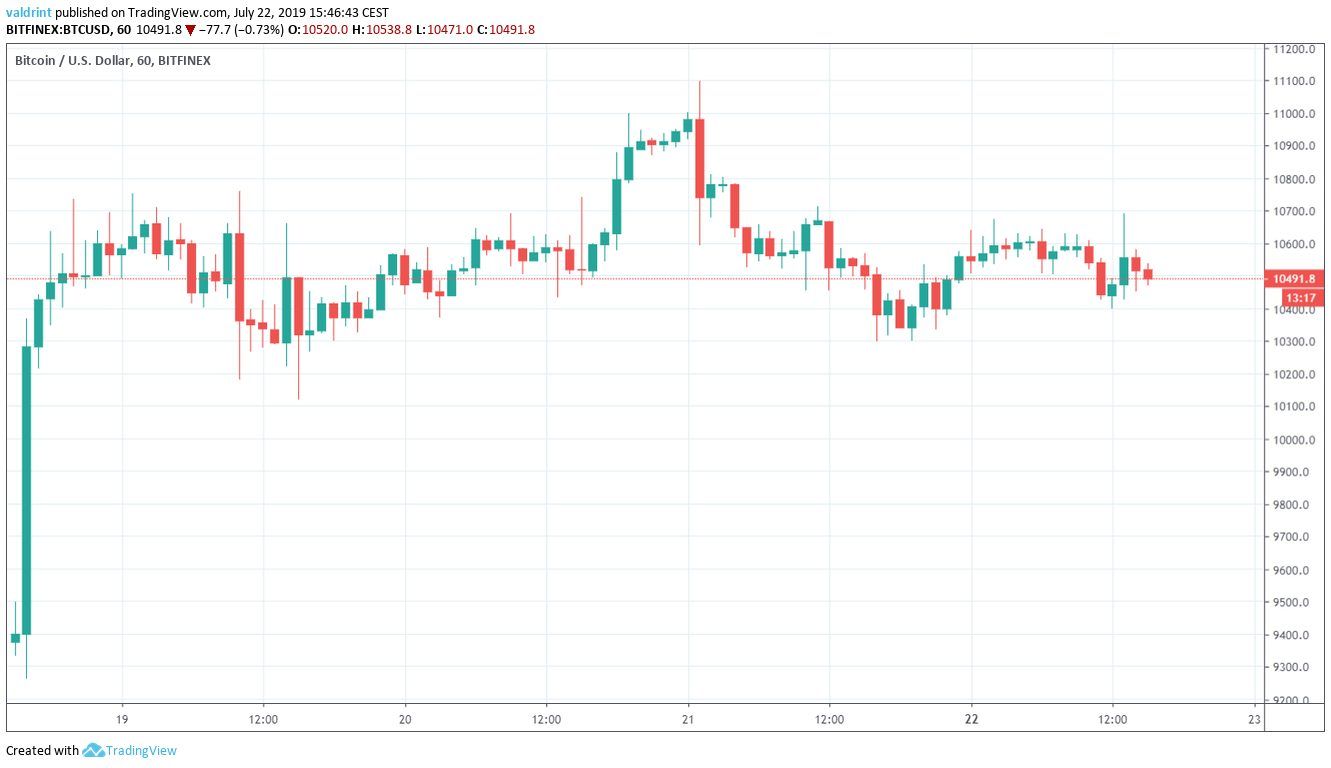
How long will the BTC price continue trading in this range? Keep reading below in order to find out.
Note: This is an update of recent Bitcoin (BTC) price movements. For the daily update please click here.
If you are interested in trading Bitcoin (BTC) with a multiplier of up to 100x on our new partner exchange with the lowest fees, follow this link to get a free StormGain account!
Bitcoin Price: Trends and Highlights for July 22
- BTC/USD is creating a head and shoulders pattern.
- Short-term moving averages have made a bearish cross.
BTC Price: Head And Shoulders
Since initiating the aforementioned upward move, the Bitcoin price has possibly created a head and shoulders pattern.
The head and shoulders is a bearish pattern, making price breakdowns more likely.
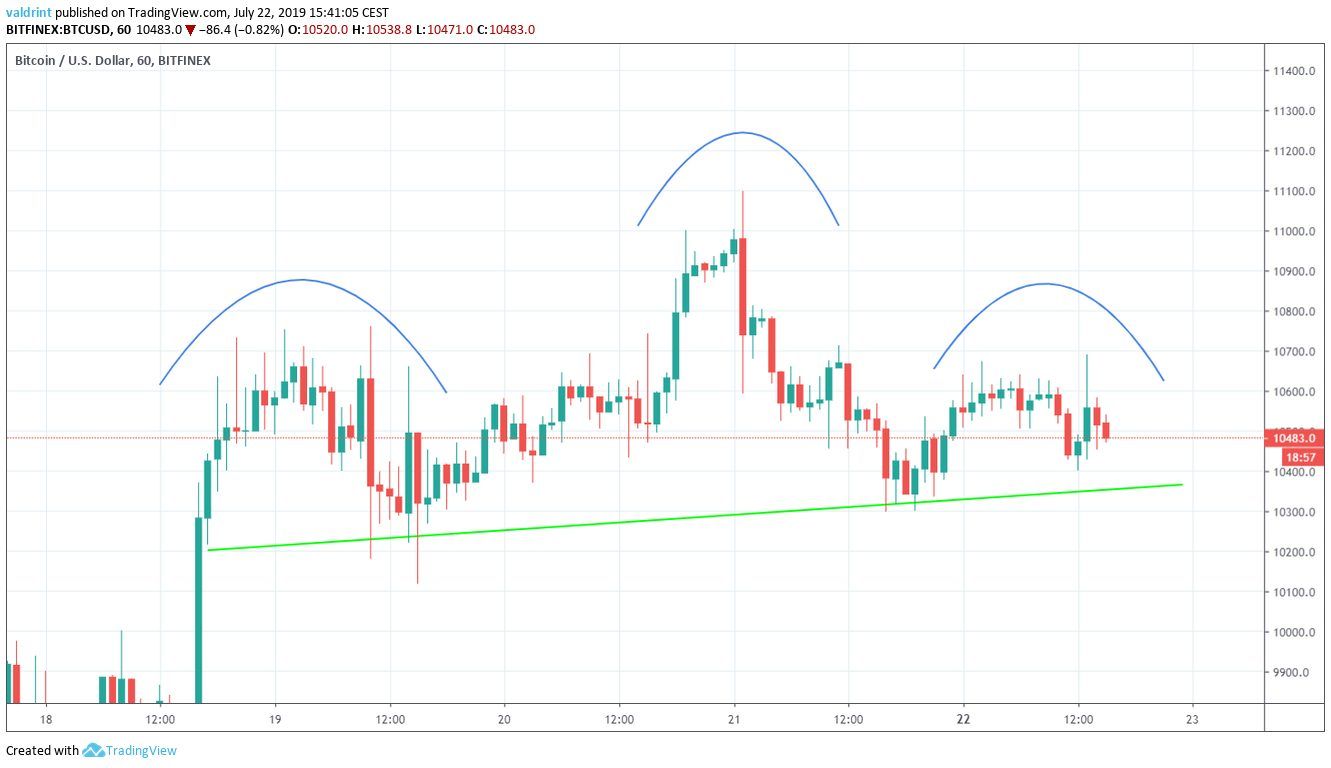
The pattern consists of two similar highs, with one higher high in between.
In the case of BTC, they are:
- The left shoulder (July 19)
- The head (July 21)
- The right shoulder (July 22)
If the price completes the pattern, it is likely to break down from the support line soon.
A look at moving averages also supports this movement.
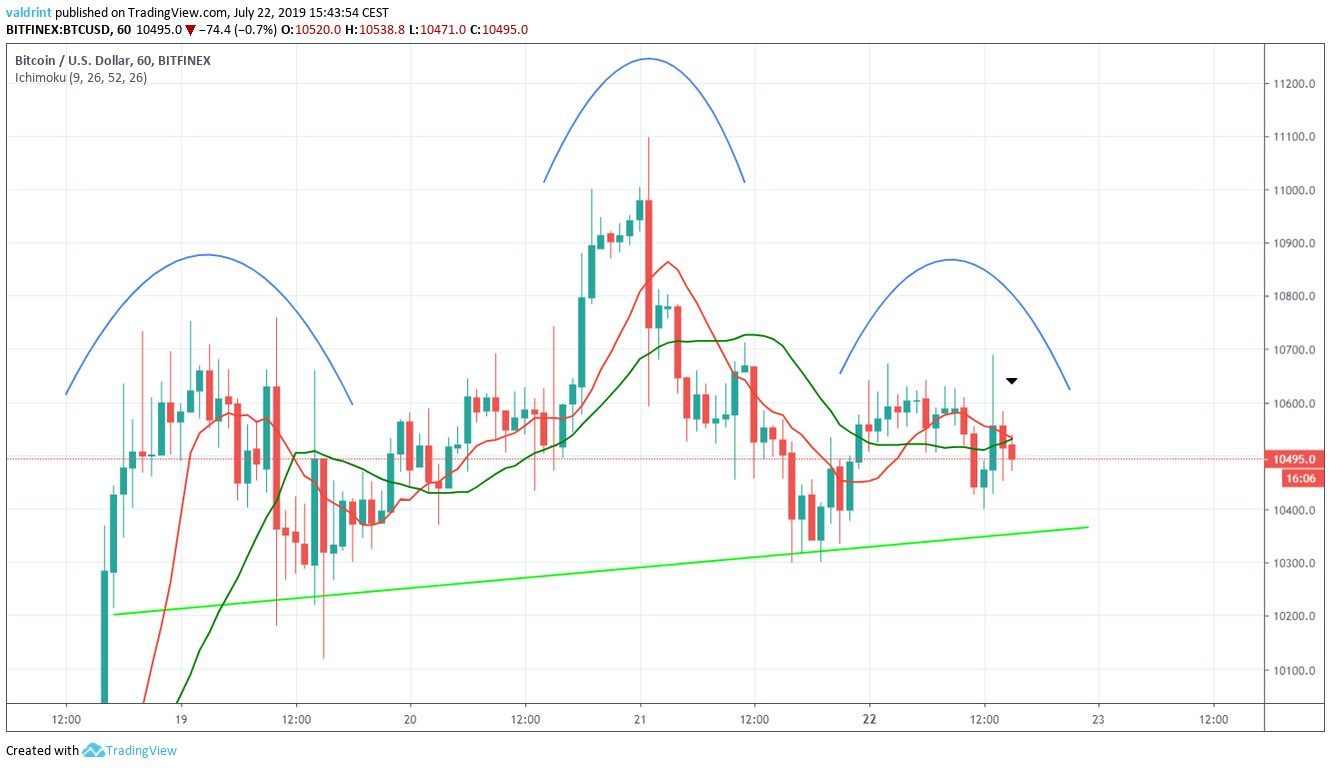
The 10- and 20-hour MAs have just made a bearish cross and are providing resistance to the price.
Therefore, we believe it is likely that BTC will break down from this support line.
Summary
The BTC price just made a head and shoulders pattern.
According to our analysis, it is likely to complete it and break down.
Do you think BTC will complete the head and shoulders pattern? Let us know in the comments below.
Disclaimer: This article is not trading advice and should not be construed as such. Always consult a trained financial professional before investing in cryptocurrencies, as the market is particularly volatile.
Images are courtesy of Shutterstock, TradingView.
