


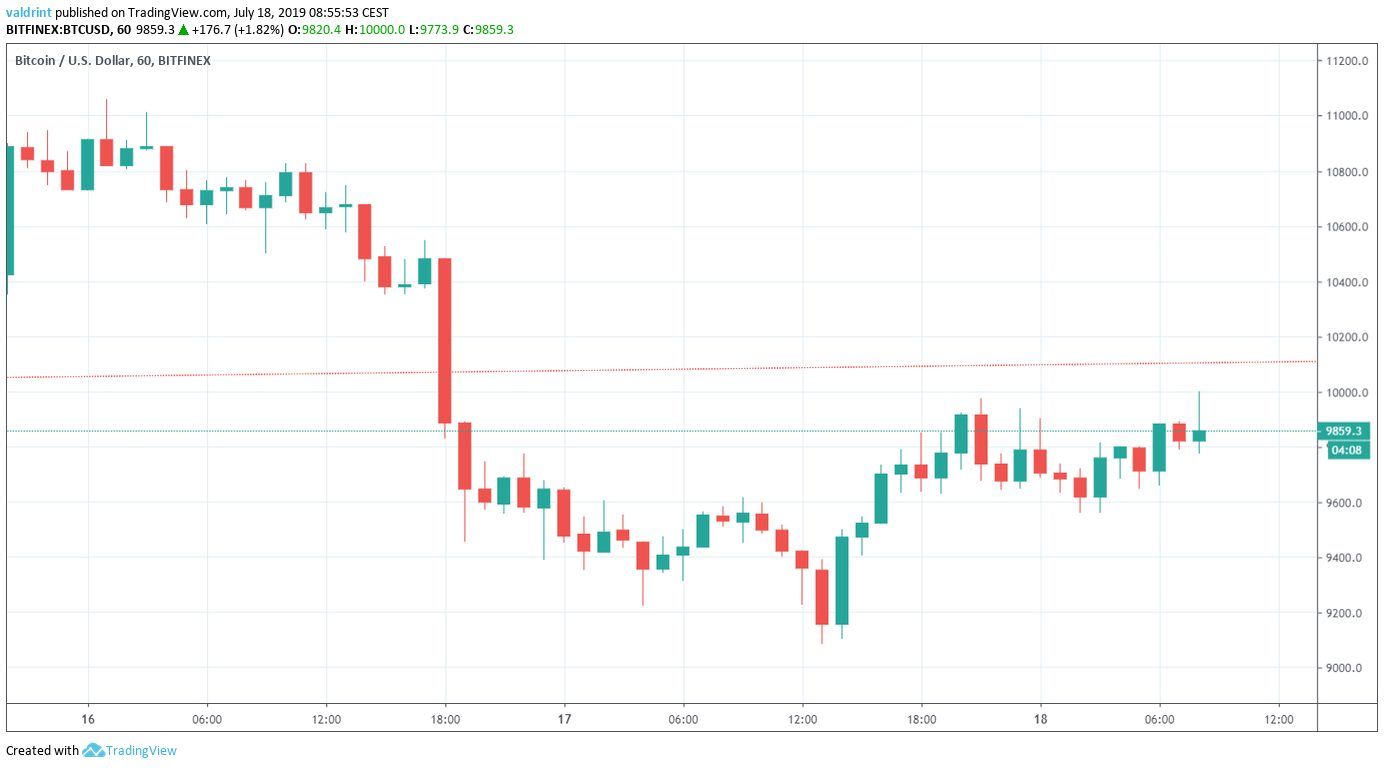
On July 16, 2019, the Bitcoin price reached a high of $11,058. Shortly after, a decrease in price ensued. The next day, the BTC price reached lows of $9084. It has been increasing since.
How long will this increase continue? Keep reading below in order to find out.
For our previous analysis, click here.
If you are interested in trading Bitcoin (BTC) with a multiplier of up to 100x on our new partner exchange with the lowest fees, follow this link to get a free StormGain account!
For a video analysis please click below
https://www.youtube.com/watch?v=yiclIxQnXGc&feature=youtu.be
Bitcoin Price: Trends and Highlights for July 18
- BTC/USD recently broke down from a significant support line.
- The price is following a descending support line.
- There is a small bullish divergence developing in the short-term RSI.
- BTC is trading inside a short-term ascending triangle.
- There is resistance between $10,200 and $10,300.
Previous Bitcoin Price Movement
Beginning on May 27, the BTC price has been following an ascending resistance line.
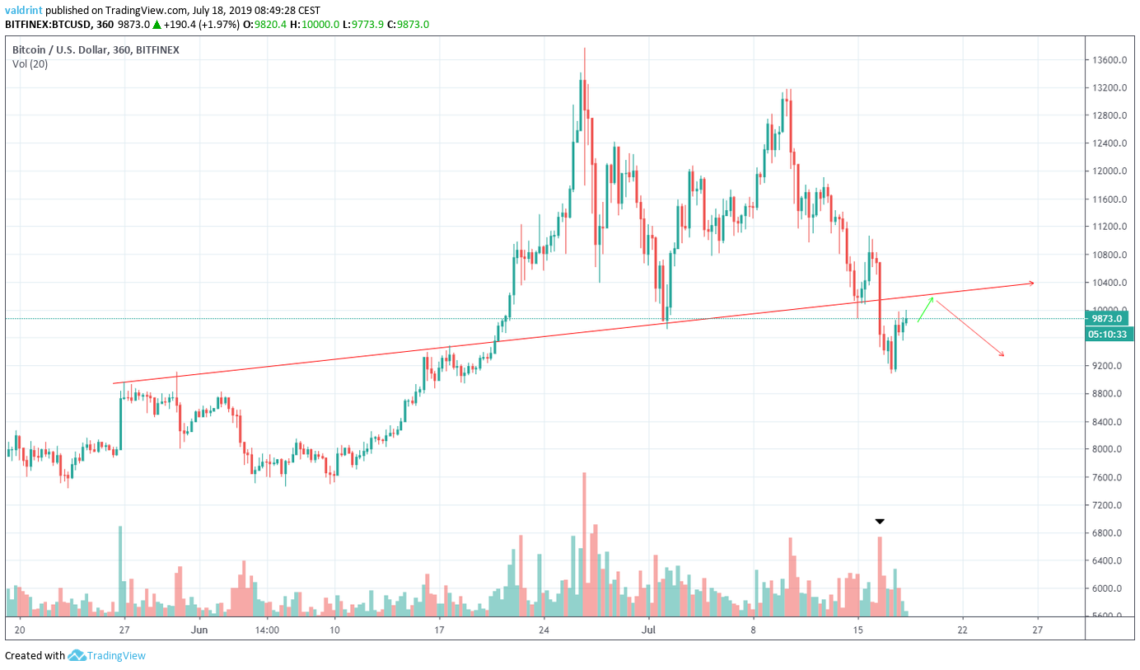
After breaking out on June 20, the BTC price dropped to validate it as support on July 2.
Again, it broke down from the resistance turned support line on July 15. The breakdown transpired with significant volume.
It would be normal if the price again increased in order to touch the line before resuming its downward movement.
Descending Support for the BTC Price
A look at a shorter time-frame shows that, since July 11, BTC has been following a descending support line.
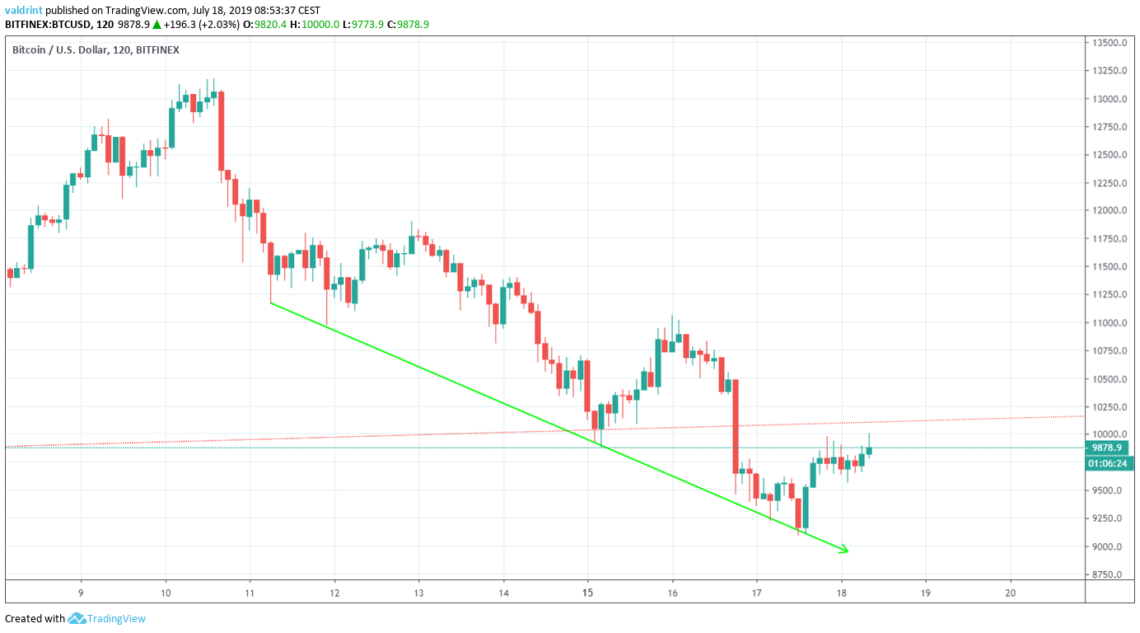
The line has been touched several times, increasing its significance. After each time, BTC has initiated upward moves of varying magnitudes.
We can also see that the previously mentioned resistance line is currently near $10,200.
Furthermore, the RSI has begun to generate bullish divergence over the past three days.

However, the divergence is not very significant.
Additionally, it is only occurring in short-term time-frames in the RSI.
Since a Bitcoin price increase has already transpired as a result of the divergence and there is significant resistance above, it is possible that the current move will end soon.
Long-Term View
A look into the daily candlesticks puts into perspective the magnitude of the recent increase compared to the decrease on July 16.
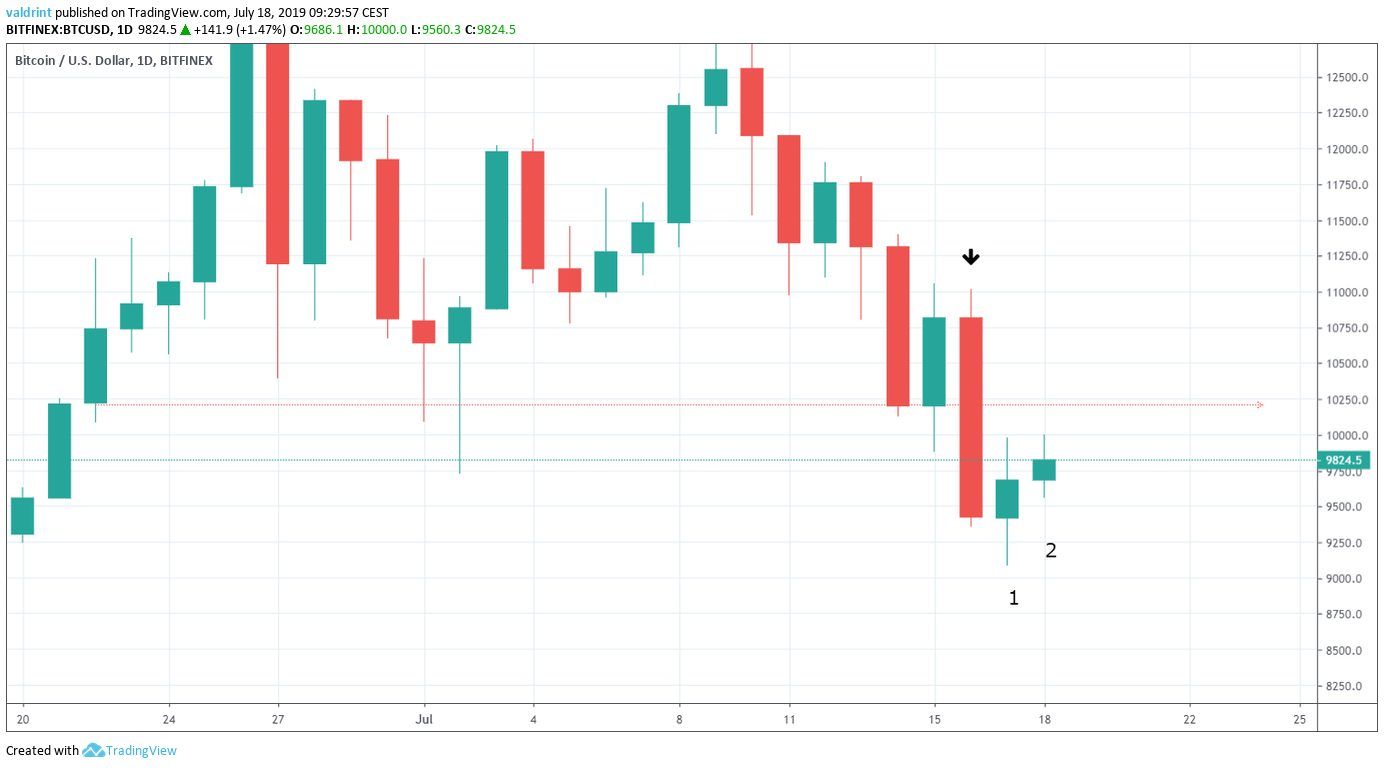
While we have created two bullish candles in a row, they pale in comparison to the massive bearish candle on July 26.
So, as things stand, it is likely that this is only an increase in response to the prior massive decrease.
Possible Final Increase
A closer look at the 30-minute time-frame shows that the price is trading inside an ascending triangle.
The ascending triangle is considered a bullish pattern, making a price breakout more likely.
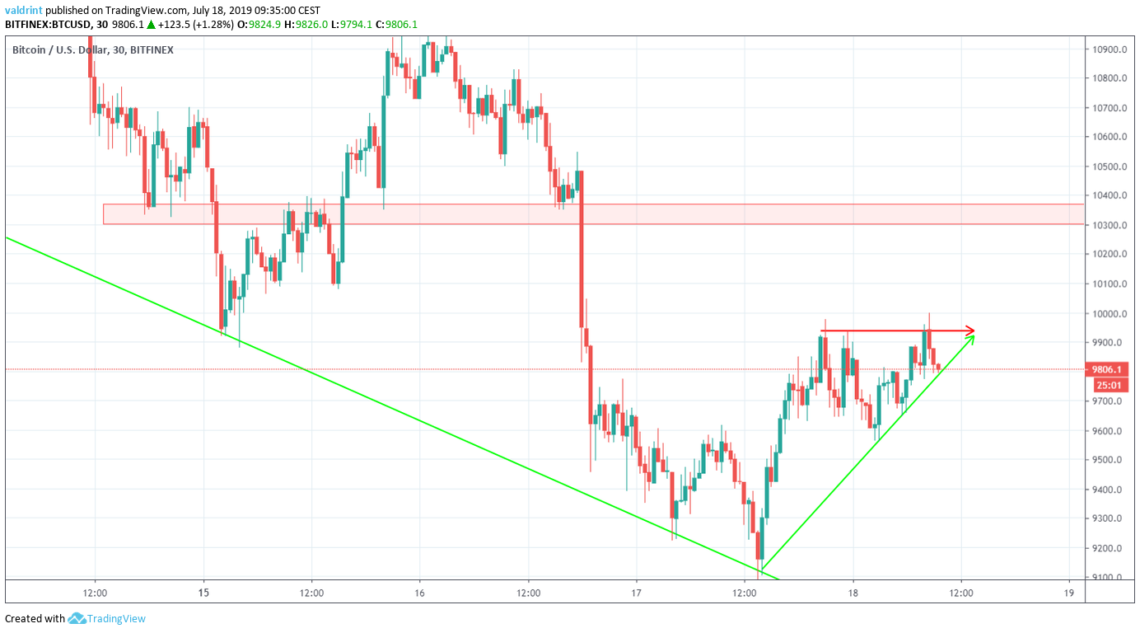
The BTC price has made three unsuccessful attempts at breaking out.
At the time of writing, both a breakout and a breakdown seem equally likely.
In both scenarios, we would expect the price to continue to decrease afterward until it reaches values in the lower 8000s, as we have discussed in more detail in our previous analysis.
If the Bitcoin price breaks out, we believe the upper limit of its increase should be at $10,300.
Summary
The Bitcoin price is trading inside a short-term ascending triangle.
Technical indicators are undecided on whether a breakout or a breakdown will occur.
In both cases, we would expect the price to decrease afterward until it has reached values between $8000 and $8500.
Do you think the BTC price will break out from the triangle? Let us know in the comments below!
Disclaimer: This article is not trading advice and should not be construed as such. Always consult a trained financial professional before investing in cryptocurrencies, as the market is particularly volatile.
Images are courtesy of Shutterstock, TradingView.


