
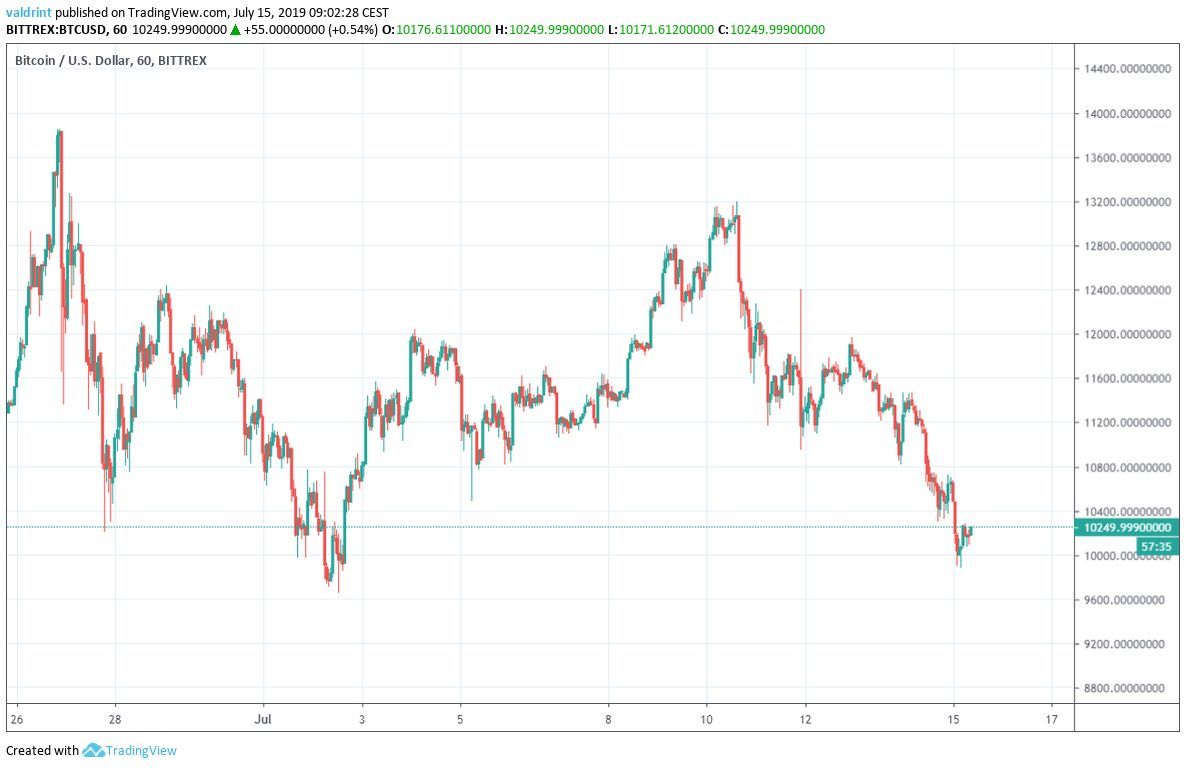
On June 26, 2019, the Bitcoin price reached a high of $13,764. A decrease ensued. On July 2, the BTC price reached a low of $9728. After a failed upward move, it created a lower high on July 10 — before continuing its downward move.
How long will BTC continue to decrease? Keep reading below in order to find out.
For our previous analysis, click here.
Bitcoin Price: Trends and Highlights for July 15
- BTC/USD is trading inside a descending wedge.
- It is following a longer-term ascending support line.
- There is support around $9000.
- Short- and long-term moving averages have made bearish crosses.
- Weekly candlesticks give a bearish outlook.
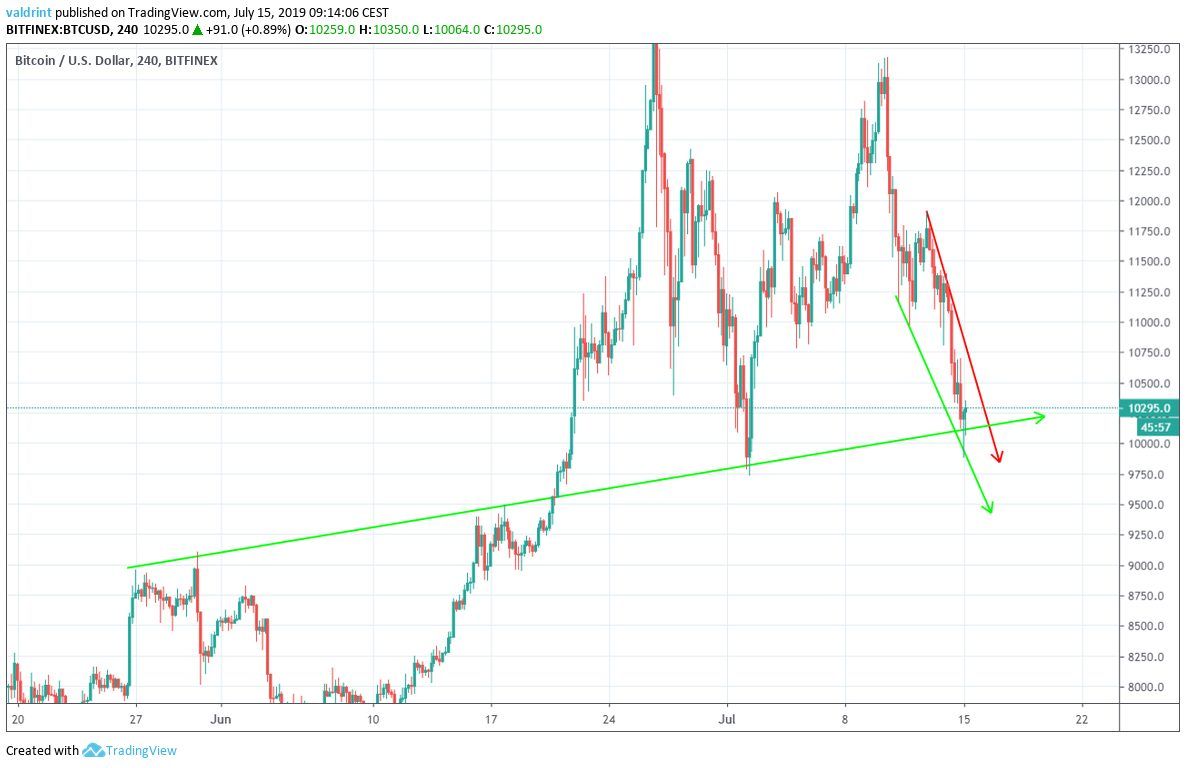
Wedge Support for BTC Price
Since July 11, the Bitcoin price has been trading inside the descending wedge outlined below.
The wedge is a bullish pattern, making price breakouts more likely.
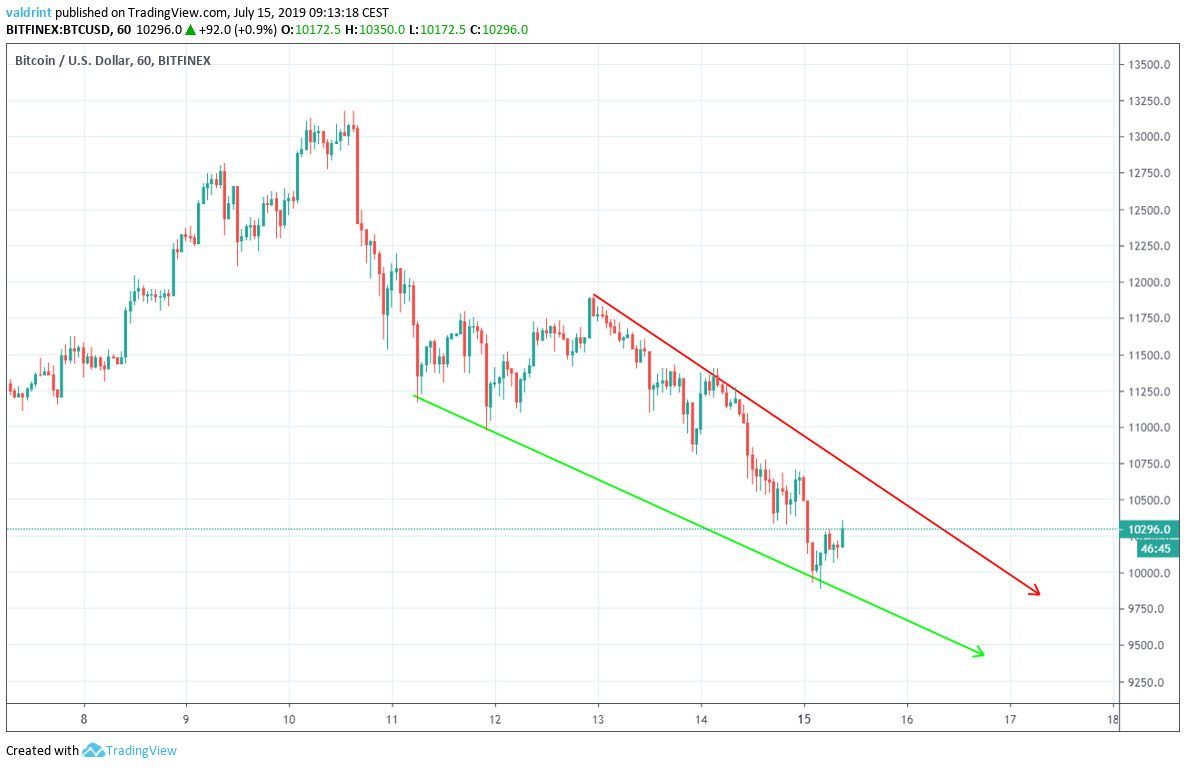
At the time of writing, the BTC price was moving towards the resistance line of the wedge — after touching the support line for the third time.
Interestingly, this support line coincides with a slightly longer-term ascending support line.
The line previously served as resistance, before turning to support on the $9728 low reached on July 2.
As seen in the image above, once the price reached it, it created a bullish hammer — which is interpreted as a reversal sign.
However, it has yet to begin an upward move.
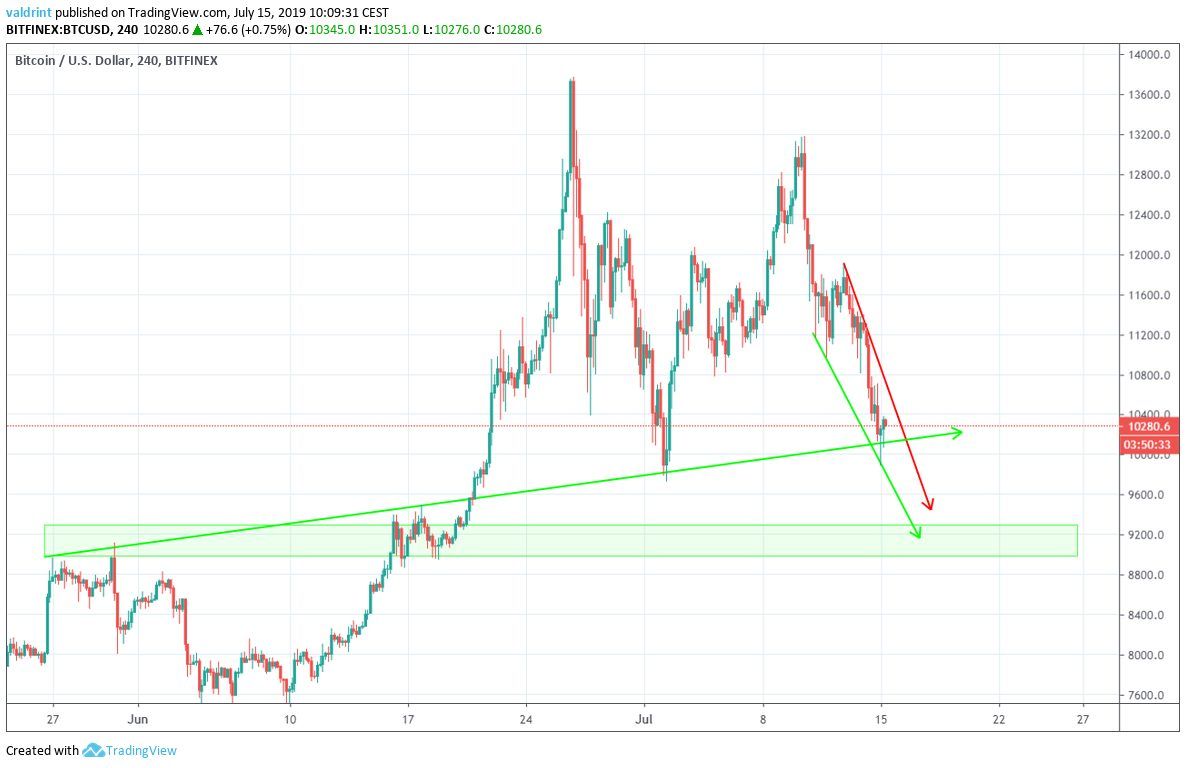
If the price does not do so an dresumes its decrease, the closest support area is found near $9000.
Will the Bitcoin price respect the support line and begin an upward move, or will it decrease at the rate predicted by the wedge and reach the support area?
Moving Averages
A look at the short-term moving averages (MA) gives a bearish outlook.
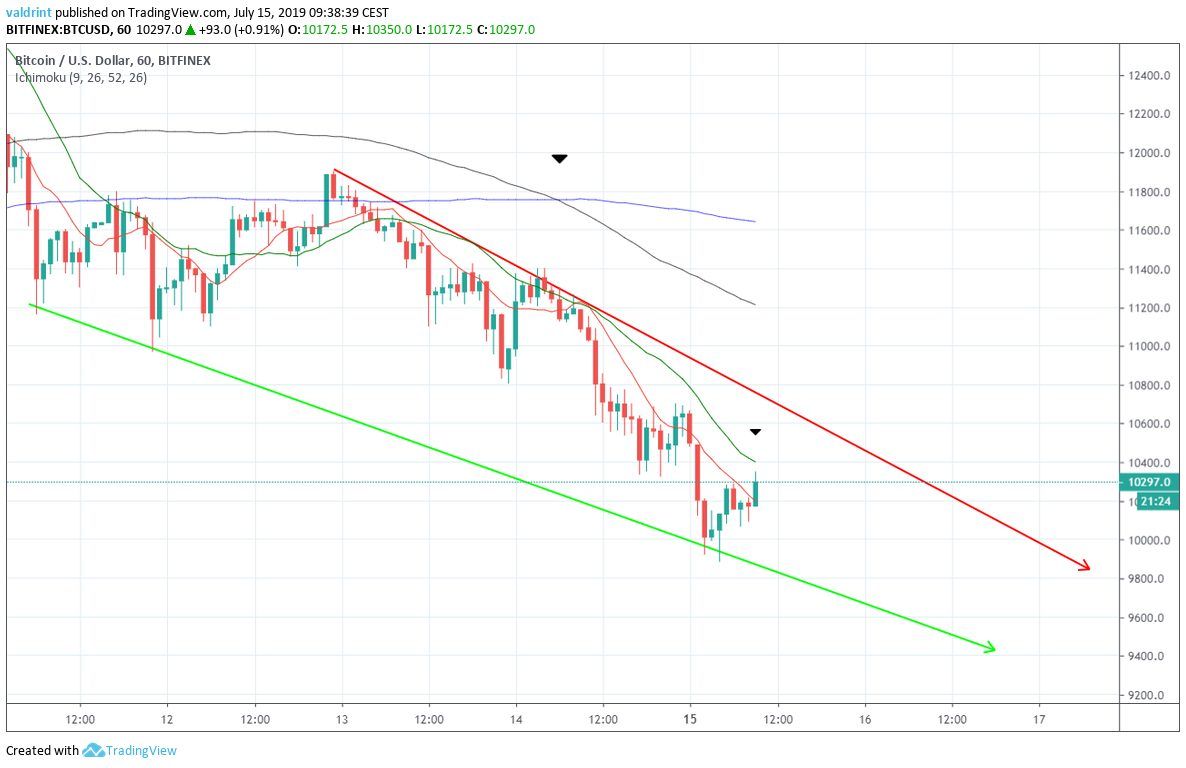
A bearish cross between both the long- and the short-term MAs transpired on July 14.
At the time of writing, the BTC price had moved above the 10-hour MA but found resistance at the 20-hour one.
While there is some bullish divergence developing in momentum indicators, it is not very significant and only occurring in time-frames of one-hour or less.
A look at the daily time-frame gives us one bullish and one bearish characteristic.
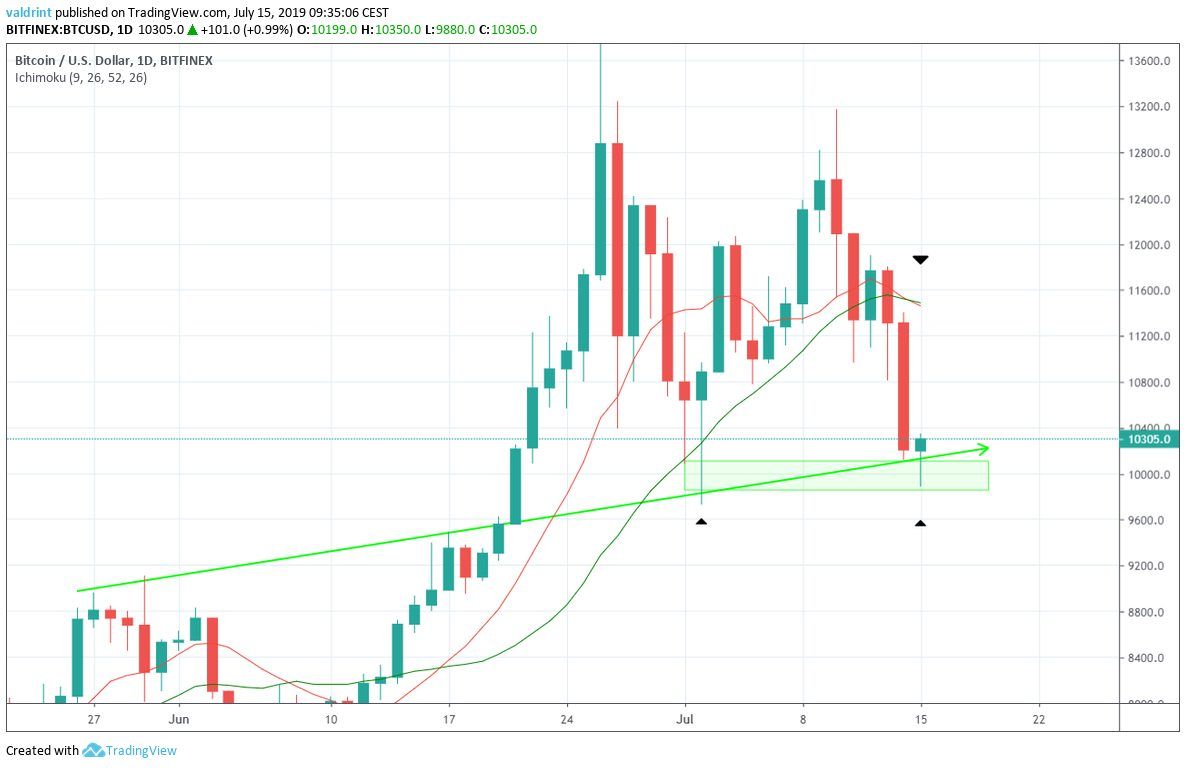
First, similarly to the short-term time-frames, the 10- and 20-day MAs have just made a bearish cross.
If the BTC price begins to increase, it is likely that they will provide resistance.
On a more bullish note, there is a significant support area near $10,000.
As soon as the price reached this area, both today and on July 2, it immediately began an upward move — creating long lower wicks in the process.
Weekly Outlook
A look at the weekly chart shows that the Bitcoin price has begun to show significant weakness.
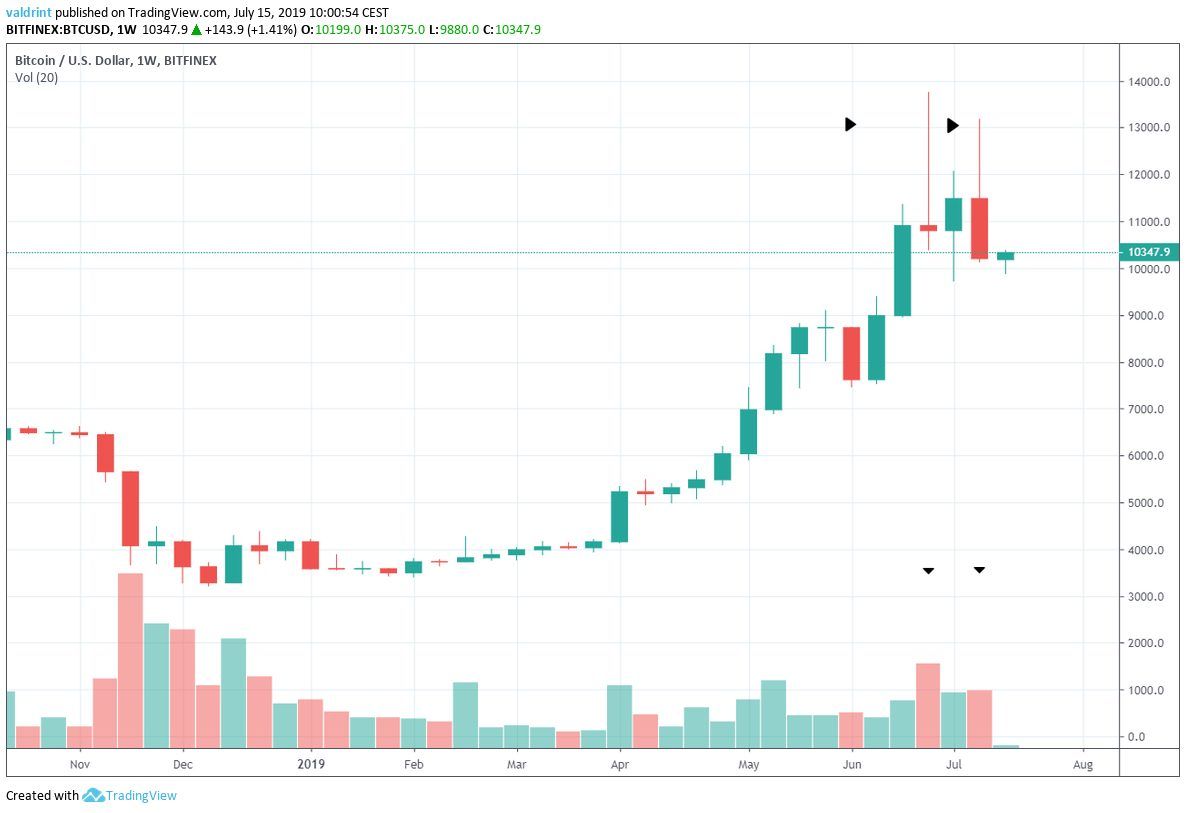
The candlestick for the week of June 23-30 was a bearish doji.
It was followed by a bullish candle.
However, last week’s candle was a bearish inverted hammer.
Additionally, the bearish candles transpired with more volume than the bullish one in between.
Finally, both had very long upper wicks in values above $11,000.
This is a sign that there is significant selling pressure around that area.
The size and position of these candles relative to the prior upward move make us believe that this is likely to be the beginning of a longer correction.
The movement of the MAs and the lack of bullish divergence further supports this claim.
Summary
BTC/USD is trading inside a descending wedge.
An analysis of moving averages makes it likely that the Bitcoin price will continue to decrease at the rate predicted by the wedge.
The closest support area is found near $9000.
Do you think the BTC price will reach the support area outlined above? Let us know in the comments below.
Disclaimer: This article is not trading advice and should not be construed as such. Always consult a trained financial professional before investing in cryptocurrencies, as the market is particularly volatile.
Images are courtesy of Shutterstock, TradingView.
