


Since the beginning of April, when it was trading at $4000, the Bitcoin price has been increasing. On June 26, 2019, it reached highs of $13,764, before a flash crash caused it to drop below $10,000. After another increase which briefly took it above $13,000, the BTC price began the current rapid decrease.
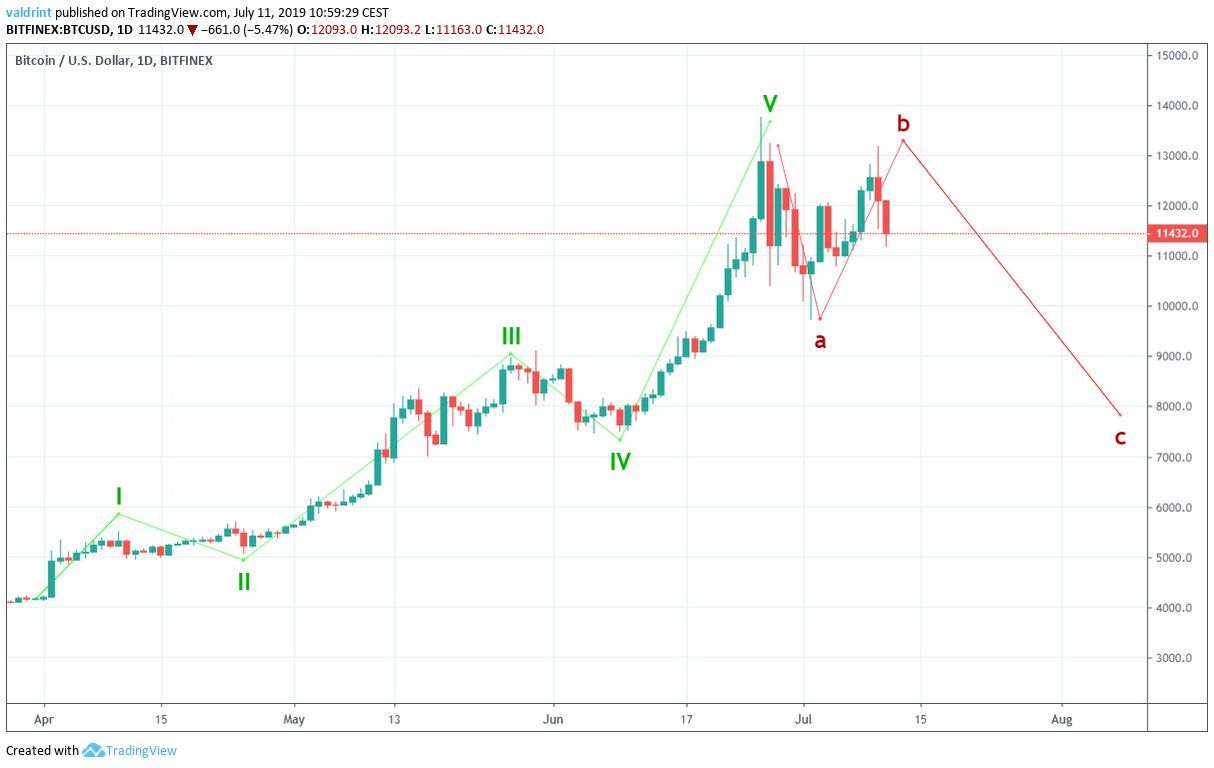
In this article, we are going to analyze the possibility that we just finished a five wave uptrend, and are now in the C wave, which is the final corrective wave before the uptrend continues.
According to Elliot wave theory, a five wave uptrend is followed by an A-B-C correction.
Note: This is an analysis of a possible future correction. For the regular daily analysis, please click here.
If you would like to trade Bitcoin (BTC) safely and securely on our partner exchange, follow this link to get all set up on XCOEX.
Bitcoin Price: Volume
On April 2, the aforementioned upward move transpired with very significant volume.
In the chart below, it is marked by “1.”

Afterward, during wave three, volume was lower than in the beginning. This is customary in Elliot wave formations.
Volume again picked up during wave five, culminating on June 26, the day in which the top was reached.
After the decrease, volume was significantly lower during wave B. Finally, the decrease which is potentially the beginning of wave C transpired with significant volume.
BTC Price: Technical Indicators

The three-day period is the longest time-frame in which the divergence is present. It is worth mentioning that this divergence is not present in the MACD.
The moving averages (MA), while very close to turning bearish, have not yet done so.
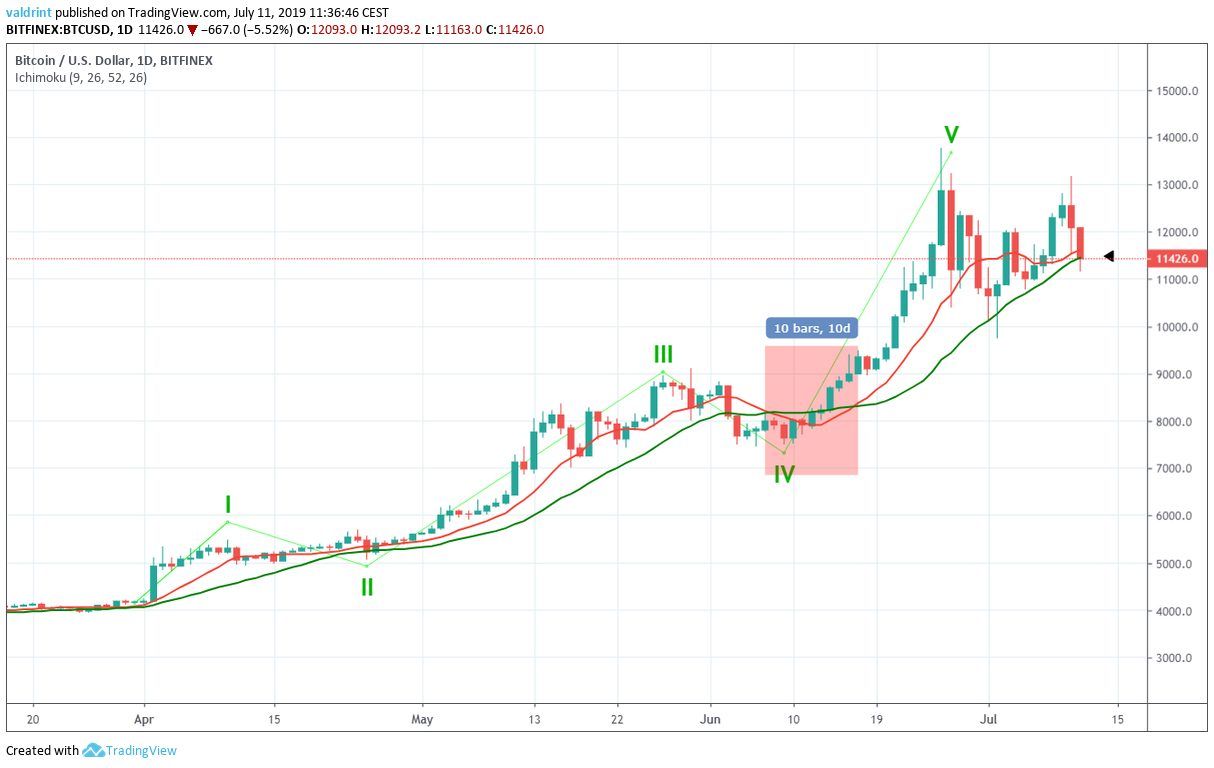
At the time of writing, the Bitcoin price is barely holding on to the support offered by the 10- and 20-day MAs.
However, even if a bearish cross occurs, we cannot rule out a situation similar to the one that transpired on June 7.
At the time, even though a bearish cross occurred, the BTC price began to increase shortly after.
However, it has shown more weakness this time around.
Support and Timetable
In order to predict the ending of the C wave, we are going to use a Fibonacci retracement tool from the beginning of the upward move on April 2.
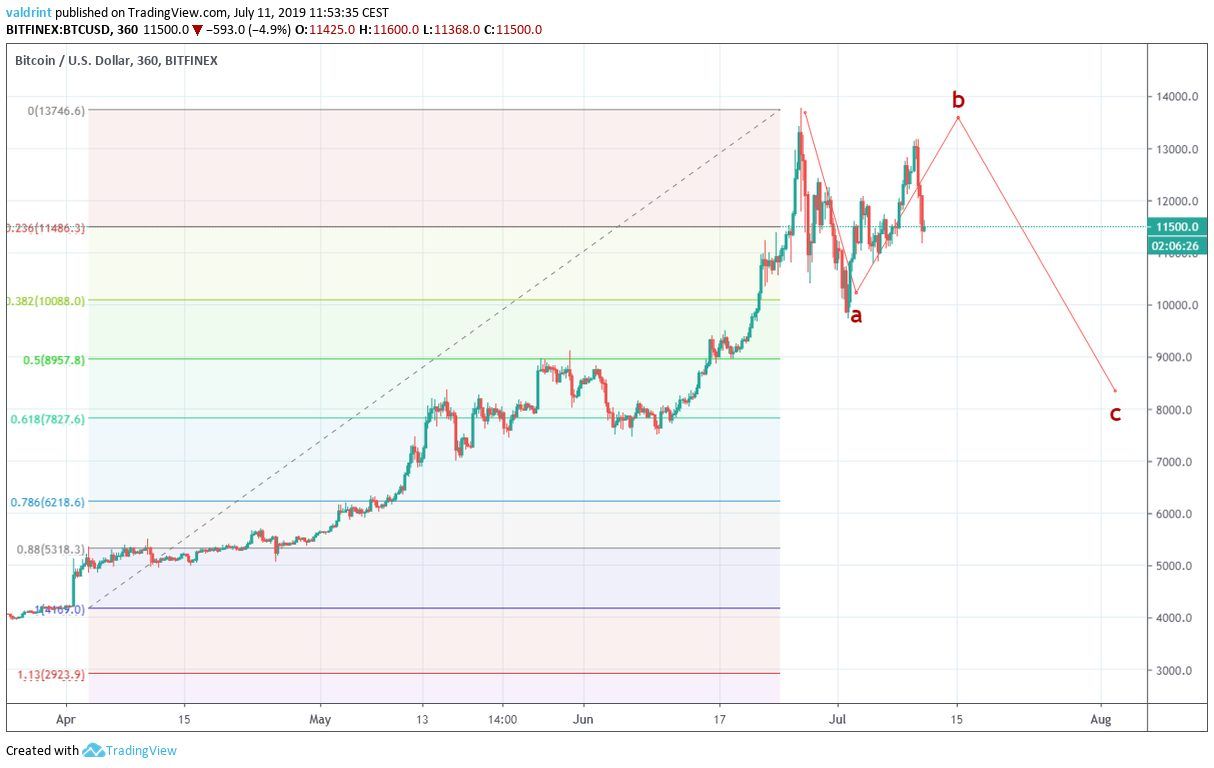
The A wave was completed at the 0.382 fib level near $10,000.
Therefore, we are going to assume that the C wave will be completed near $8000, at the 0.618 fib level.
Furthermore, there is significant support around this area due to the price movement at the end of May/ beginning of June.
The next level of support is found near $6000.
The upward move took 85 days to materialize.
Currently, we have been on a downtrend for only 15 days.

As is visible above, the Bitcoin price has completed both waves of the correction with three smaller sub waves (W-X-Y).
Due to the significant length of the upward move and relatively short correction length, we believe that the final wave will be slightly longer.
Therefore, it is likely that the correction will follow a 3-3-5 subwave count, rather than a 3-3-3.
We have outlined the full subwave count below.

Also, the first downward wave (A) took five and a half days to be completed.
The B-wave was slightly longer, taking eight days to materialize.
Finally, for the C wave, we are making the assumption that it will be even longer, around 10 days.
It should be characterized by rapid decreases and weak upward bounces.
Summary
The Bitcoin (BTC) price has been increasing since April
Momentum indicators show significant weakness in the Bitcoin price.
It is likely in the final wave of a correction, which should end around July 20 at $8200.
Where do you think BTC will make a bottom? Let us know in the comments below!
Disclaimer: This article is not trading advice and should not be construed as such. Always consult a trained financial professional before investing in cryptocurrencies, as the market is particularly volatile.
Images are courtesy of Shutterstock, TradingView.


