
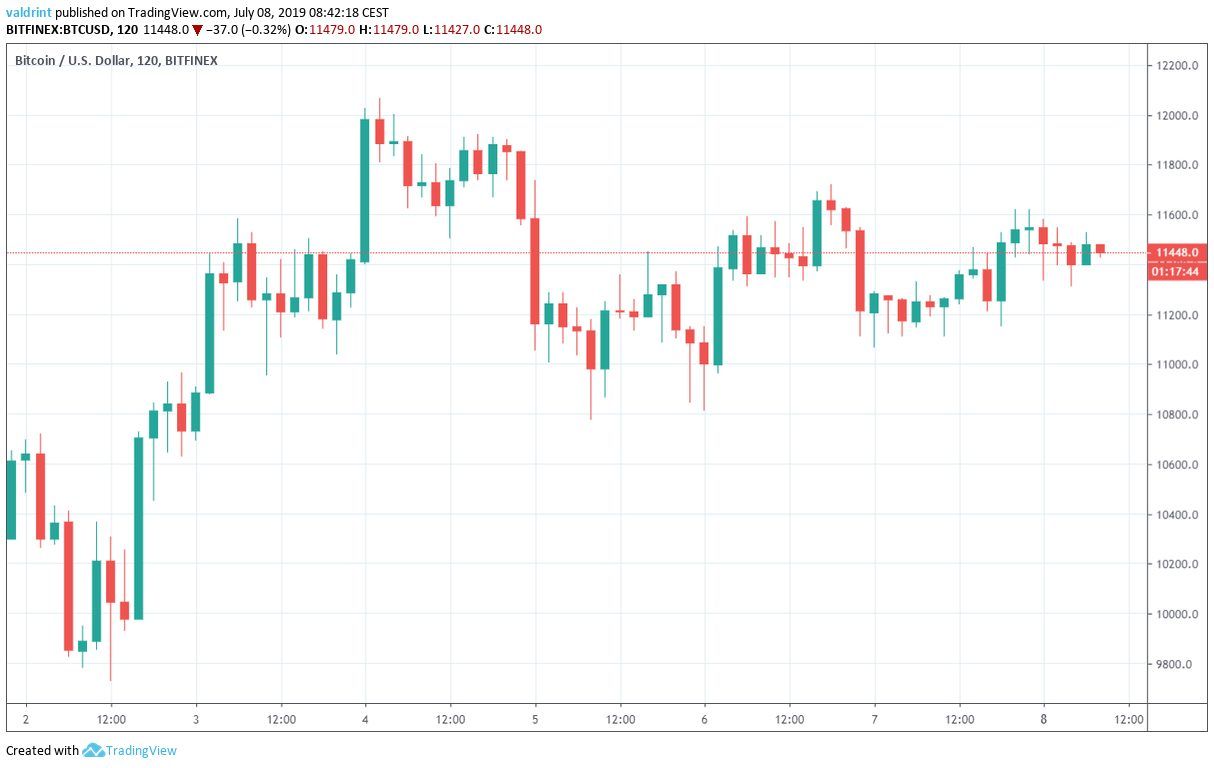
On July 2, 2019, the Bitcoin price made a low of $9728. An upward move ensued. Highs of $12,065 were reached on July 4. The BTC price has been decreasing since.
How long will this decrease continue? Keep reading below in order to find out.
For our previous analysis, click here.
If you want to trade Bitcoin (BTC) safely and securely on our partner exchange, follow this link to get set up on XCOEX.
Bitcoin Price: Trends and Highlights for July 8
- BTC/USD is following a descending resistance line in a daily time-frame.
- The daily moving averages (MA) and MACD are close to making a bearish cross.
- The Bitcoin price is trading inside a short-term symmetrical triangle.
- Short-term moving averages have made a bullish cross.
- There is resistance near $12,000.
BTC Price: Weekly Candlestick Analysis
Let’s begin with weekly candlestick analysis.
The candle for the week of June 23-30 was a bearish doji. It succeeded a bullish engulfing candle.
When found in an uptrend, it often indicates that a reversal is in store.
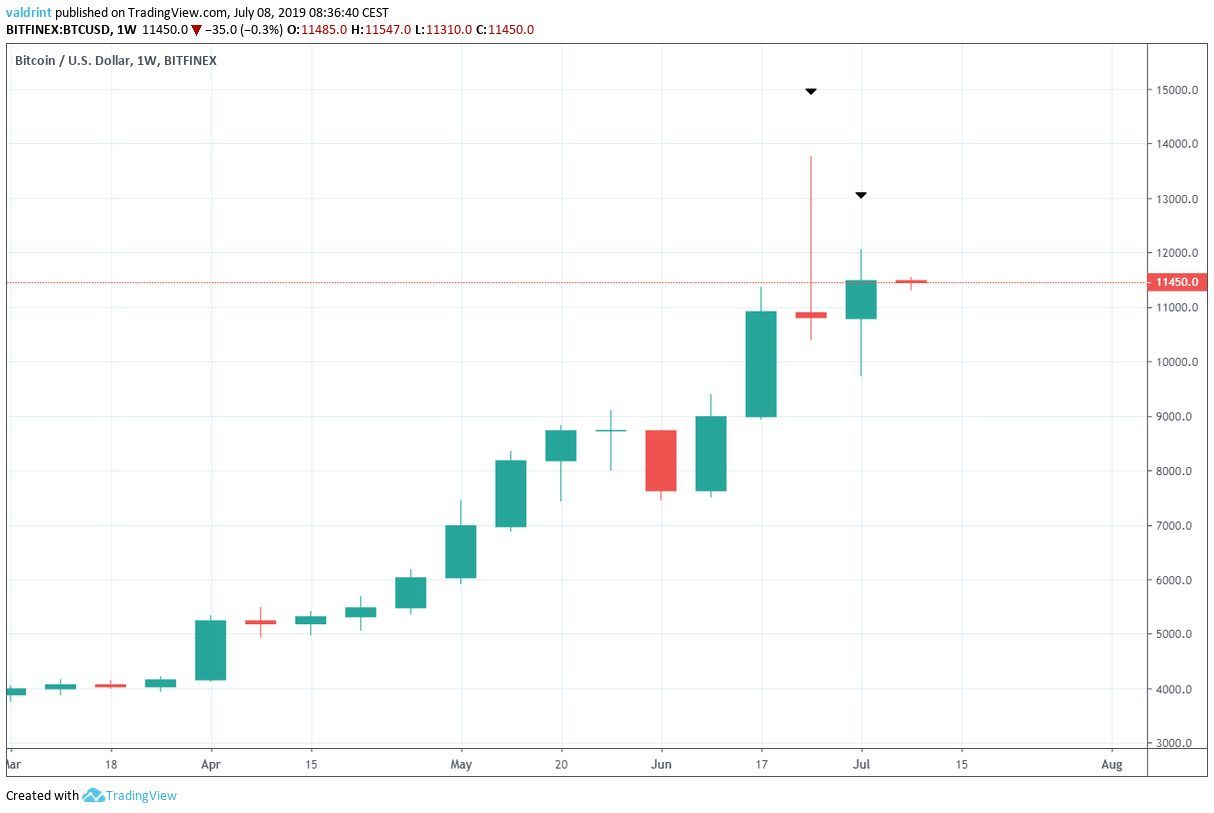
It set up a stage for a bearish engulfing candle, which would complete a bearish evening star.
However, the candle for the week of June 30 – July 7 was a small bullish candle with short upper and lower wicks.
While the BTC price did not complete an evening star, this bullish candle does not invalidate the possibility of a reversal.
The candle was comfortably contained within the upper wick of the bearish doji, indicating that there is still selling pressure in the market.
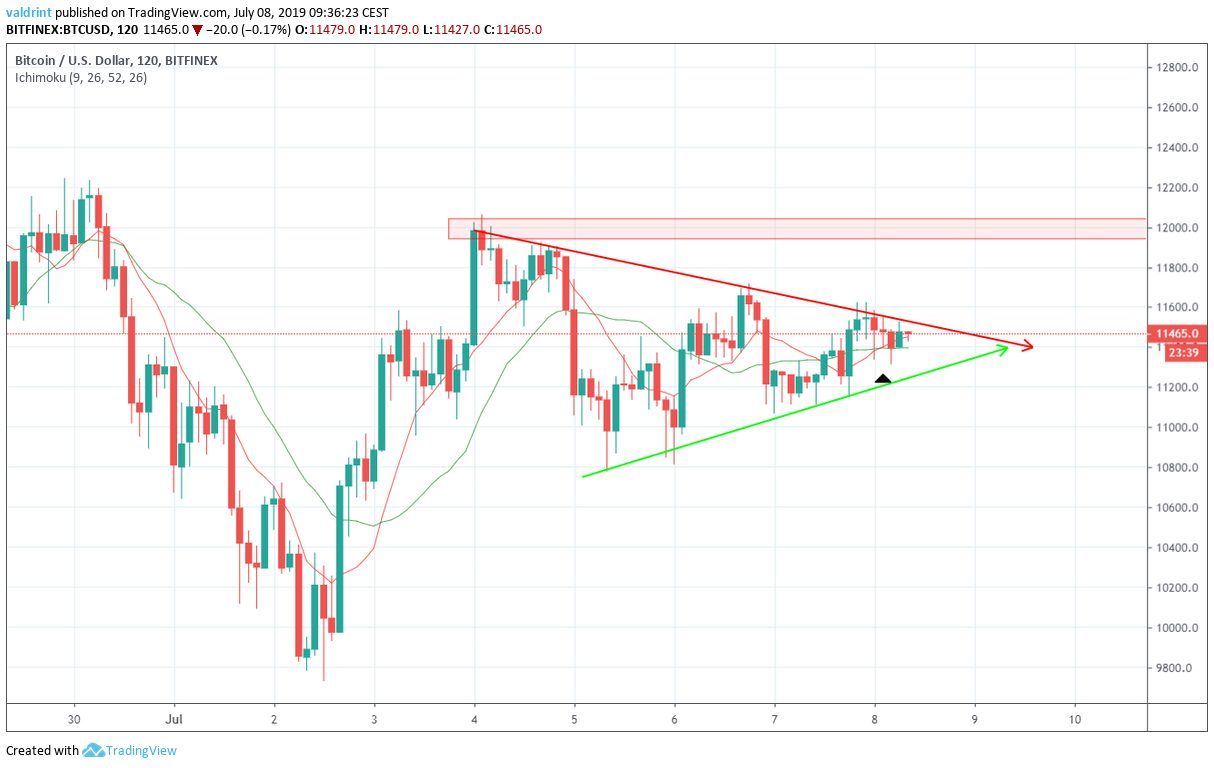
Descending Resistance
In a daily time-frame, we can see that since reaching a high on June 26, the Bitcoin price has been decreasing, following the descending resistance line outlined below:
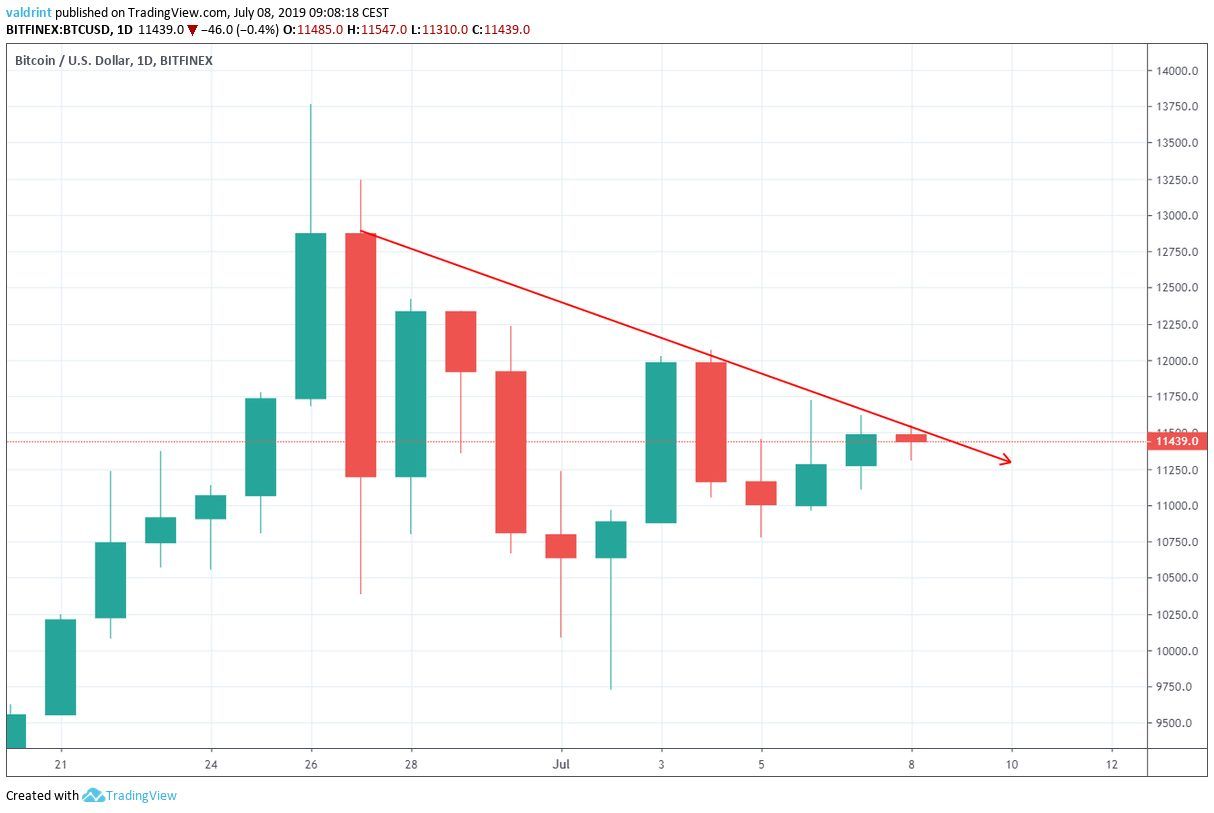
At the time of writing, the BTC price was trading very close to the resistance line, after unsuccessful breakout attempts over the past two days.
Furthermore, the price was trading above both the 10- and 20-day MAs.
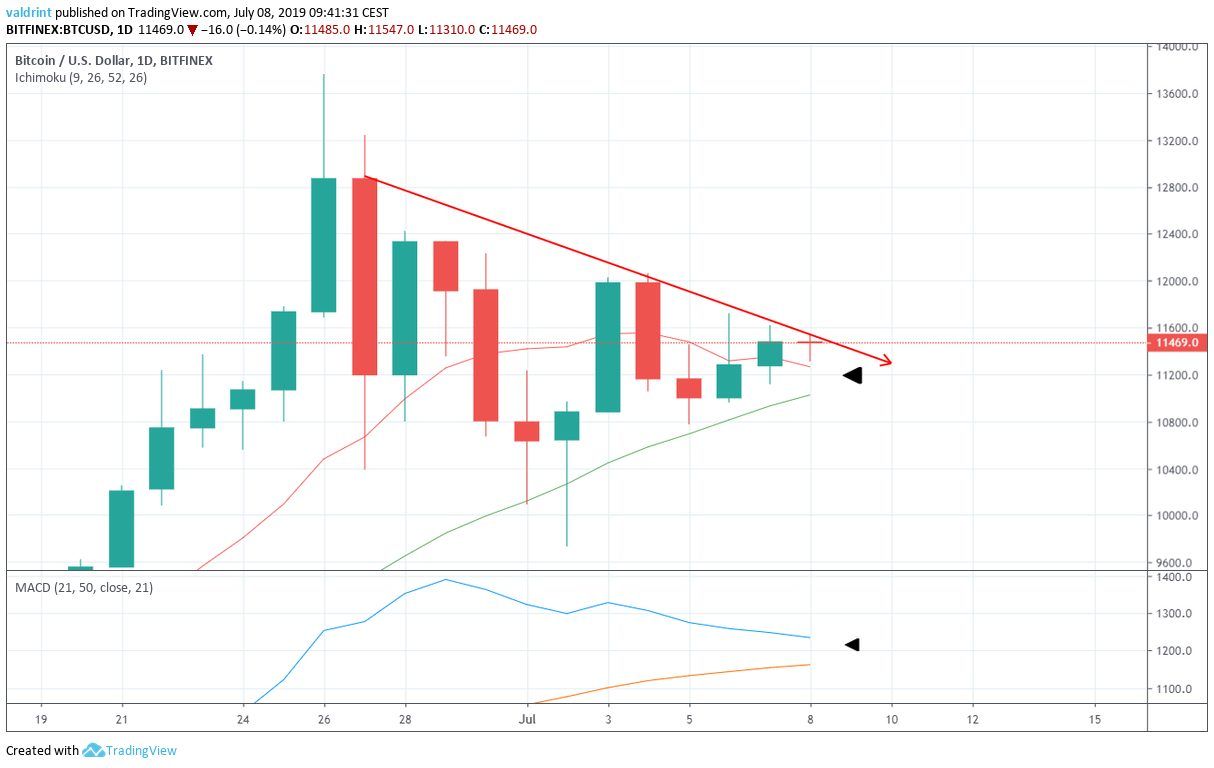
However, the MAs and the MACD are very close to making a bearish cross.
If that occurs, and the price decreases below both of them, it would act as confirmation that the downtrend is continuing.
It is worth noting that the Bitcoin price still has not closed below the 20-day MA.
Even though it reached lows below it on July 2, it immediately bounced and closed above it.
Symmetrical Triangle
In the short-term, we can see that the price is trading inside a symmetrical triangle since reaching a high on July 4.
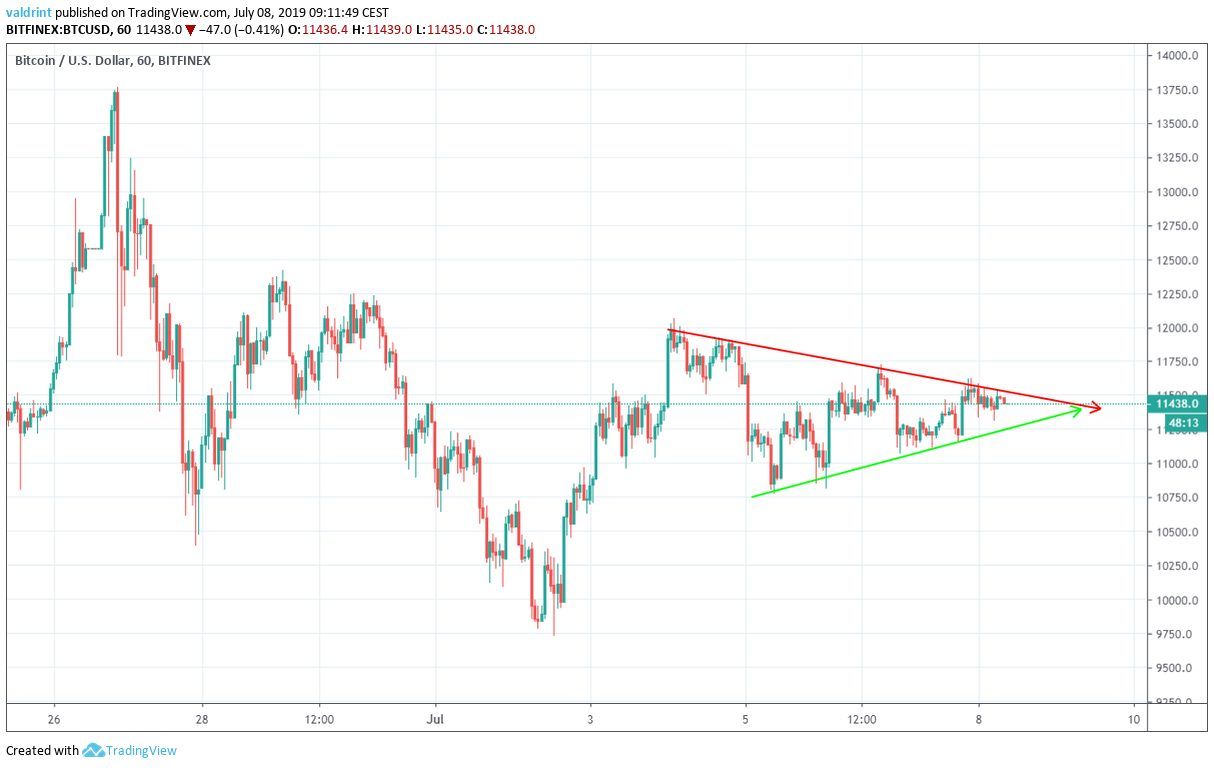
BTC/USD has made several unsuccessful attempts at breaking out and is rapidly approaching the end of the symmetrical triangle.
The symmetrical triangle is considered a neutral continuation pattern.
Since it is transpiring after an upward move (beginning on July 2) it is more likely that a breakout occurs.
This hypothesis is also supported by the moving averages:
On July 8, a bullish cross occurred between the 10- and 20- period MAs.
If the Bitcoin price breaks out, it will likely meet resistance near $12,000 and create a double top.
Comparison
There is a similarity between the current price movement (left side) and that after the price reached a high of $20,000 on December 2017 (right side)
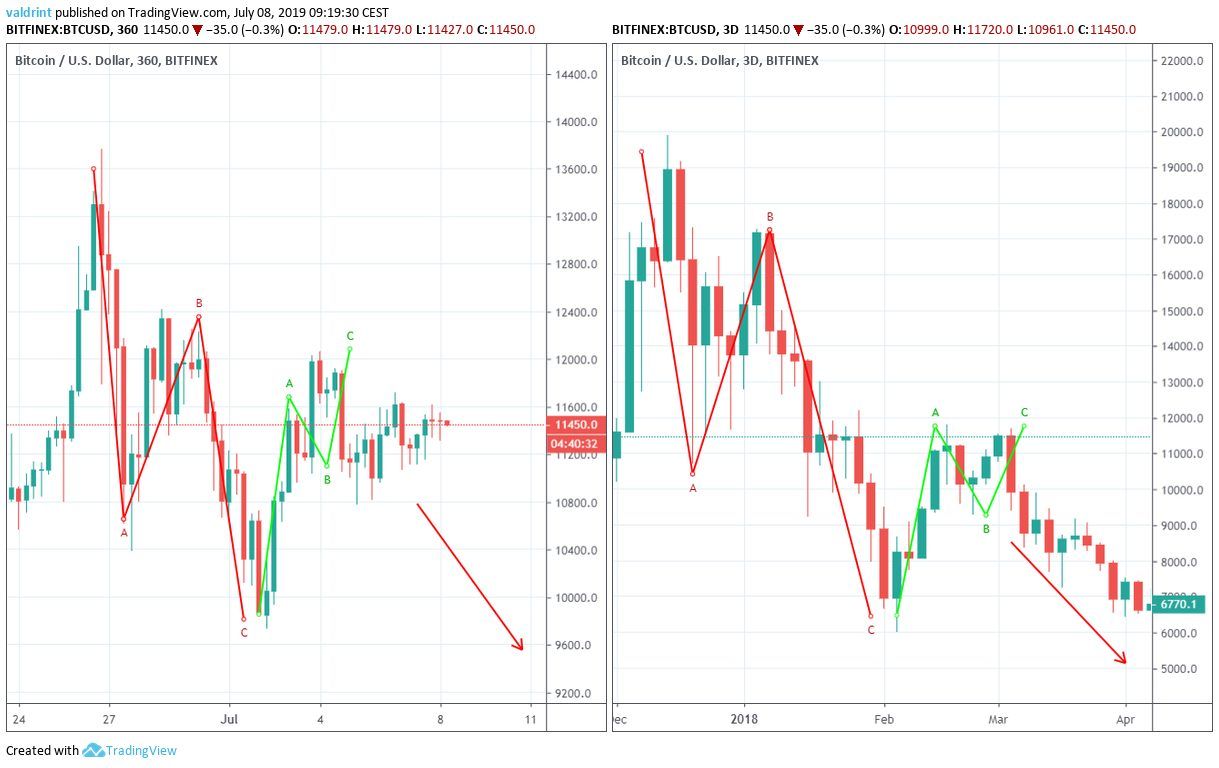
After reaching its high, on both occasions, the BTC price underwent a sharp downtrend in three waves.
A similar but much weaker uptrend followed, also materializing in three waves.
In the end, the price finished with a double top, before beginning the final wave of the decrease.
A breakout from the triangle and subsequent movement towards the resistance area would complete this fractal.
Afterward, the price should continue to decrease.
Summary
The Bitcoin price is trading inside a symmetrical triangle, approaching a critical point.
At the moment, a weak breakout seems likely.
The movement of the daily MAs and MACD is likely to forecast whether the price has more upside or downside potential.
Do you think the Bitcoin price will breakout from the triangle? Let us know in the comments below.
Disclaimer: This article is not trading advice and should not be construed as such. Always consult a trained financial professional before investing in cryptocurrencies, as the market is particularly volatile.
Images are courtesy of Shutterstock, TradingView.
