


On July 2, 2019, the Bitcoin price made a low of $9728. A gradual uptrend began, which — at the time of writing — was still in effect.
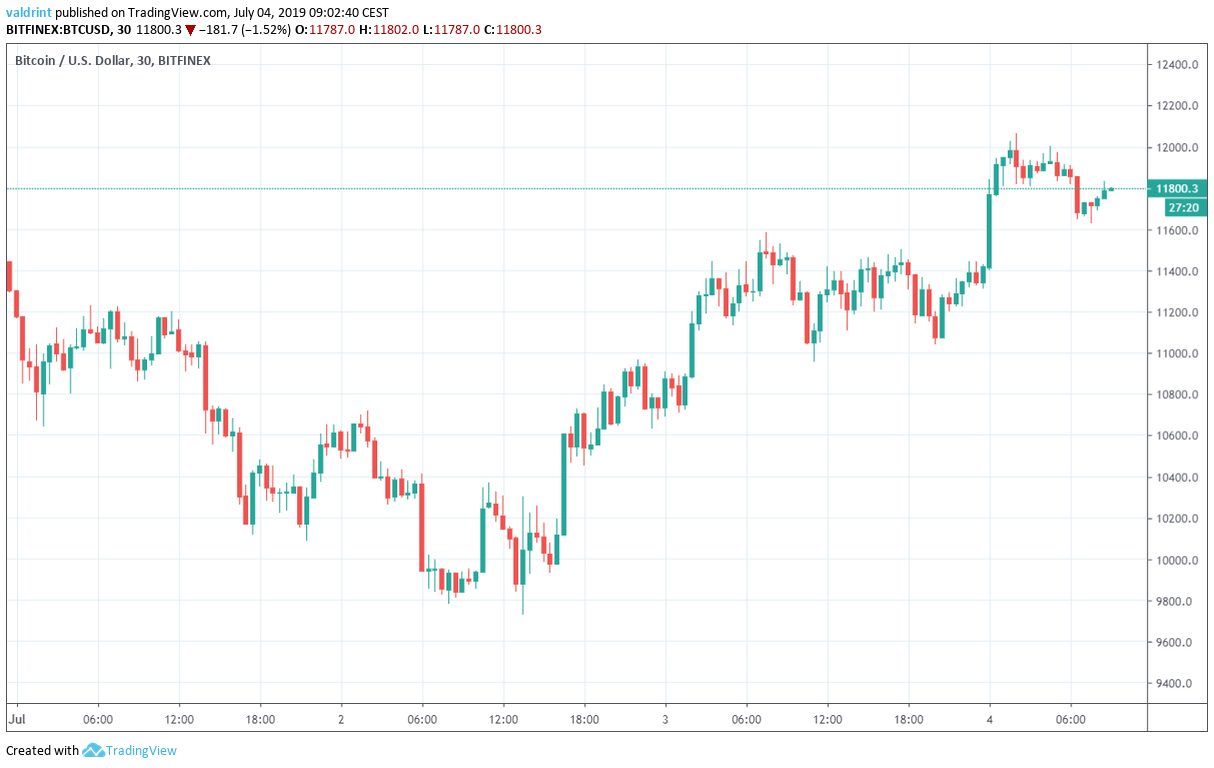
The Bitcoin price is currently trading at around $11,800.
How low will the uptrend continue? Let’s find out:
For our previous analysis, click here.
If you want to trade Bitcoin (BTC) safely and securely on our partner exchange, follow this link to get set up on XCOEX.
Bitcoin Price: Trends and Highlights for July 4
- BTC/USD recently broke out from a descending channel.
- It is trading inside an ascending wedge.
- There is a slight bearish divergence developing in the RSI.
- The Bitcoin price has created two bullish candles in a row.
Previous Bitcoin Price Movement
Since June 27, the Bitcoin price has been trading inside the descending channel outlined below.
On July 2, it reached the support line of the channel. A rapid upward move began, and on July 4 the price broke out from the channel.
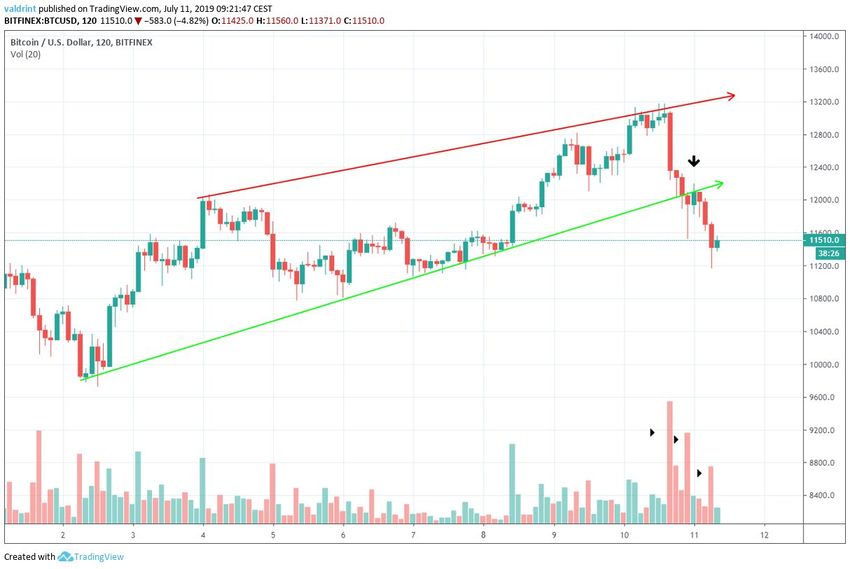
The breakout occurred with significant but not extreme volume.
How high will the price go?
Bitcoin Price in an Ascending Wedge
Since reaching the aforementioned low on July 2 and touching the support line, the Bitcoin price has been increasing.
It has been trading inside the ascending wedge outlined below:
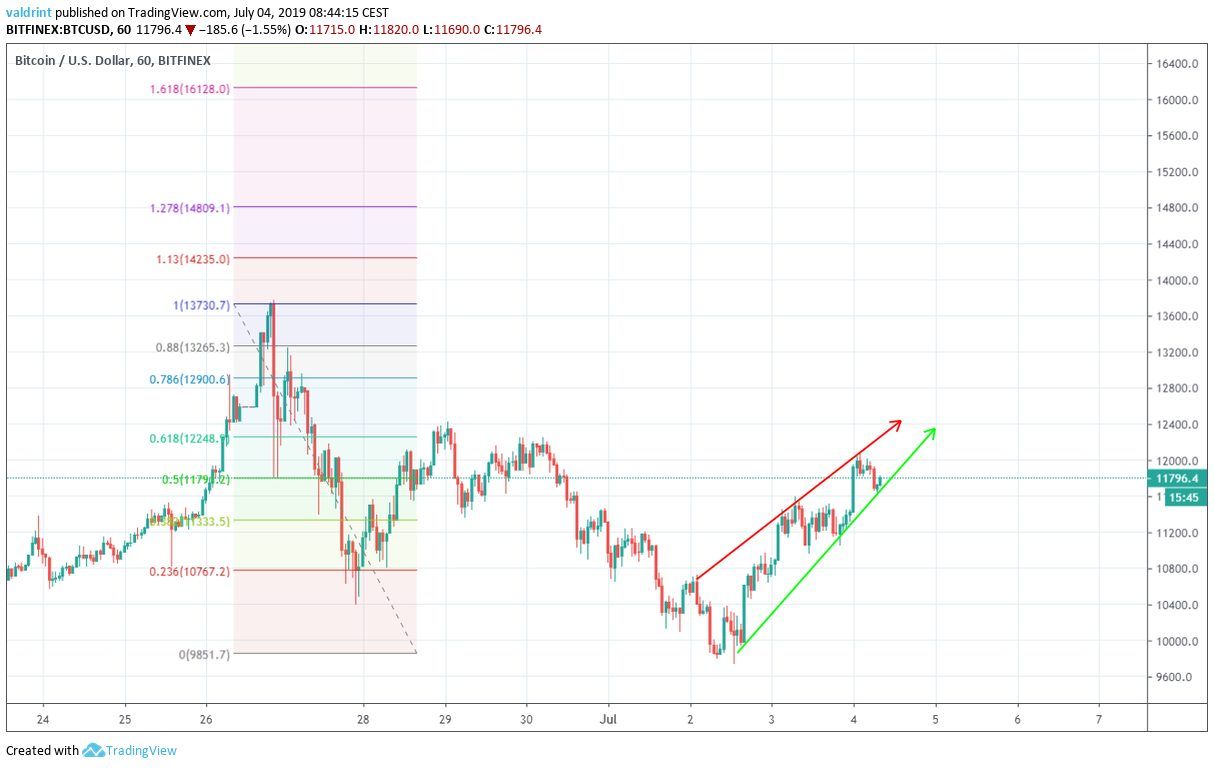
The ascending wedge is considered a bearish pattern, making price breakdowns more likely.
Currently, the price is trading at the 0.5 fib level of the entire drop.
The 0.618 level is near $12,300 and corresponds with the highs of July 28.
As long as it is below the 0.618 level, we cannot consider this upward move as a new uptrend. Rather, it is more likely that it is a correction in response to the prior decreases.
The resistance line has been touched four times. During the last two times it was touched, the RSI has been generating bearish divergence.
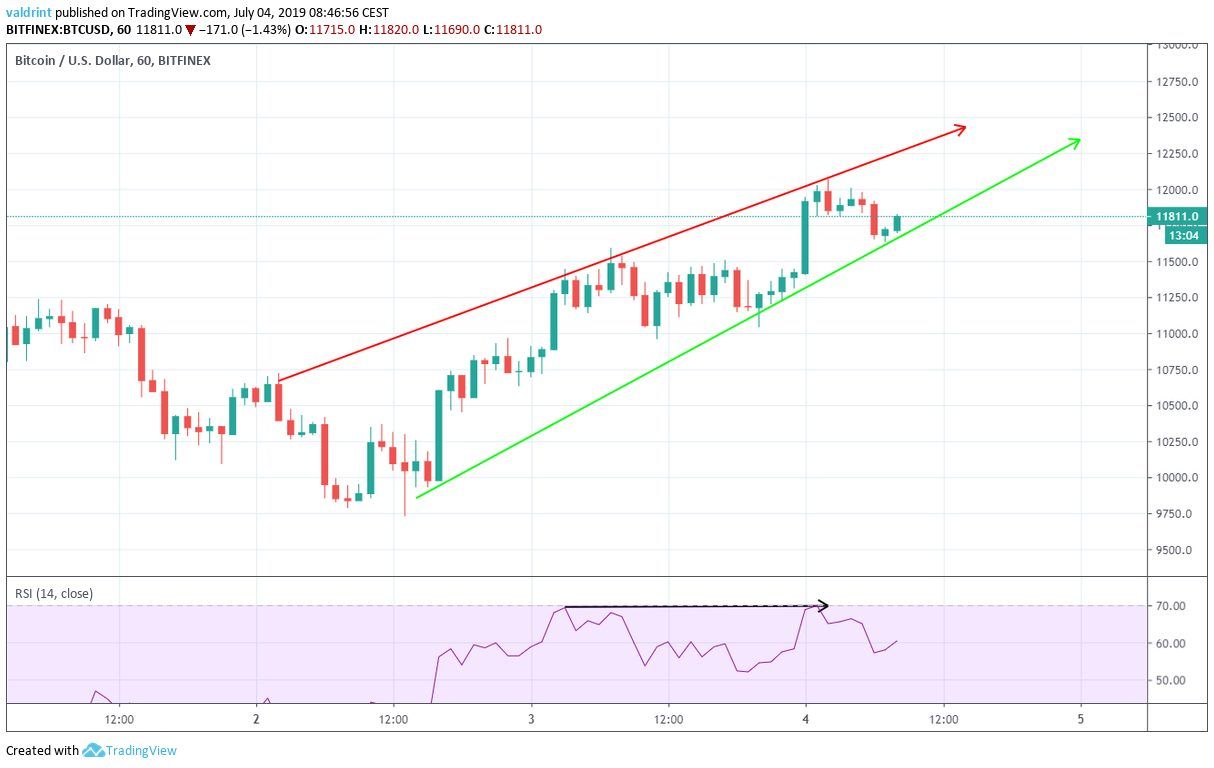
The divergence is not very significant in value and is only present in one indicator.
However, it is occurring at the resistance line of a bearish pattern, giving it more validity.
Finally, the convergence between the support and resistance lines does not occur until at least $12,500.
Therefore, it is possible that the Bitcoin price will continue to increase inside the confines of the wedge until it eventually breaks down.
A breakout looks unlikely.
Candlestick Analysis
Yesterday we stated that:
Today’s candle has so far been bullish. However, it is still contained within the real body of the bearish candle on June 30.
A close above $12,000 would indicate that we are either in the B wave of an A-B-C correction or that the correction has been completed and the upward trend will continue.
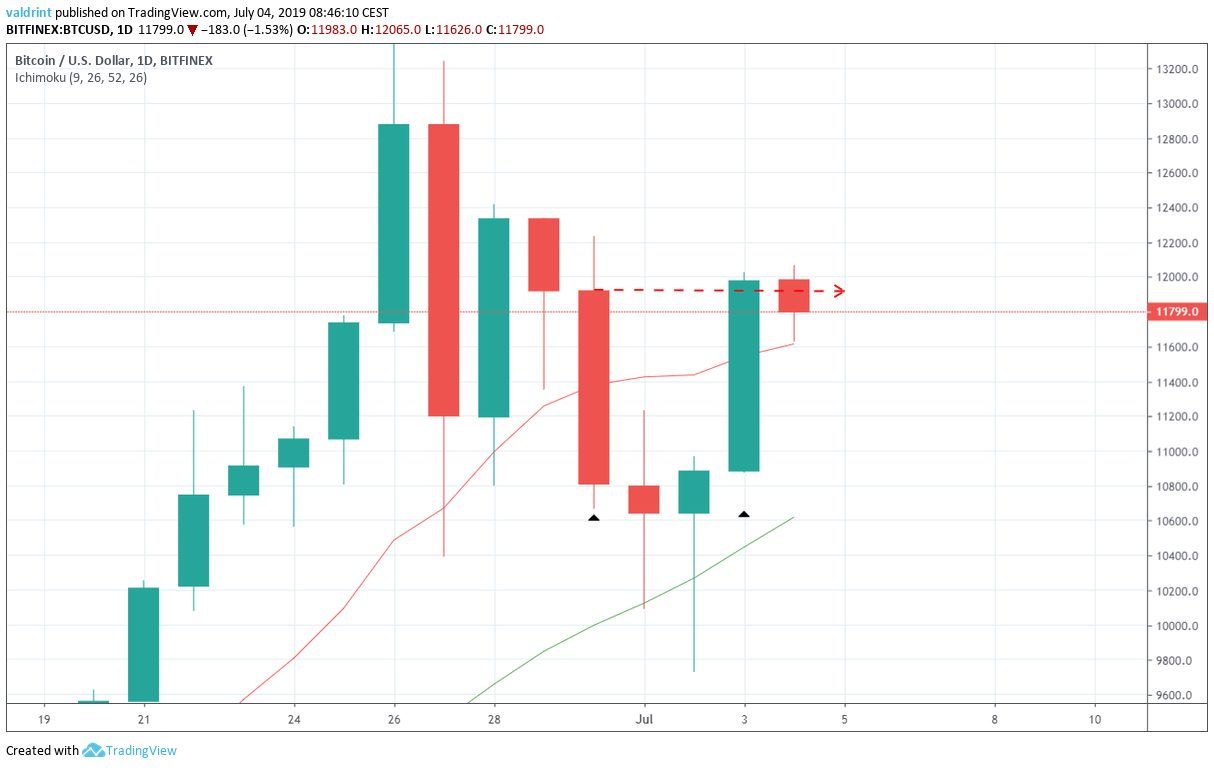
The candle for July 3 closed at $11,982. This is a close above the opening of the bearish candle on June 30.
Furthermore, the candle succeeded a bullish hammer on July 2. The increase also took the BTC price above the 10-day moving average, which had previously provided resistance to the price.
A similar thing is happening in a weekly time-frame.
The price had been in the process of completing a bearish evening star.
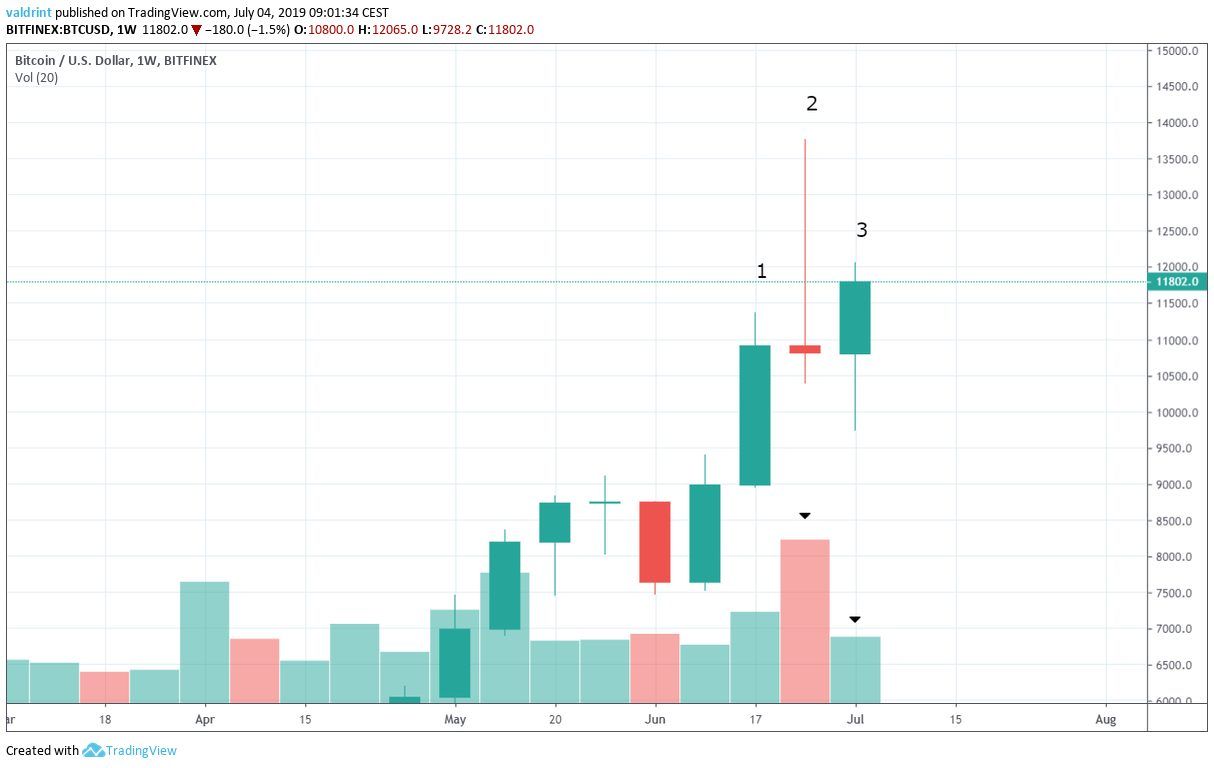
However, instead of completing a bearish engulfing candle, the price has been increasing instead.
But, there are still four trading days left until the end of the week. Therefore, it is still possible that the Bitcoin price will decrease and create a bearish candle.
According to this analysis, the price is approaching a critical point, after which we will know whether the price is still in a correction or if a new uptrend has begun.
A breakout from the wedge or a close above the previous lower high at $12,500 would most likely confirm that an uptrend has begun.
Summary
The price of Bitcoin previously broke out form a descending channel. It is currently trading inside an ascending wedge.
The price has been struggling to retrace above the 0.618 fib level of the entire drop, indicating that it is likely still correcting.
Do you think the Bitcoin price has finished its correction? Let us know in the comments below.
Disclaimer: This article is not trading advice and should not be construed as such. Always consult a trained financial professional before investing in cryptocurrencies, as the market is particularly volatile.
Images are courtesy of Shutterstock, TradingView.


