
On June 26, 2019, the price of Bitcoin (BTC) reached a high of $13,764. A rapid decrease ensued the same day. The price has been decreasing since, alternating between sharp and gradual decreases.

However, since reaching a low of $10,388 on June 27, the Bitcoin price has initiated a short-term uptrend. How long will this uptrend continue? Keep reading below in order to find out.
This is a relatively short-term analysis. For our previous, longer-term analysis, click here.
Bitcoin Price: Trends and Highlights for June 28
- BTC/USD has made a bearish engulfing daily candlestick.
- The price recently broke out of a descending wedge.
- There is resistance near $12,200.
Bearish Candlestick on Daily Bitcoin Price Chart
In daily time-frames, the Bitcoin price created a bullish candlestick on June 26. However, it had a long upper wick, indicating that there is selling pressure in the market.
The following day, a rapid decrease occurred.
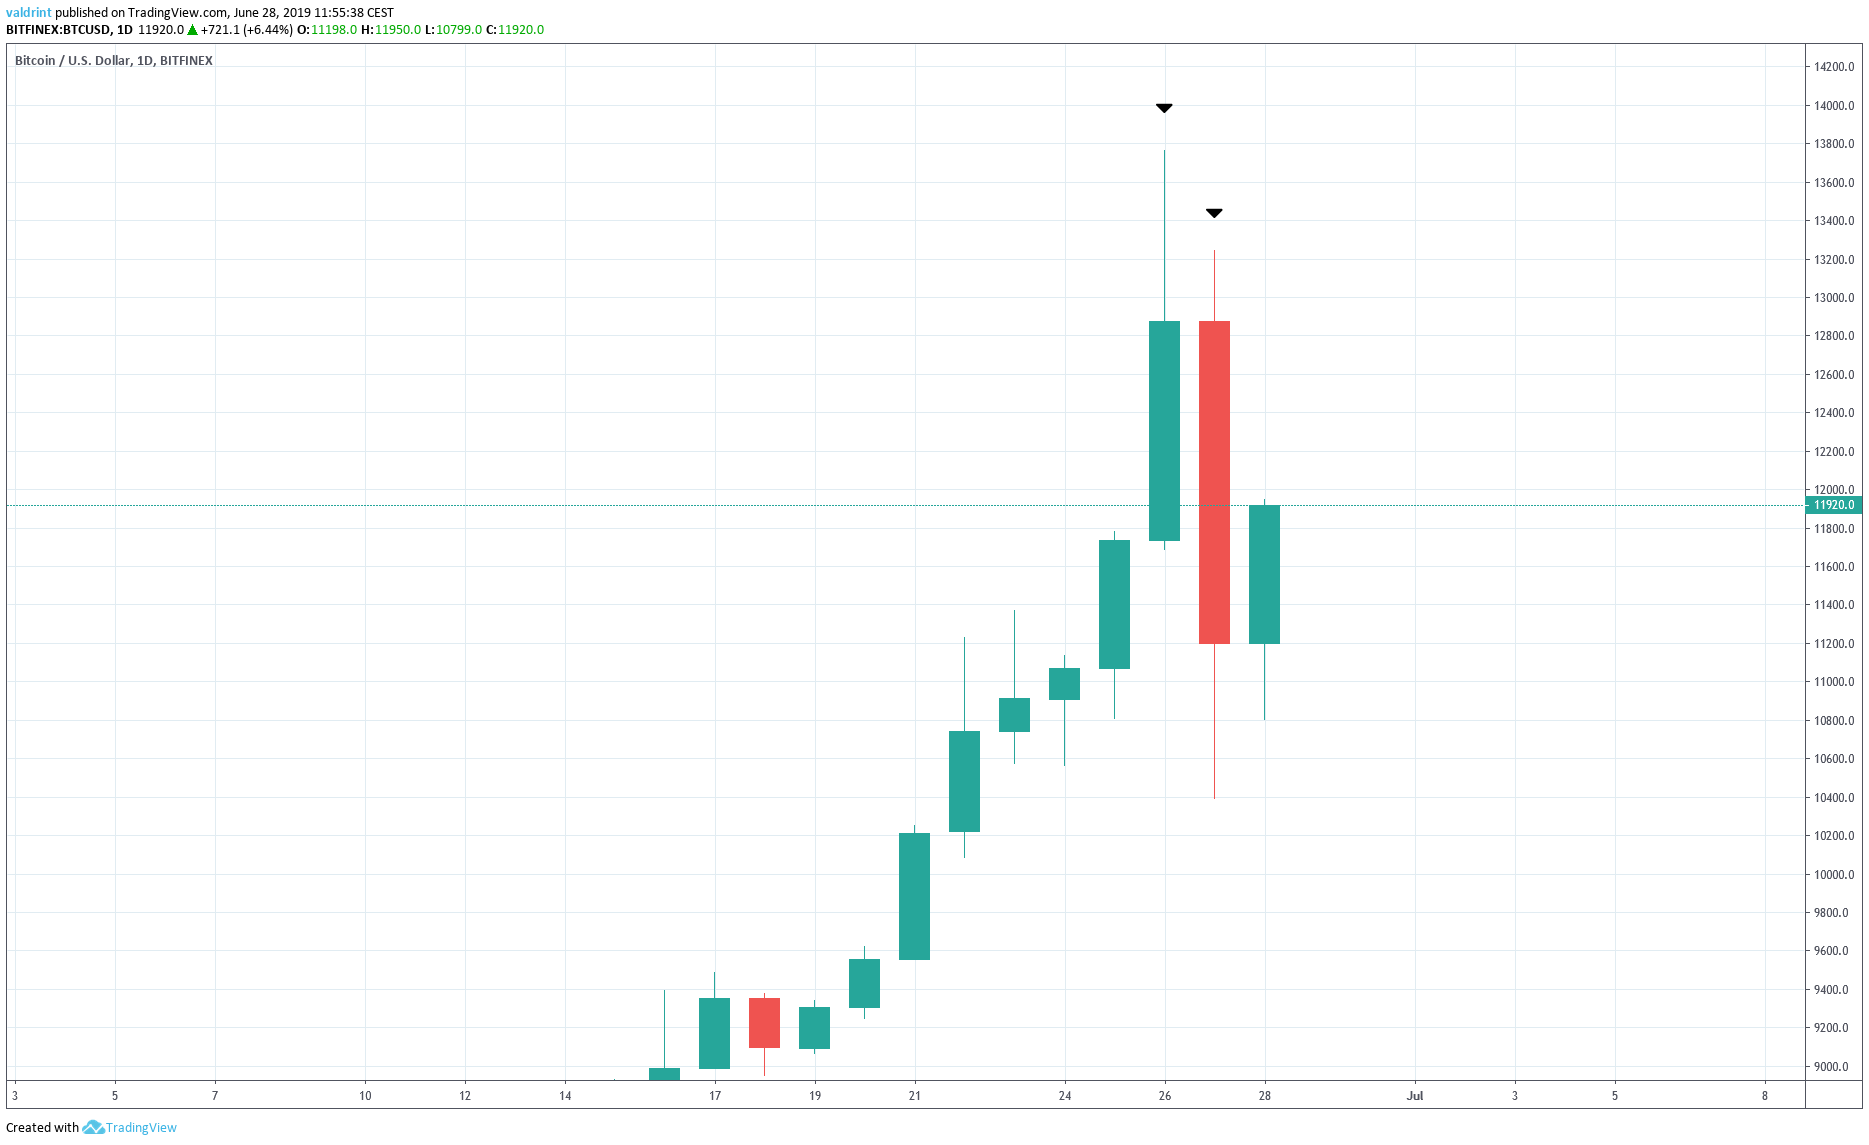
The candlestick for June 27 was bearish engulfing. It closed significantly below the opening of the prior day’s candle.
This is often viewed as a reversal pattern, especially if it is occurring at a possible high.
Previous Bitcoin Price Movement
Since reaching a high on June 26, the Bitcoin price has been trading inside a descending wedge.
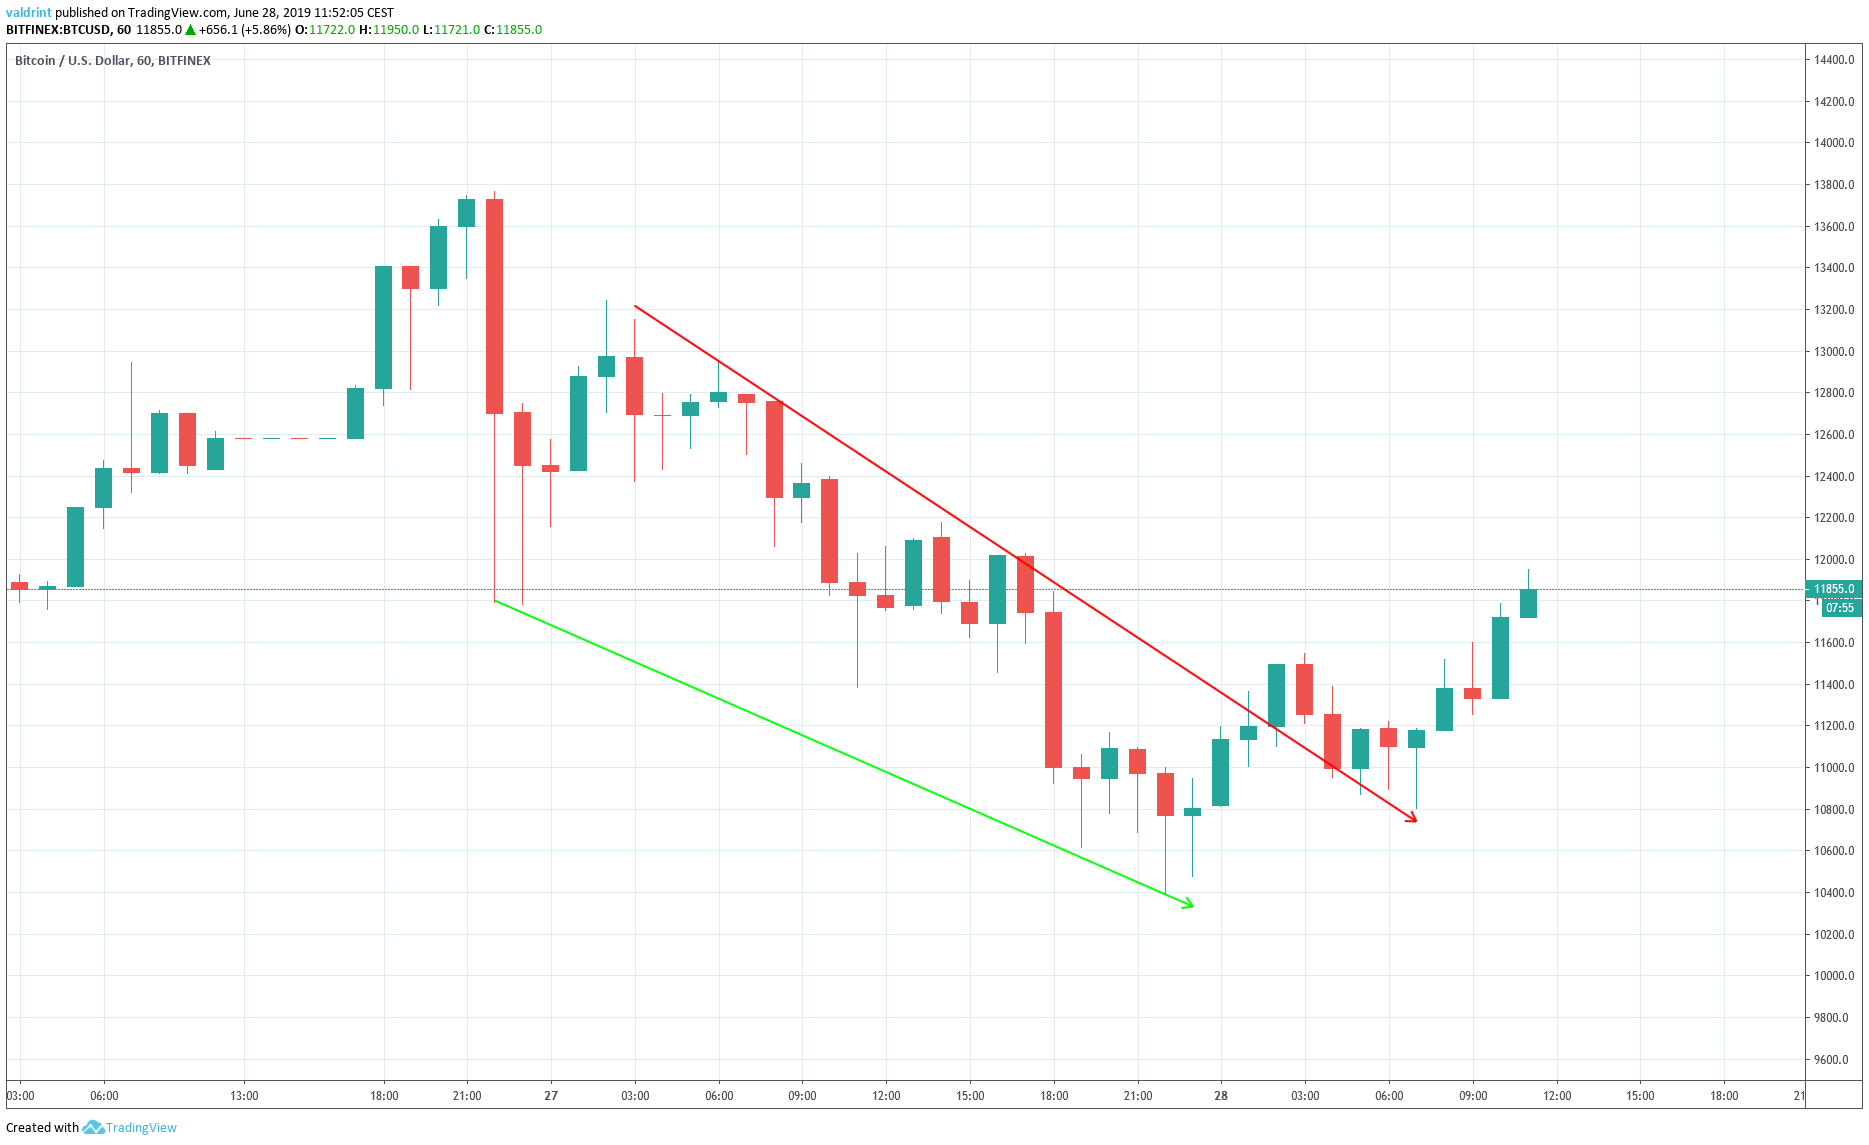
The Bitcoin price broke out from the wedge on June 28. At the time of writing, it had already begun its upward move and was trading close to $12,000.
Where will it find resistance?
Possible Resistance
The closest resistance area is found near $12,200.
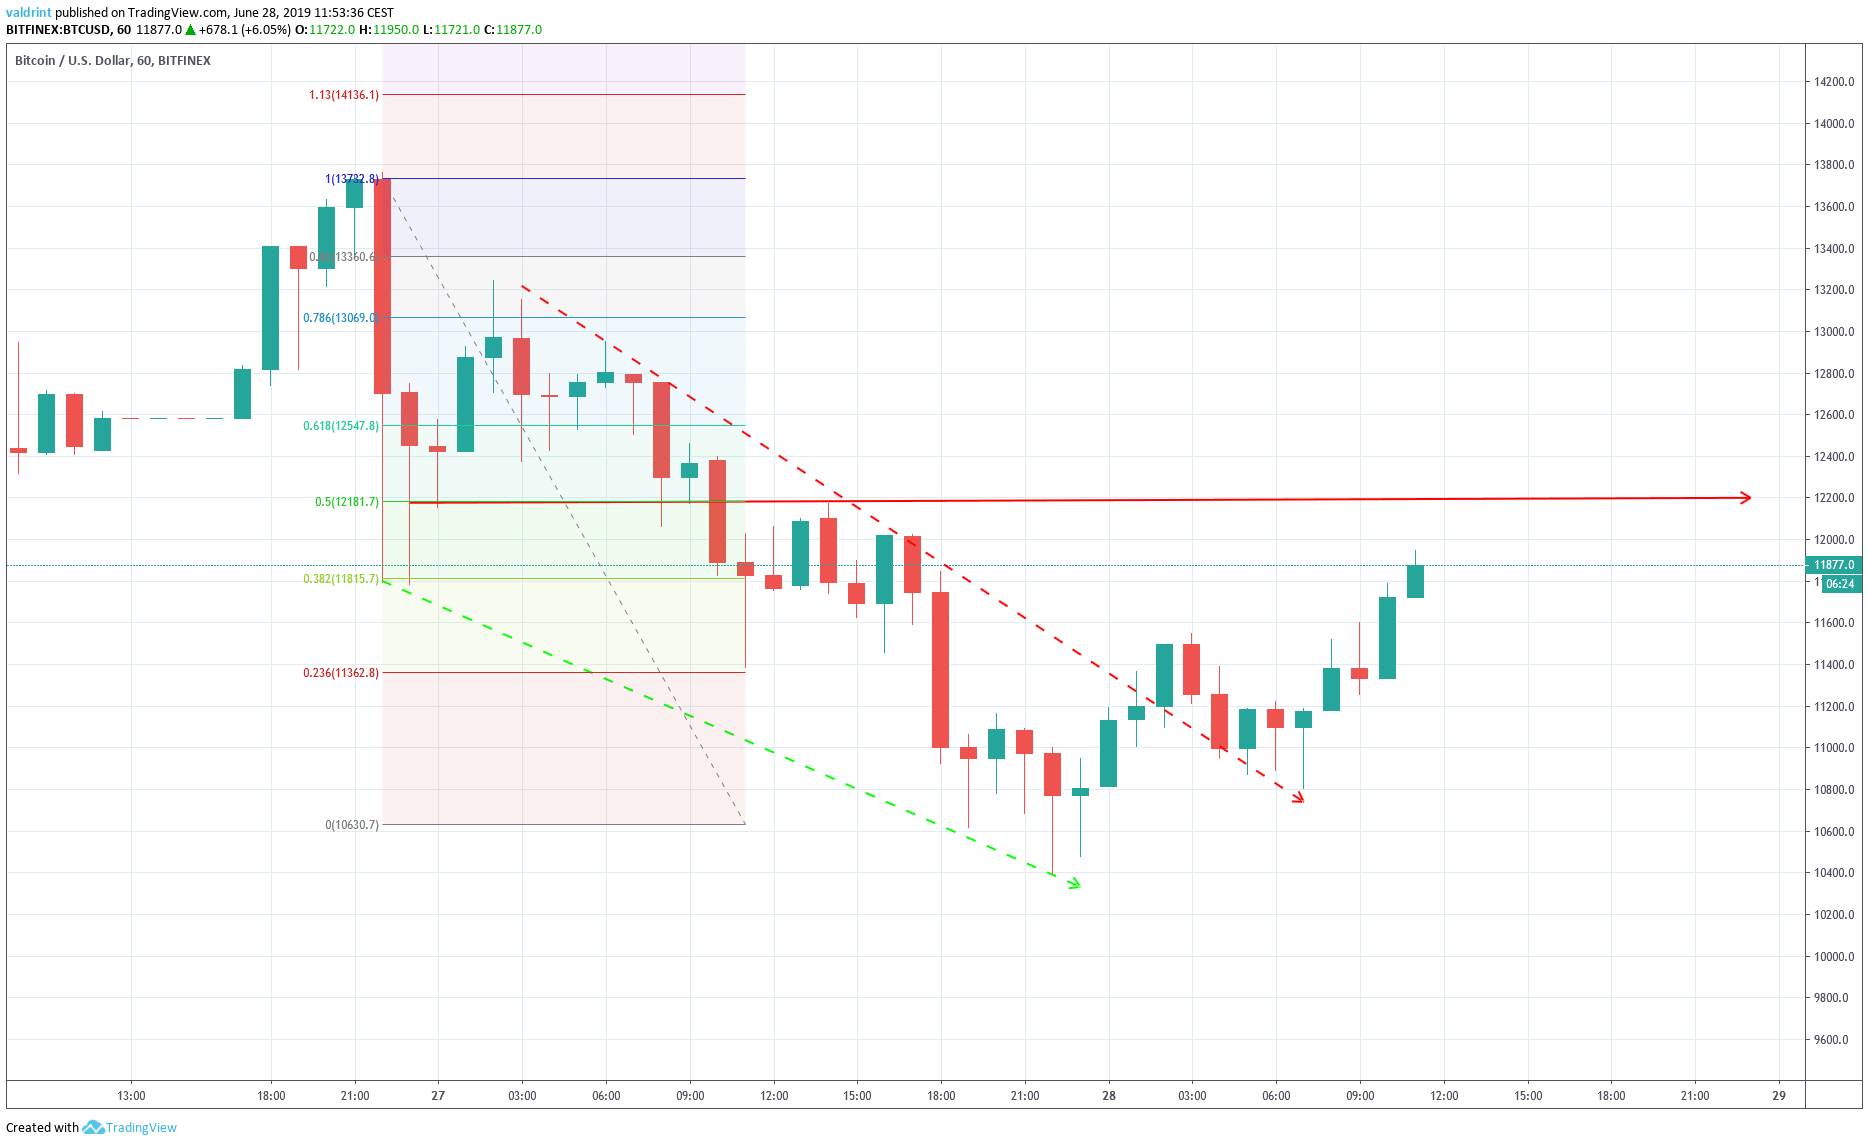
The area previously acted as support on June 27, and as resistance later during the same day. Furthermore, it coincides with the 0.5 fib level of the entire drop.
The next resistance areas can be found near $12,600 and $13,0000.
Movement above this level would likely indicate that the BTC price is either creating a double/triple top pattern or continuing the uptrend that began in April.
At the current time, this seems unlikely. However, we cannot entirely rule out the possibility.
Summary
The price of BTC reached a high on June 27 and began and initiated a rapid decrease. It created a bearish engulfing daily candlestick.
It broke out from a descending wedge and it is currently in an upward move.
There is resistance near $12,200, found by the 0.5 Fib level of the entire upward move and previous support/resistance.
How long do you think the Bitcoin price will continue to increase? Let us know in the comments below.
Disclaimer: This article is not trading advice and should not be construed as such. Always consult a trained financial professional before investing in cryptocurrencies, as the market is particularly volatile.
Images are courtesy of Shutterstock, TradingView.
