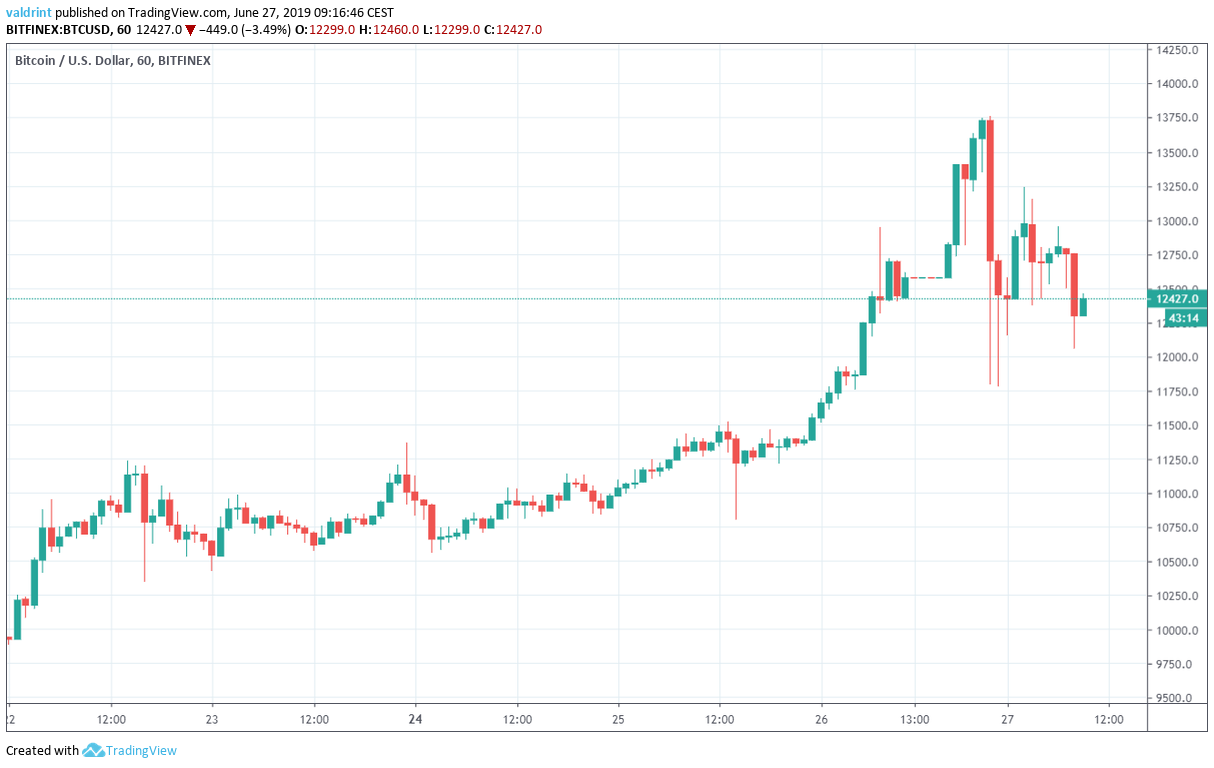
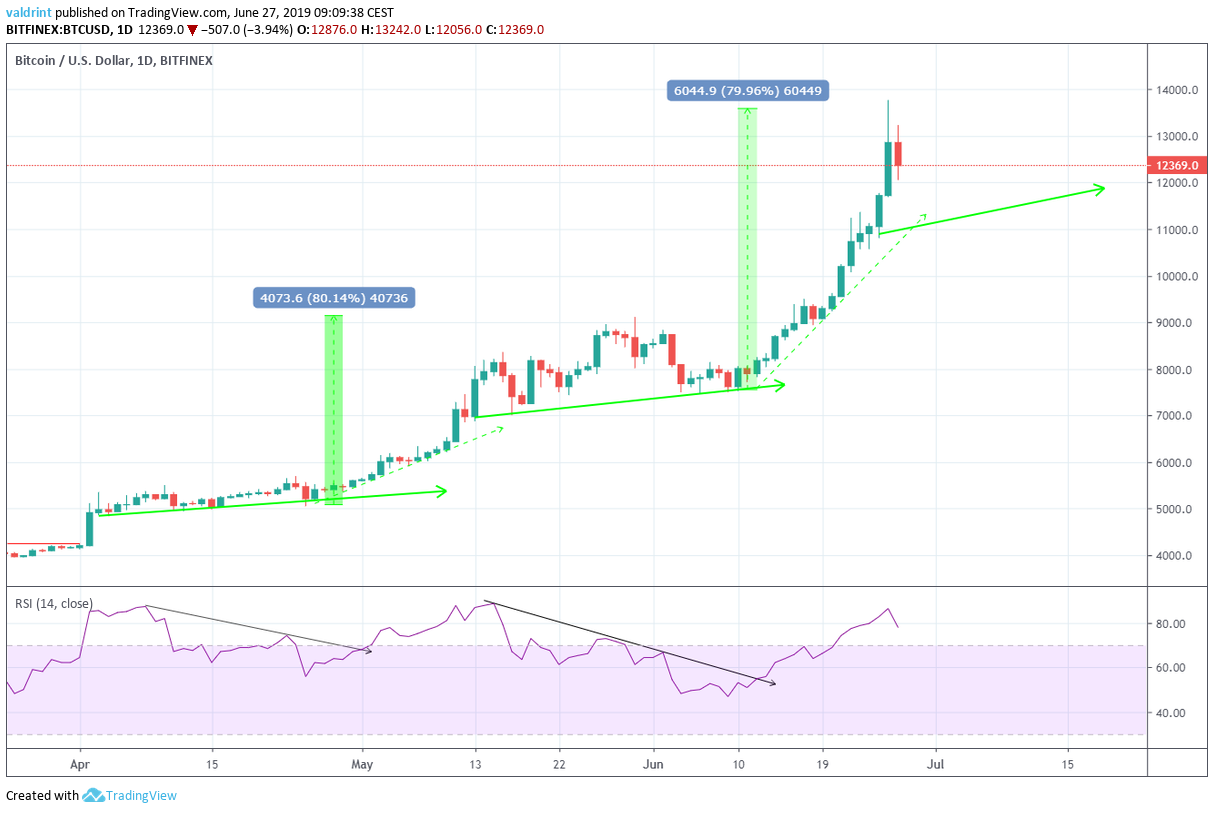
The price of Bitcoin (BTC) has been gradually increasing since June 22, 2019. The rate of increase intensified on June 26, reaching a high of $13,764. A rapid decrease ensued, and the price made lows below $12,000 during the same day.
Is this the beginning of a reversal for BTC?
Keep reading below and find out.
Bitcoin Price: Trends and Highlights for June 27
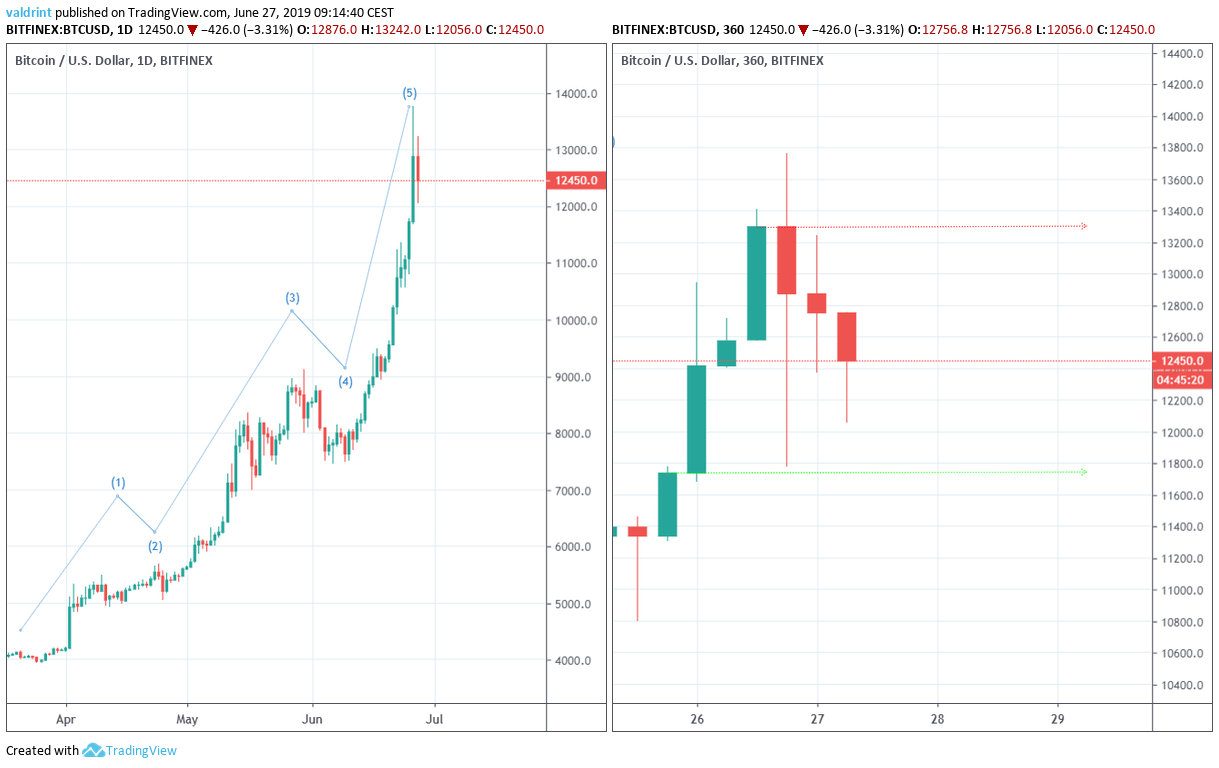
- The Bitcoin price is potentially in the final wave of a five-wave Elliot formation.
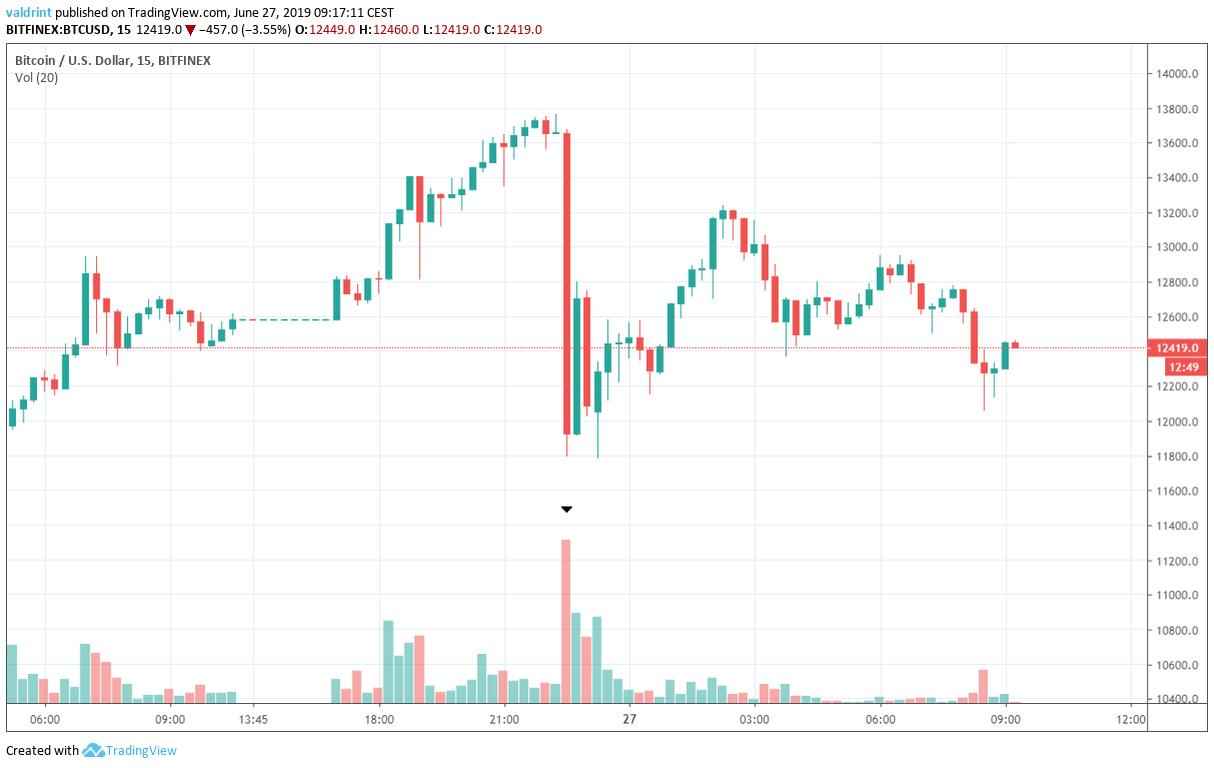
- It initiated a rapid decrease on June 26.
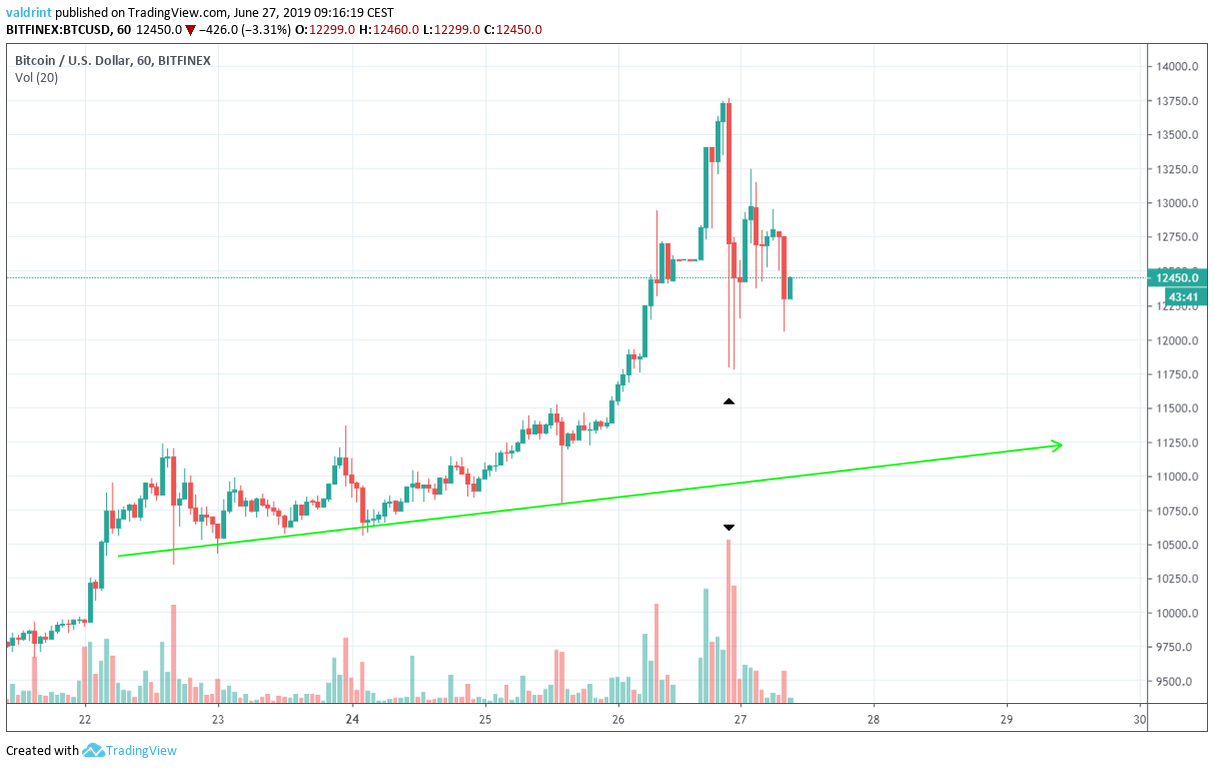
- The decrease occurred with significant volume.
- Volume was higher during bearish candles.
Bitcoin Price: Elliott Wave
The price of BTC/USD is analyzed at daily intervals.
In yesterday’s analysis, we stated that we believe that the price is likely in the final wave of a five-wave Elliott formation.
Our initial target for the top was $13,700, followed by $16,500.
Short-Term Bitcoin Price Outlook
The price of BTC is analyzed alongside volume at hourly intervals (First graph) and 15-minute intervals (Second graph)
The Bitcoin price has been following an ascending support line since June 22.
The increase on June 26 took the price significantly above this support line.
Fractal
In yesterday’s analysis we stated that:Interestingly, during the upward move in May, the BTC price increased by 80 percent — measuring from the final time it touched the support line. An identical rate of increase would take the price to $13,700, which is the same target given by the Fibonacci retracement tool.
Summary
The Bitcoin price made a high of $13,764 before losing almost $2000 in value in a span of one hour. The decrease occurred with significant volume. If the price continues to follow the fractal from April, a period of consolidation should ensue. It is still too early to make a confident prediction on whether a reversal will ensue or if this was just a temporary correction. As the market continues to give more signs, we will update the analysis as necessary. Do you think the price of BTC will initiate a reversal? Let us know in the comments below.Disclaimer: This article is not trading advice and should not be construed as such. Always consult a trained financial professional before investing in cryptocurrencies, as the market is particularly volatile. Images are courtesy of Shutterstock, TradingView.
Disclaimer
In line with the Trust Project guidelines, this price analysis article is for informational purposes only and should not be considered financial or investment advice. BeInCrypto is committed to accurate, unbiased reporting, but market conditions are subject to change without notice. Always conduct your own research and consult with a professional before making any financial decisions. Please note that our Terms and Conditions, Privacy Policy, and Disclaimers have been updated.

Valdrin Tahiri
Valdrin discovered cryptocurrencies while he was getting his MSc in Financial Markets from the Barcelona School of Economics. Shortly after graduating, he began writing for several different cryptocurrency related websites as a freelancer before eventually taking on the role of BeInCrypto's Senior Analyst.
(I do not have a discord and will not contact you first there. Beware of scammers)
READ FULL BIO
Sponsored
Sponsored

