


The price of Bitcoin has enjoyed significant increases in 2019. Since breaking out of the resistance line at $4200 on Apr 2, the rate of increase has intensified.
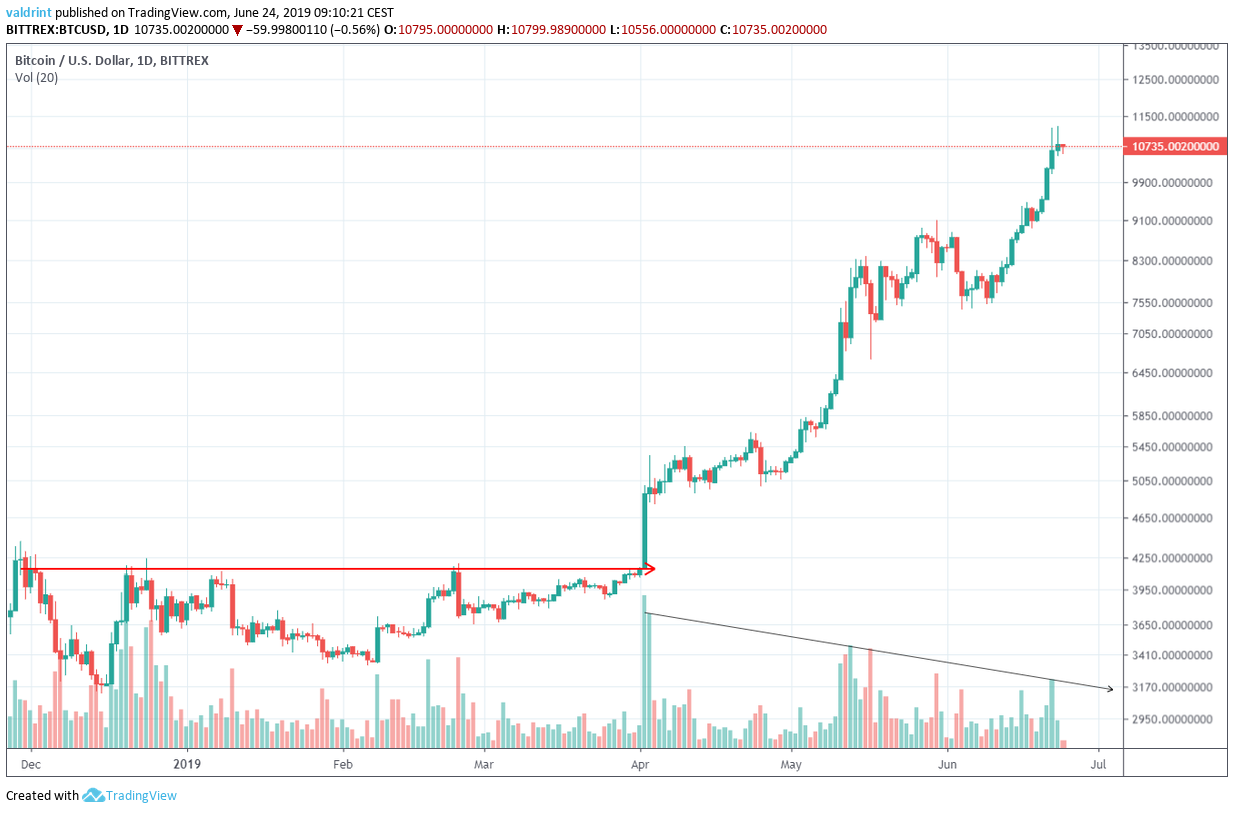
The breakout occurred with high volume — the highest daily volume recorded in 2019. Since then, the volume has been decreasing while following a descending resistance line that has not yet been broken.
Bitcoin: Trends And Highlights For June 24
- BTC/USD is potentially in the final wave of a five-wave Elliott Formation.
- It is following a steep ascending support line.
- The RSI broke out from a downtrend.
- It is trading inside an ascending, broadening wedge.
Elliott Wave Formation
Because of the breakout and succeeding price movement, we are going to hypothesize that it was the first wave of a five wave Elliott formation.
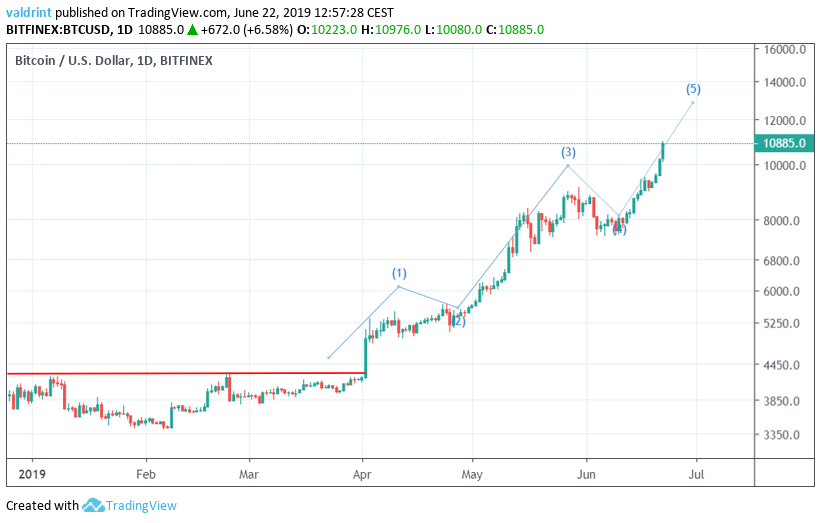
The first wave is usually the shortest and the third wave is the longest. A definitive rule is that the third wave cannot be the shortest. If our hypothesis is correct, we need a target for the top of the fifth wave.
In order to do that, we applied the Fibonacci retracement tool to two moves;
- The downward move from nearly $20,000 to $3300 from Dec 2017 to Dec 2018. (Left side)
- The downward move from $9100 to $7300 at the beginning of June 2019. (Right side)
In the left graph, we can see that the price is very close to the 0.5 fib level of the entire drop, which is currently near $11,700. If the price breaks out, the 0.618 level is set at $13,600. So, we have our initial two targets.
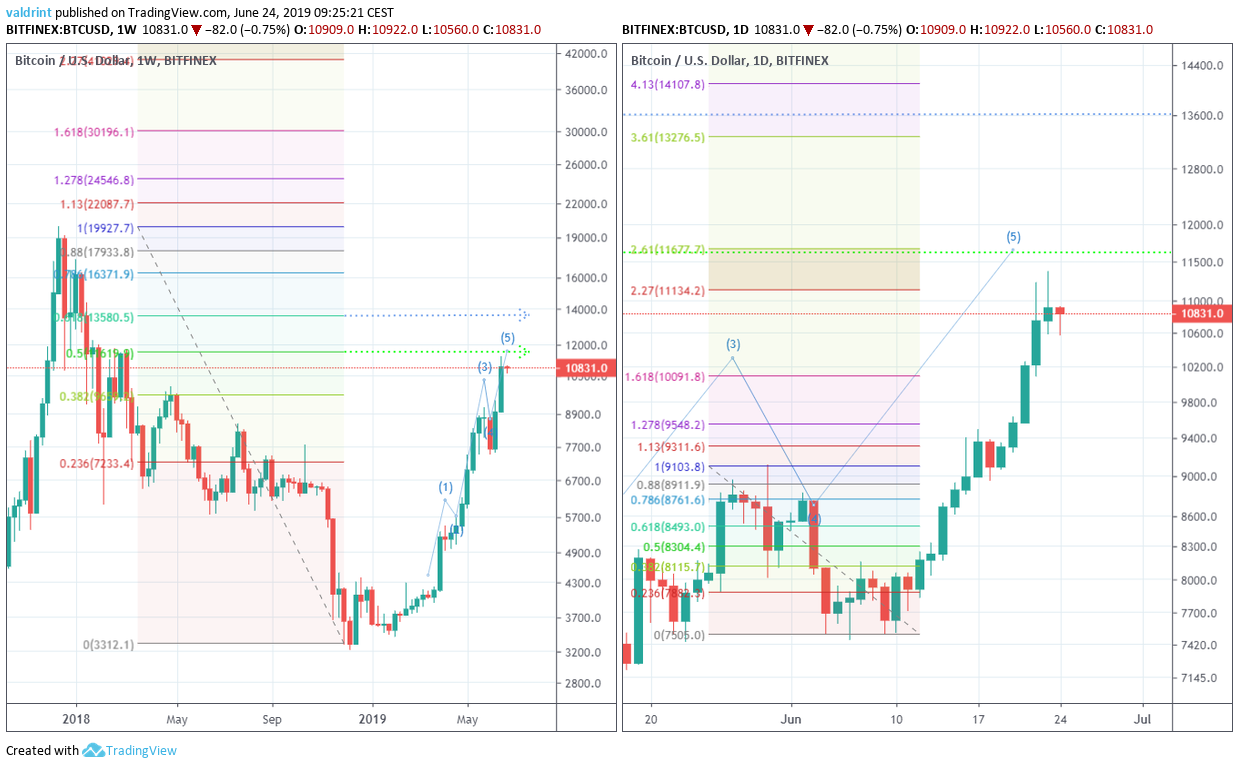
On the right-hand side, the 2.61 level is at $11,670 and coincides with the 0.5 level of the entire upward move (dashed green line). This coincides with the first target for the top of the fifth movement, which is set at $11,670. If the price reaches it and continues to increase, the second one (blue dashed line) would be set near the 3.61 level at $13,300.
Fractal
After the rapid upward move on Apr 2, the price of BTC followed an ascending support line. It did the same after the similarly rapid upward move on May 13.
The price movements following this ascending support line shared several similarities.
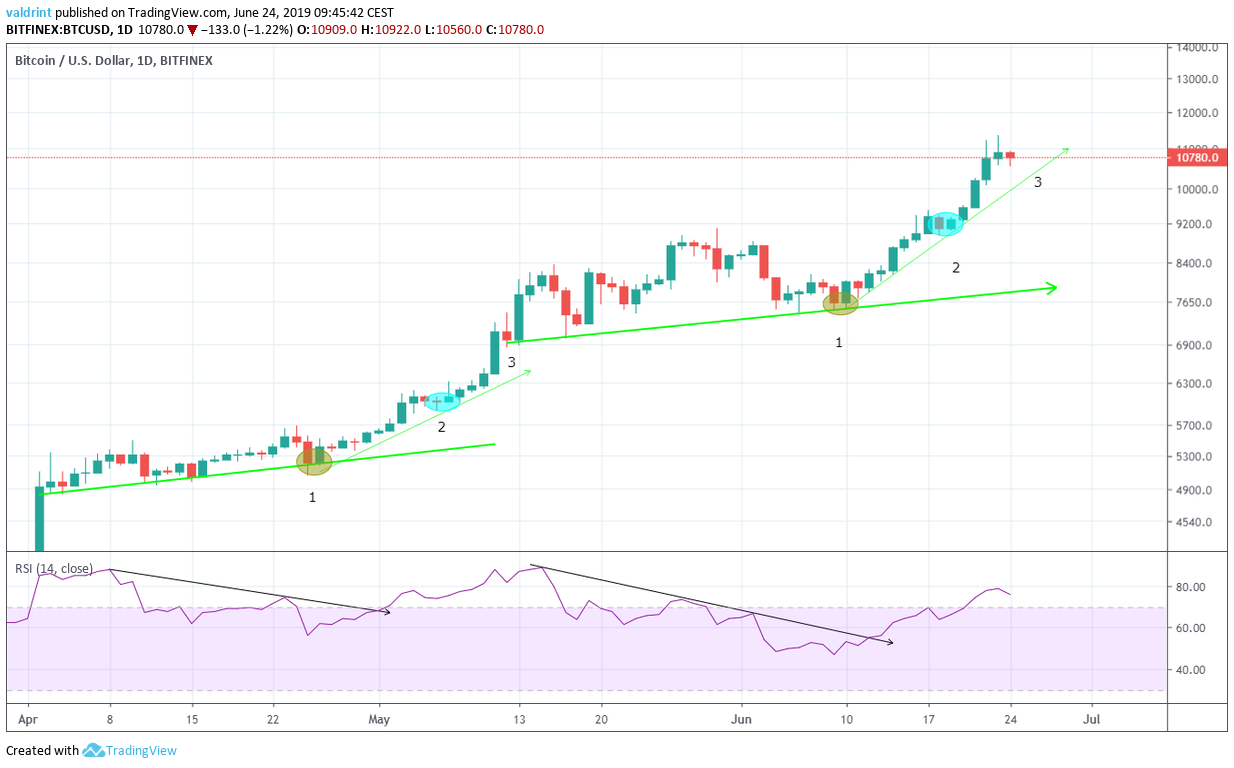
Firstly, the RSI created a bearish divergence in overbought territory. The level of divergence followed a descending line.
The price touched the ascending support line and the RSI broke the trend shortly after. This is the first similarity, noted by the yellow circle.
Afterward, the rate of increase intensified. The price retraced slightly in order to create a new support line. This is the second similarity, identified by the blue circle.
The third step is a series of upward moves, after which the price created the original support line, and repeated the same movement.
If this is correct, we are currently in step three. A series of upward moves should end near the proposed target of $16,700.
Whether the price continues to increase after it reaches our target or begins a reversal is yet to be seen.
Ascending Broadening Wedge
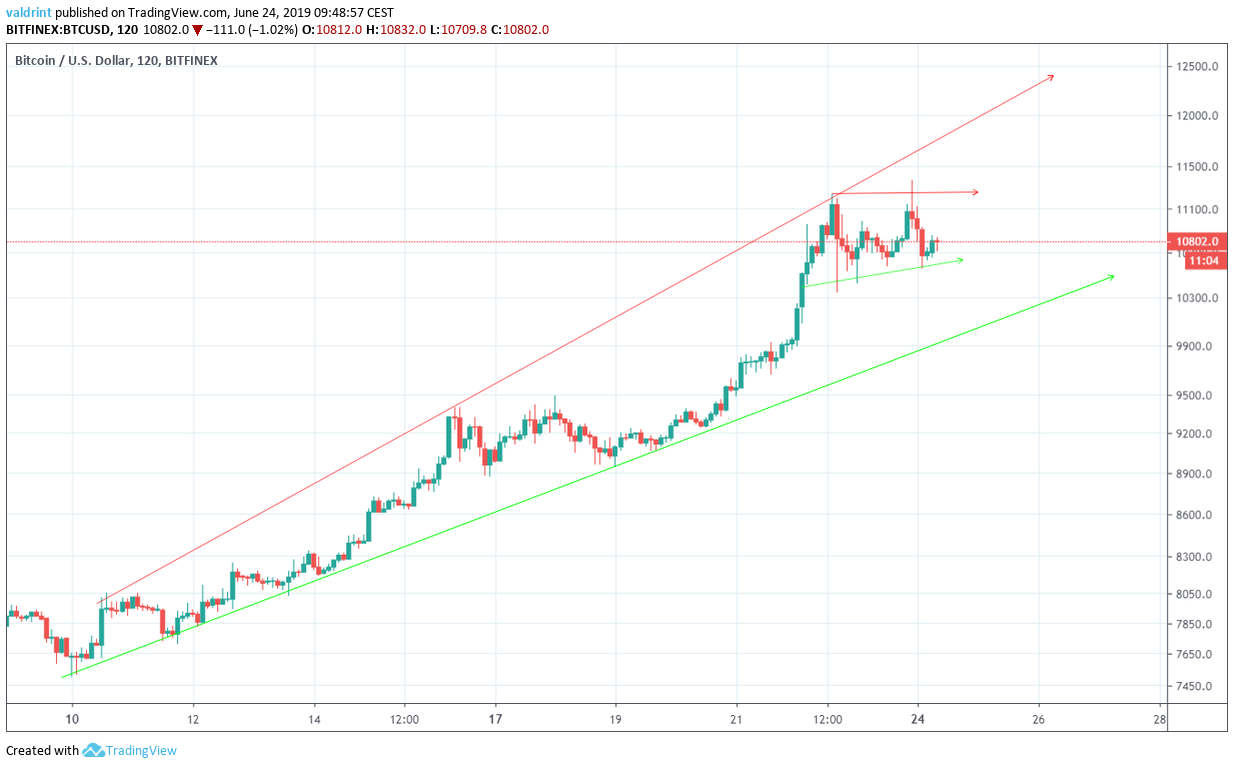
Furthermore, it has been trading inside an ascending triangle since June 22.
According to our analysis, the price is likely to break out from this triangle.
Where do you think the price of BTC will make a top? Let us know in the comments below.
Disclaimer: This article is not trading advice and should not be construed as such. Always consult a trained financial professional before investing in cryptocurrencies, as the market is particularly volatile.
Images are courtesy of Shutterstock, TradingView.


