
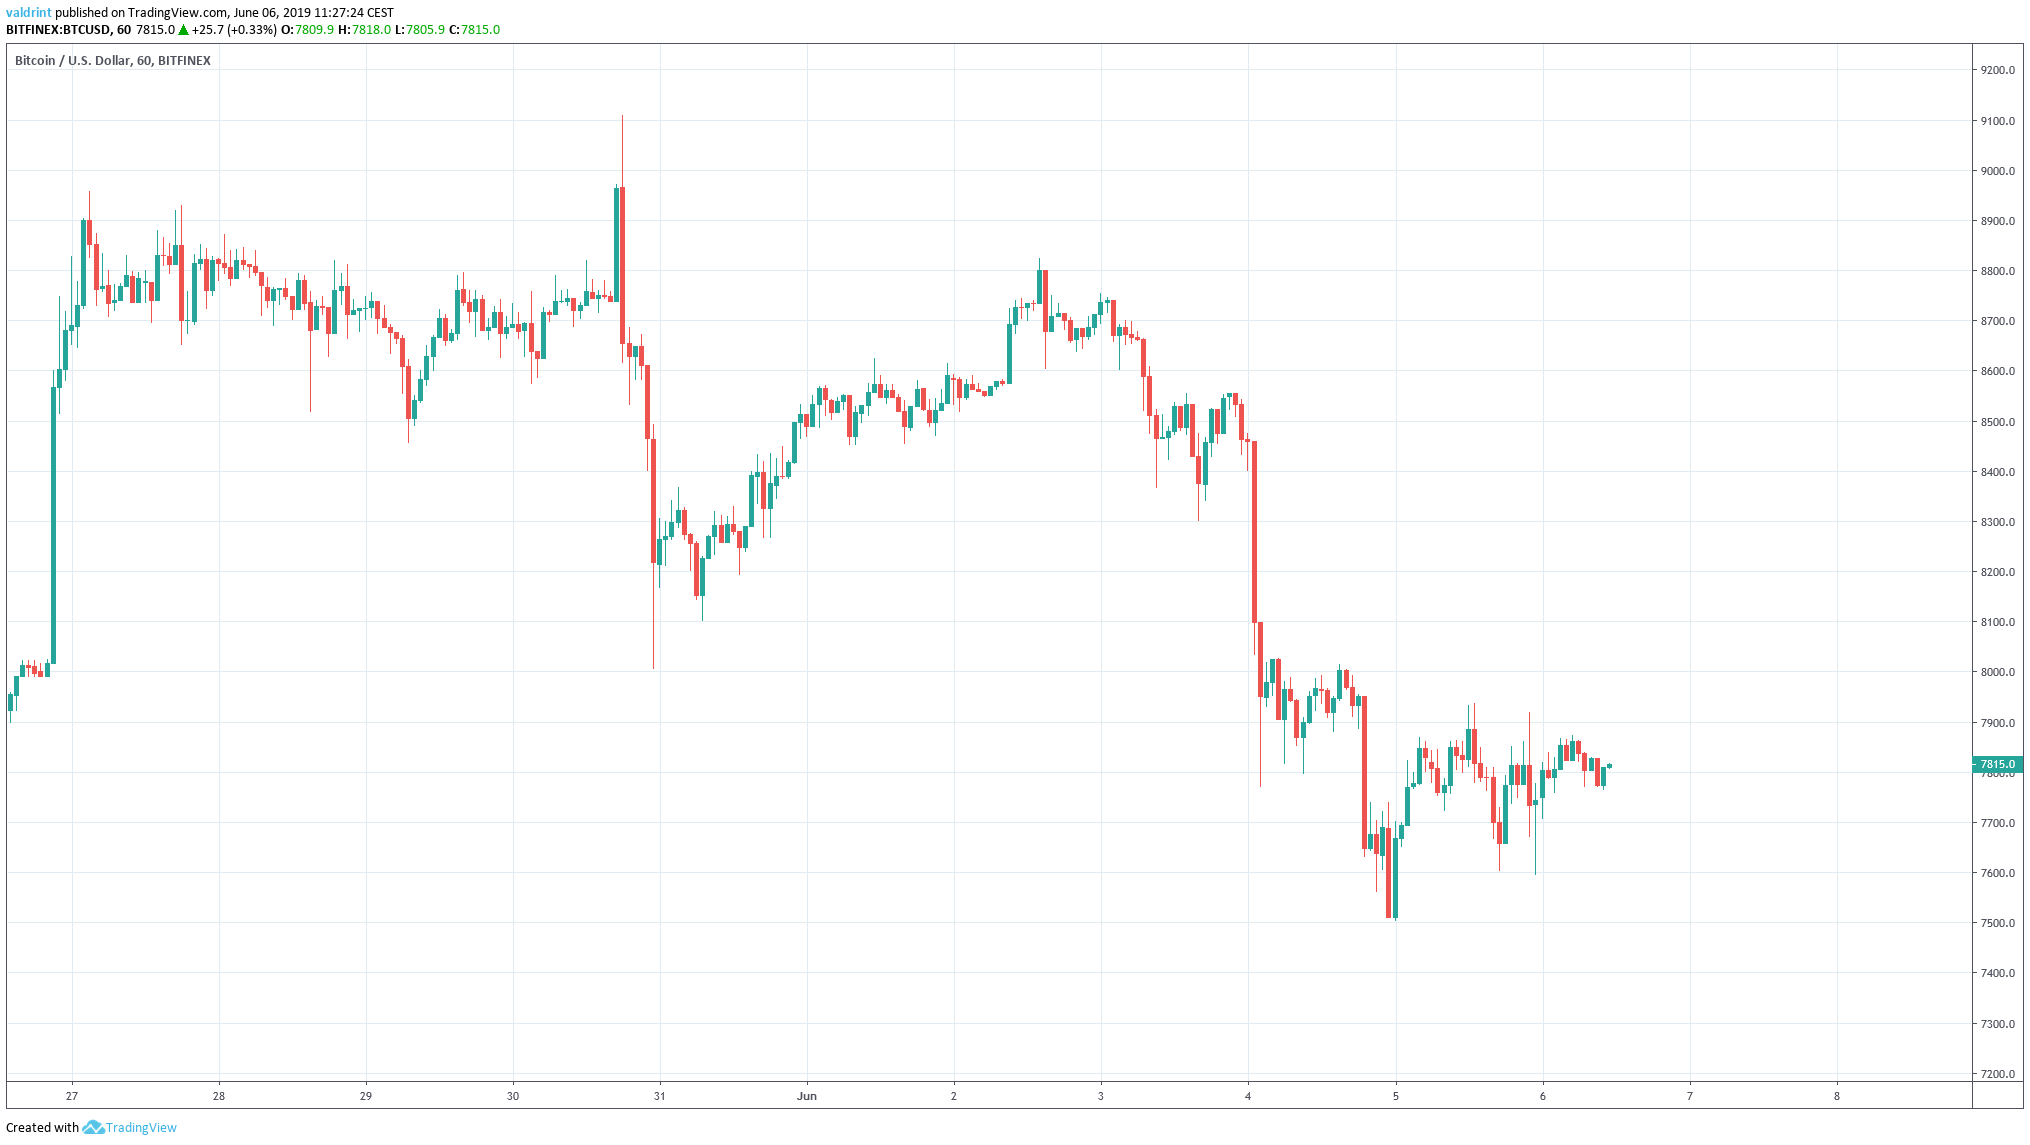
On May 30, the Bitcoin price reached a high of $9109.0. A decrease began on the same day. It was followed by a gradual increase, and the BTC price reached highs near $8800 on Jun 2. A rapid decrease began on Jun 4.
Will the price continue to decrease or is a reversal in store? Keep scrolling in order to find out
Bitcoin Price (BTC): Trends and Highlights for June 6, 2019
- The price of BTC/USD reached a high on May 30.
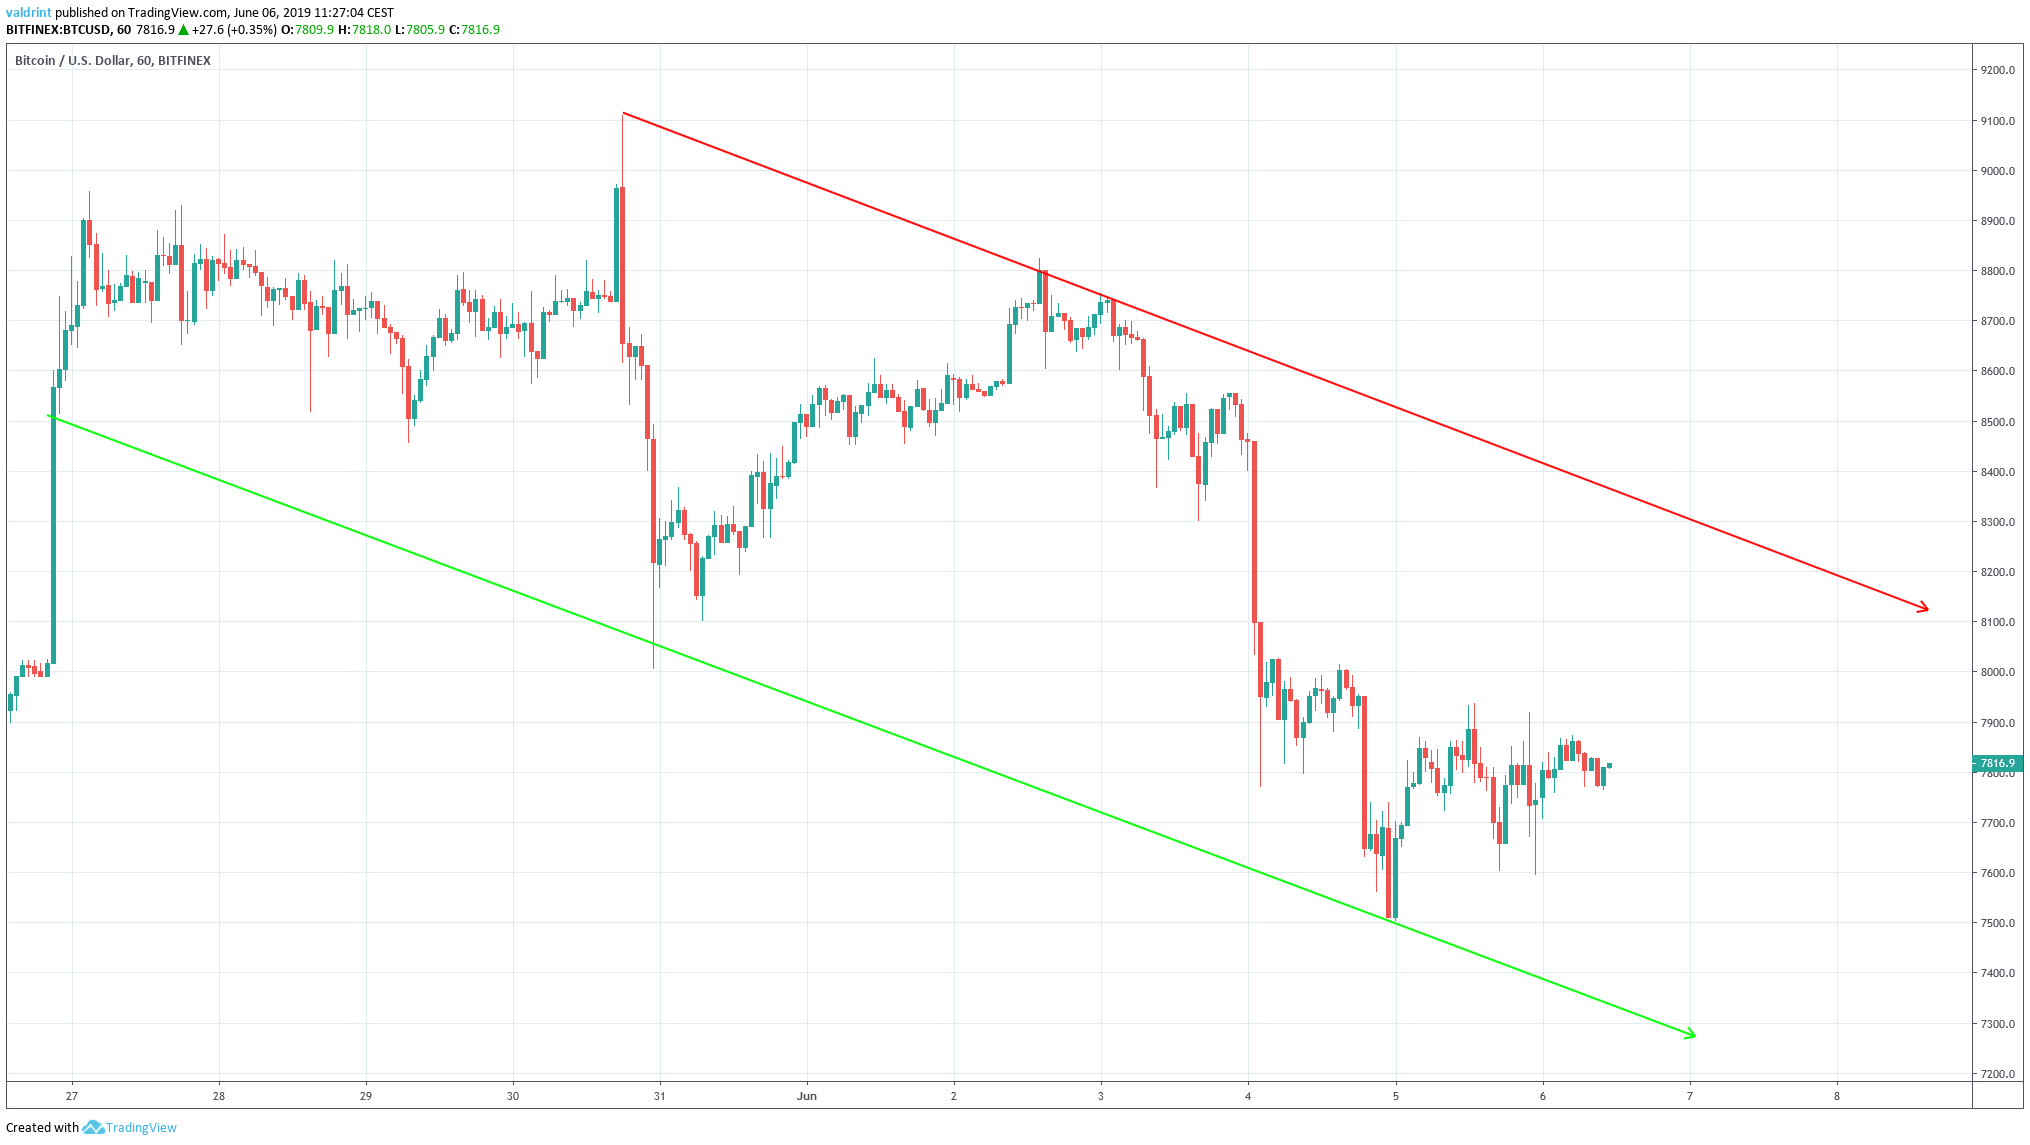
- It is trading inside a descending channel.
- It is trading in a short-term symmetrical triangle.
- The moving averages have made a bullish cross.
- There is support near $7500.
- There is resistance near $8200.
Descending Channel
After reaching a high of $9109.0 on May 30, the Bitcoin price began a rapid decrease. A low of $8005.00 was reached the same day. Several market cycles have been completed and the price has created several lower highs and lows. Tracing them gives us the descending channel outlined below:
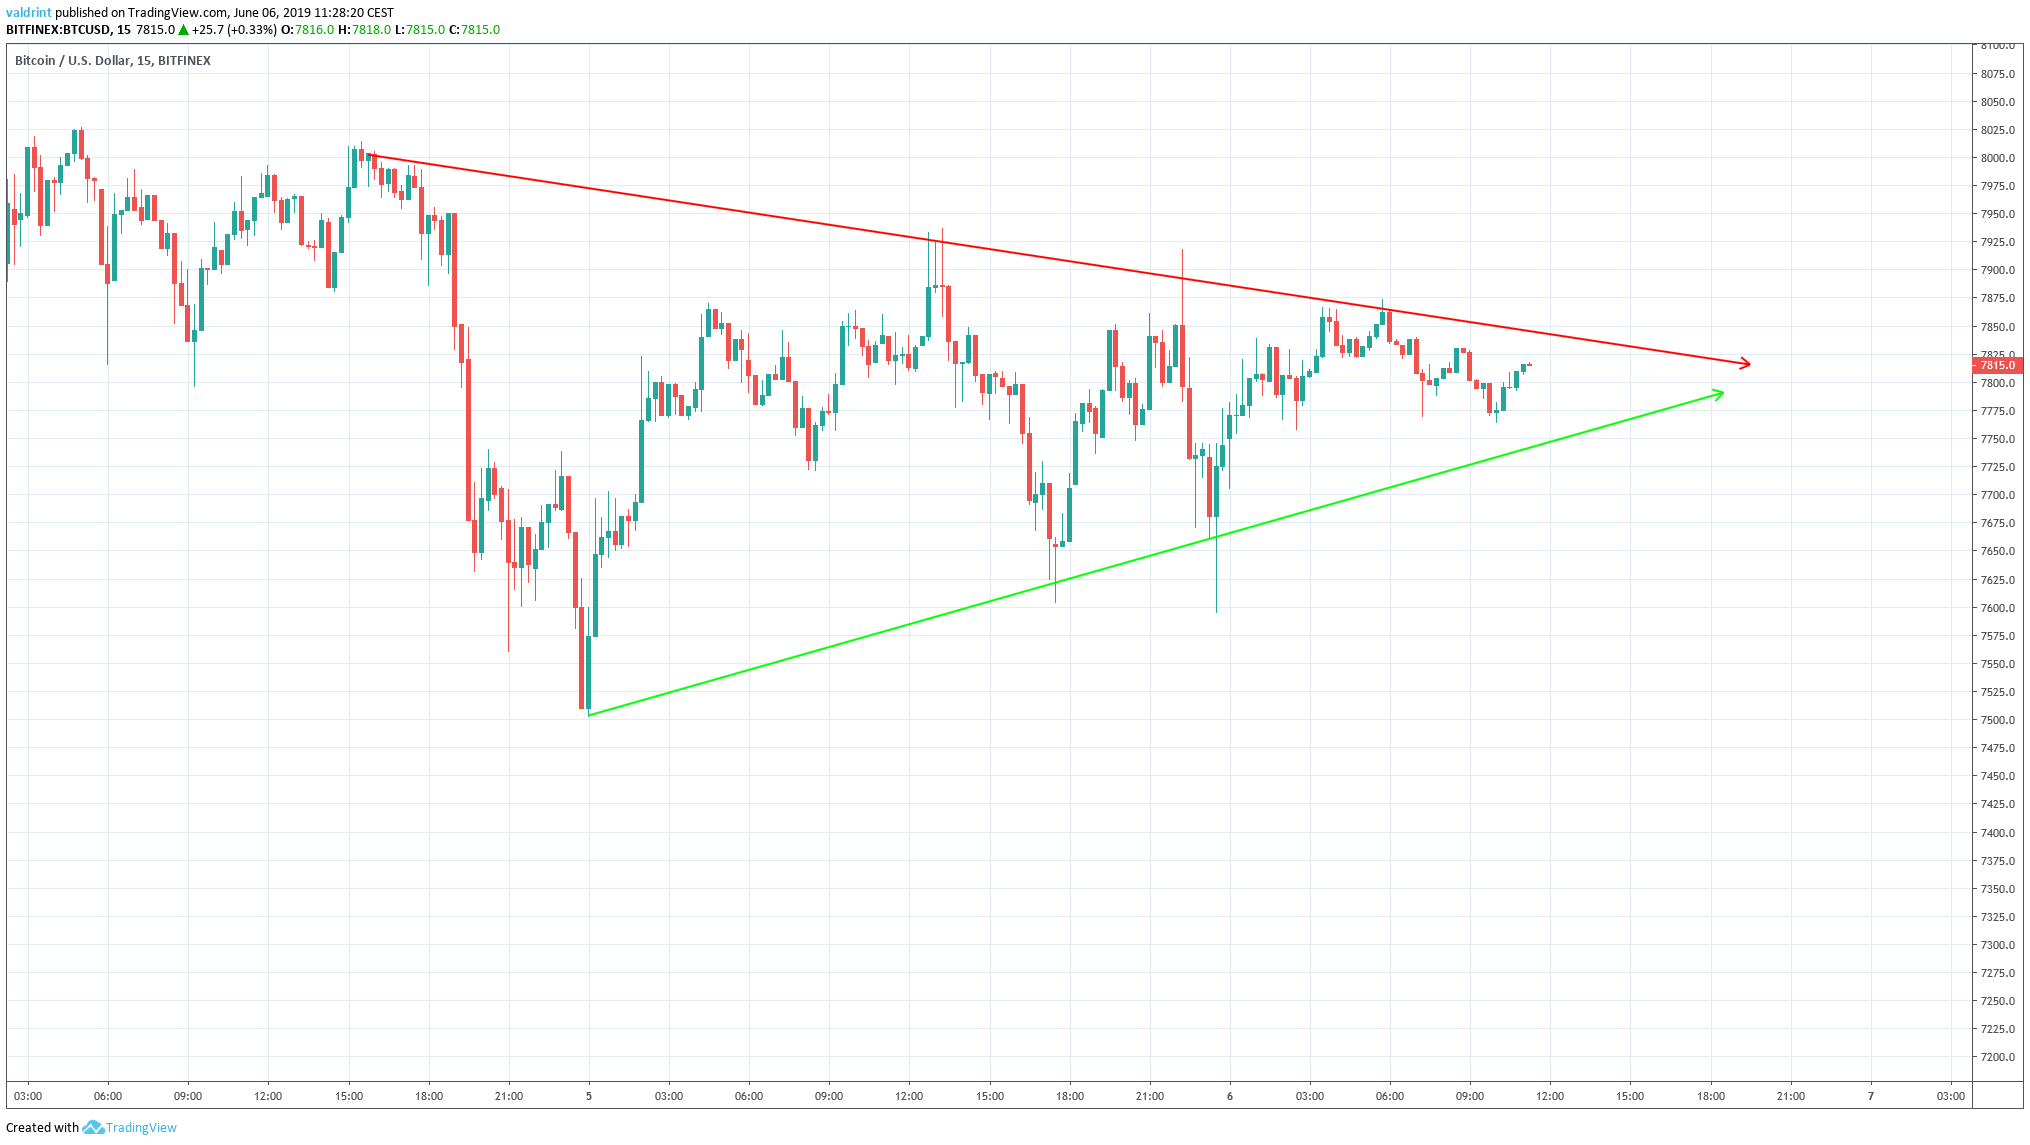
At the time of writing, the BTC price was nearing the point of convergence between the resistance and support lines of the triangle. At that point, a decisive upward or downward move is likely to occur.
Next, we will analyze this possible short-term upward move and try to predict its direction.
BTC Price: Technical Indicators
The price of BTC is analyzed alongside the 10- and 20- period moving averages (MA) below:
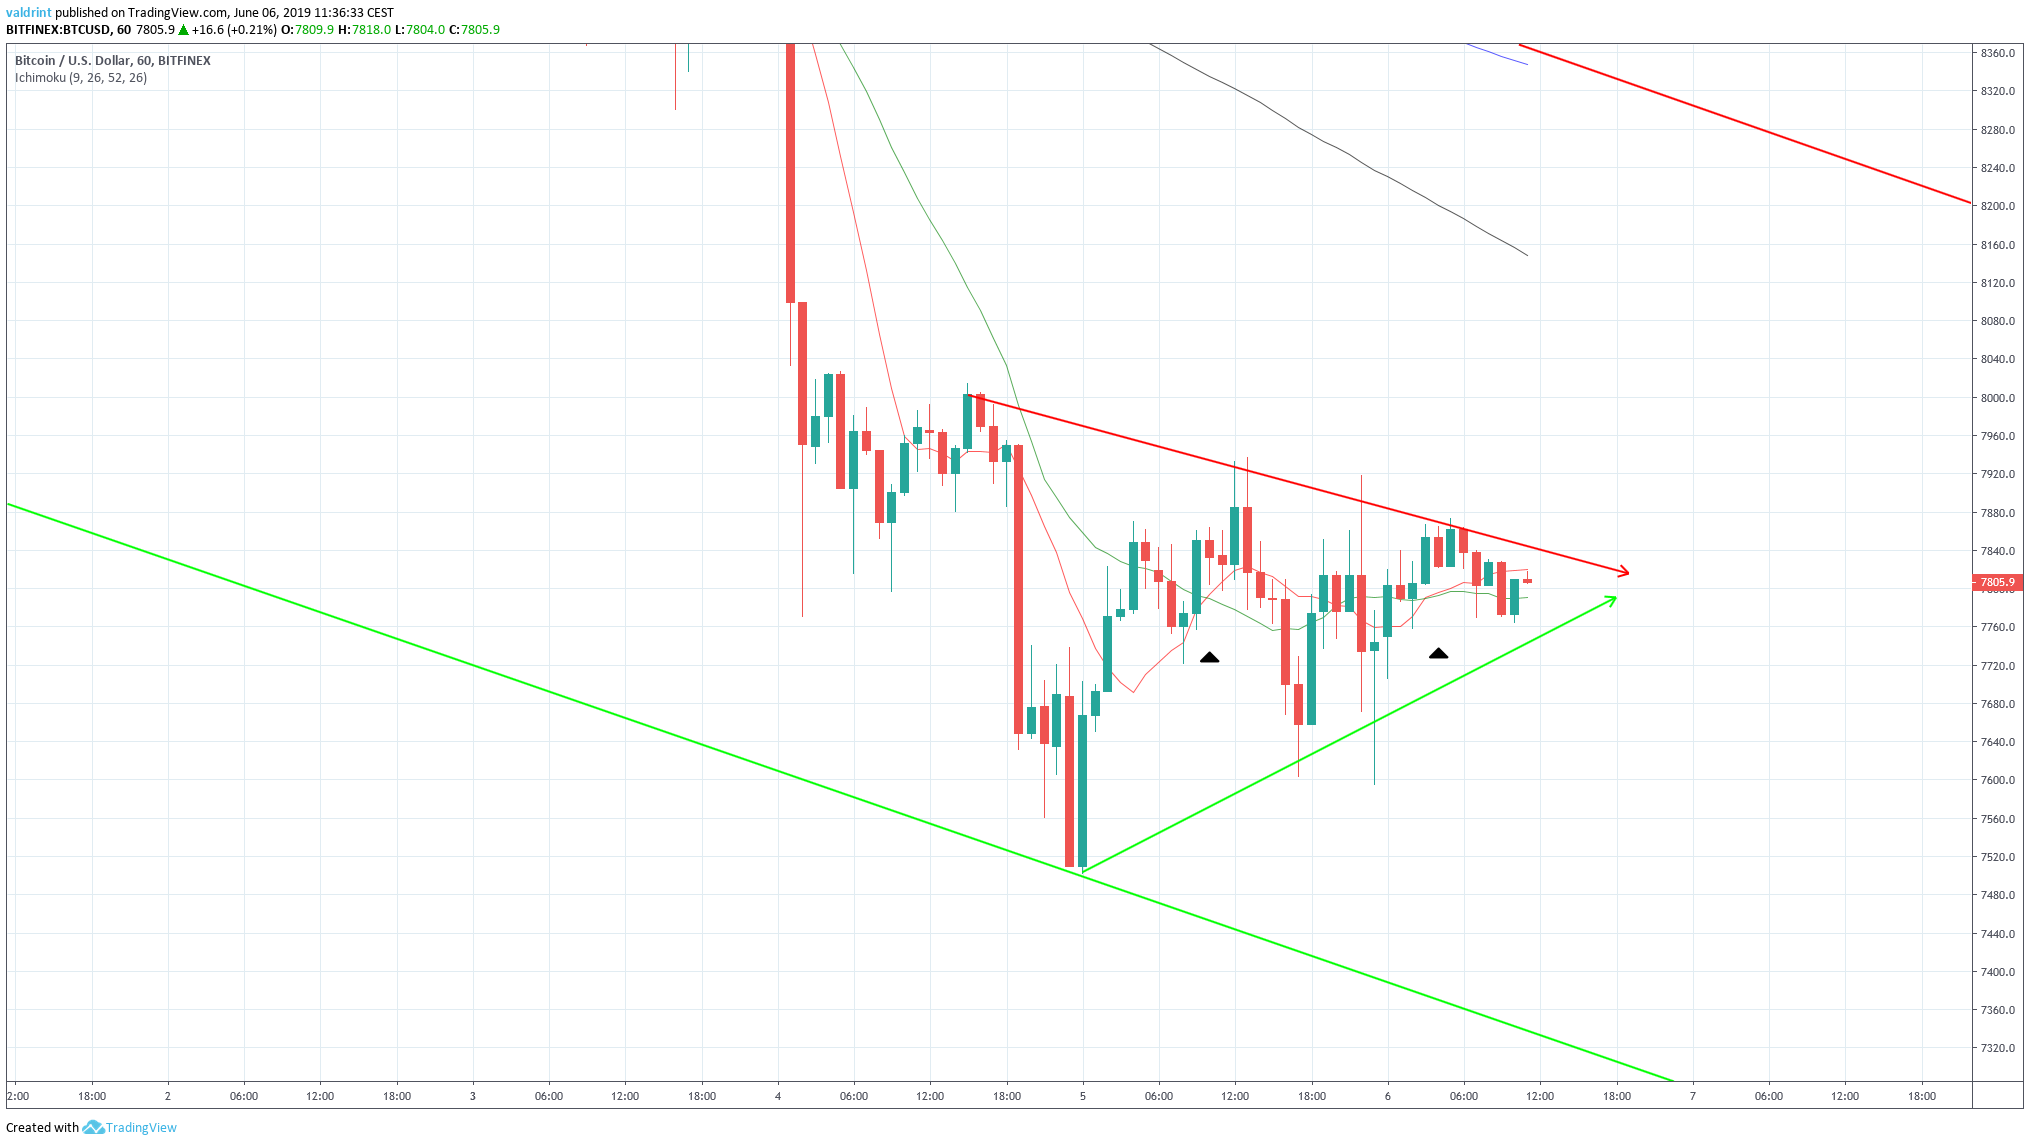
On Jun 5, a bullish cross occurred between the 10- and 20-period MAs. It preceded an unsuccessful breakout attempt from the triangle.
After a gradual decrease, another bullish triangle occurred on Jun 5. The Bitcoin price has yet to make another attempt at a breakout. Will it do so?
This upward move is supported by Elliott Wave theory.
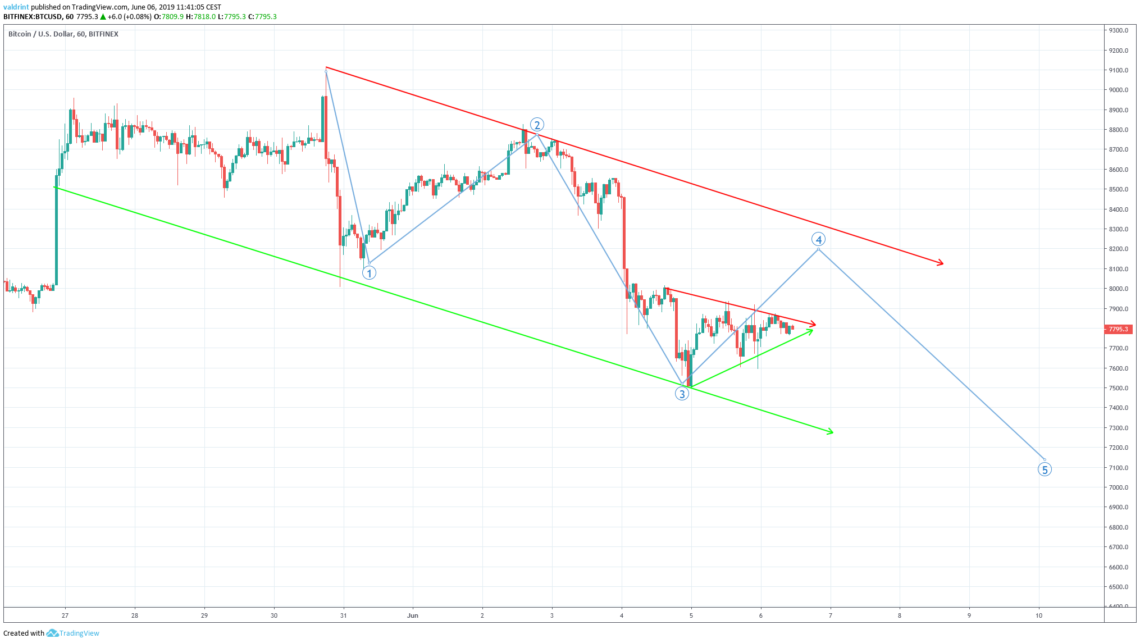
The proposed upward move would complete the fourth wave. The wave count begins at the high reached on May 30.
If a decisive move does occur, where will the price begin to reverse?
Future Movement
Support and resistance areas for BTC/USD are traced in the graph below. They are used to determine future areas of reversal.
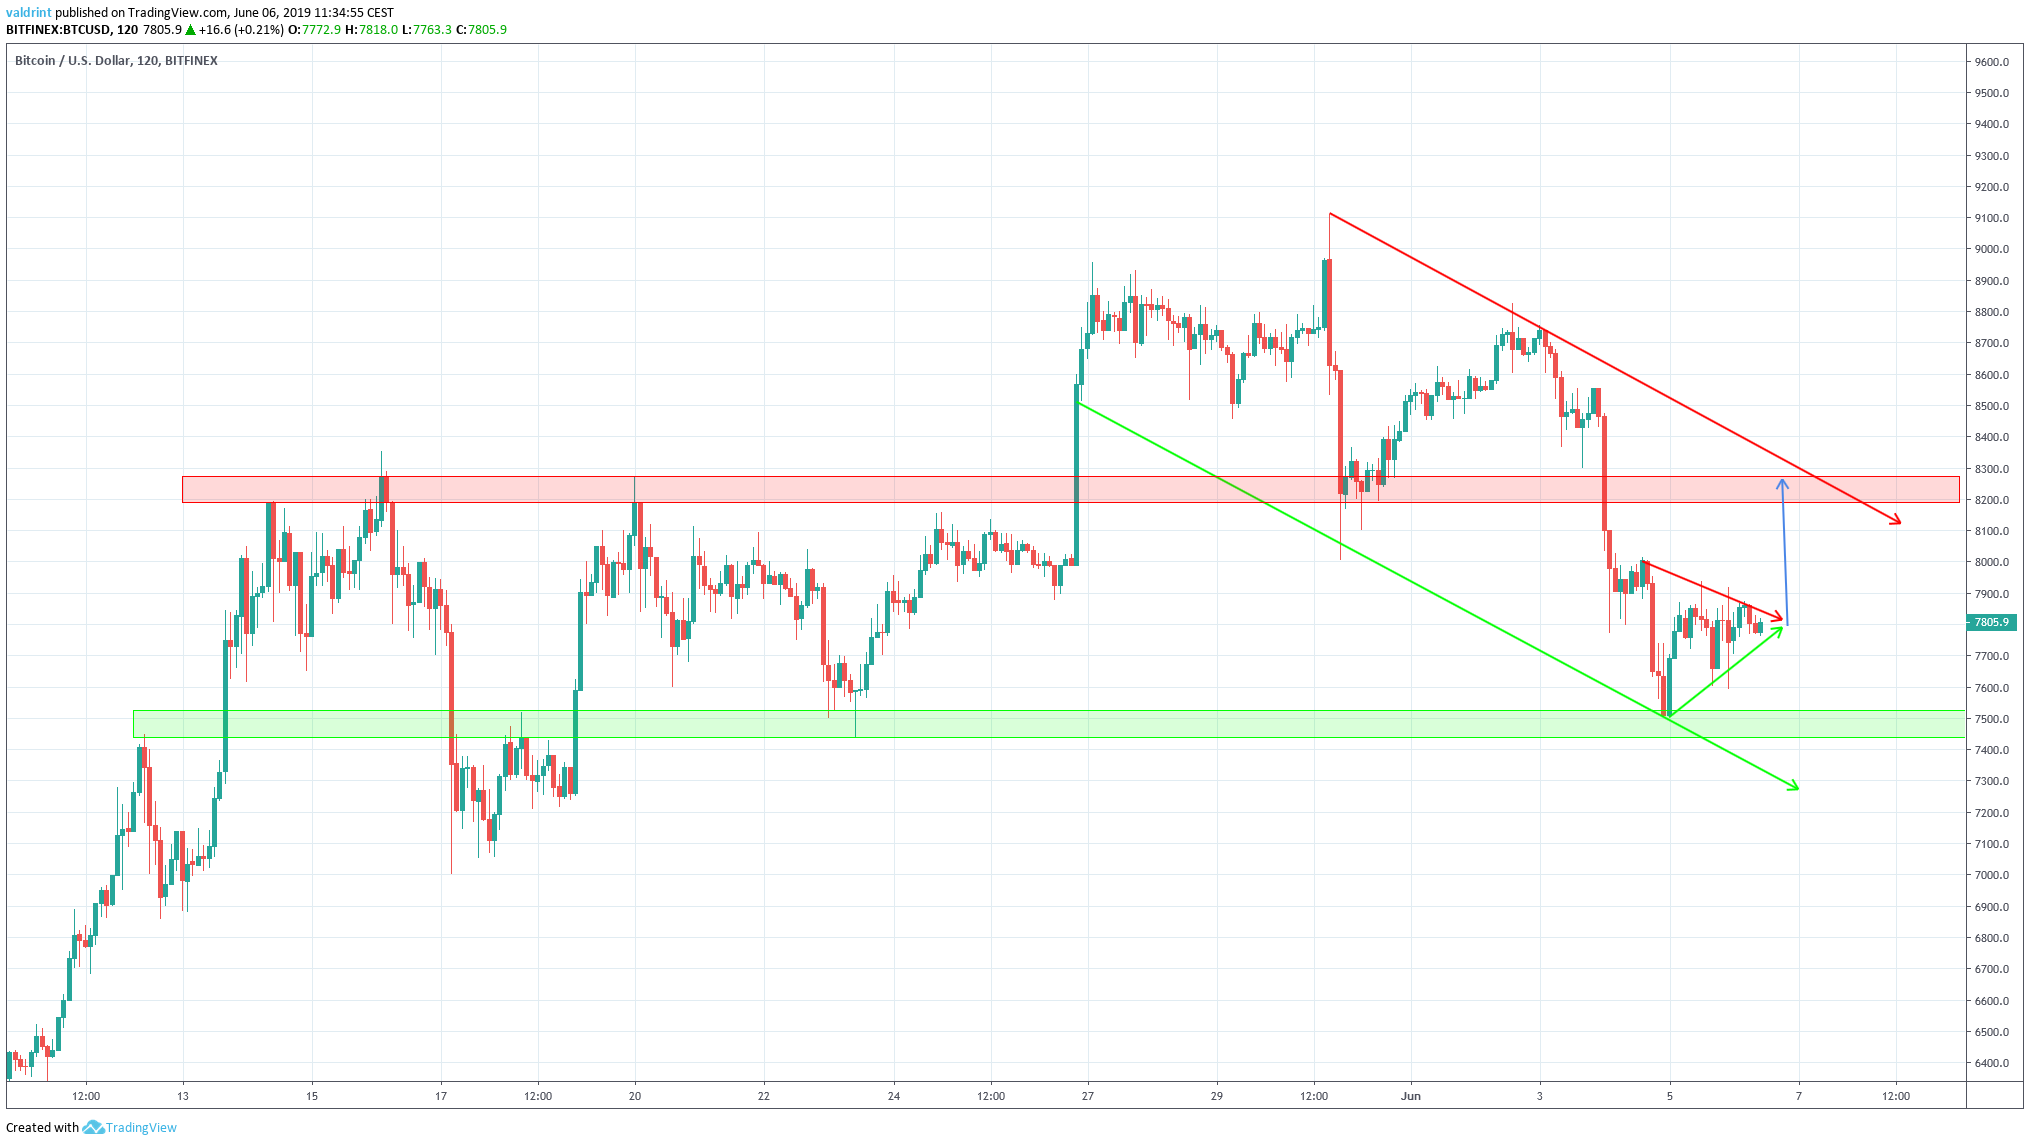
The closest support area is found near $7500. On Jun 5, it was the catalyst for the upward move which created the support lien of the triangle.
The closest resistance area is found near $8200. If the price of BTC breaks out from the triangle, it is likely to reach this area.
Summary
The Bitcoin price is nearing the end of a symmetrical triangle. The technical indicators shows that a breakout is more likely.
Do you think the Bitcoin price will breakout from the triangle? Let us know in the comments below-
Disclaimer: This article is not trading advice and should not be construed as such. Always consult a trained financial professional before investing in cryptocurrencies, as the market is particularly volatile.
